


ABSTRACT
In a volume-limited sample of 63 ultracool dwarfs of spectral type M7–M9.5, we have obtained high-resolution spectroscopy with UVES at the Very Large Telescope and HIRES at Keck Observatory. In this first paper we introduce our volume-complete sample from DENIS and 2MASS targets, and we derive radial velocities and space motion. Kinematics of our sample are consistent with the stars being predominantly members of the young disk. The kinematic age of the sample is 3.1 Gyr. We find that six of our targets show strong Li lines implying that they are brown dwarfs younger than several hundred million years. Five of the young brown dwarfs were unrecognized before. Comparing the fraction of Li detections to later spectral types, we see a hint of an unexpected local maximum of this fraction at spectral type M9. It is not yet clear whether this maximum is due to insufficient statistics, or to a combination of physical effects including spectral appearance of young brown dwarfs, Li line formation, and the star formation rate at low masses.
Export citation and abstract BibTeX RIS
1. INTRODUCTION
Ultracool dwarfs—main-sequence stars and brown dwarfs of spectral class M7–M9.5—are of particular importance for our understanding of Galactic physics for a number of reasons. First, M dwarfs are the most numerous stellar species and represent an important but poorly understood contribution to our Galaxy. Our closest neighborhood is populated by many M dwarfs of which a large fraction remains undetected. Second, at least three physically important regimes exist across the M dwarf spectral classes, just at or close to the temperature range of ultracool dwarfs. These are (1) the star–brown dwarf boundary, (2) the threshold between partially and fully convective stars with potential implications on the magnetic dynamo and activity, and (3) the transition from ionized to predominantly neutral stellar atmospheres. We discuss each of these in turn below.
Stars and brown dwarfs differ by the force that balances their gravitational pressure. In a star, central temperatures and pressure are high enough to start sufficient hydrogen burning that stabilizes the star. In a brown dwarf, electron degeneracy sets in before hydrogen burning so that a brown dwarf cannot reach a stable state but becomes cooler and cooler as it ages. Objects less massive than M ≈ 0.07 M☉ are brown dwarfs, more massive objects are stars (Chabrier & Baraffe 2000). The most massive and youngest brown dwarfs can have spectral types as early as mid-M but enter the L dwarf regime after about 1 Gyr (Burrows et al. 1997; Baraffe et al. 1998).
In main-sequence stars, the threshold between partially and fully convective stars occurs at about M ≈ 0.3 M☉ (Siess et al. 2000). Partially convective stars harbor a tachocline, the boundary layer between the outer convective envelope and the inner radiative core. The tachocline is believed to be the place where the large-scale solar, and by analogy also the Sun-like stellar dynamo is situated (Ossendrijver 2003). This type of dynamo cannot operate in fully convective stars. However, no change in magnetic activity or the magnetic field strengths is observed among M dwarfs (see, e.g., Mohanty & Basri 2003; Reiners & Basri 2007). On the other hand, the timescale for rotational braking and the topology of magnetic fields seem to change at this threshold (Reiners & Basri 2008, 2009).
The third important threshold in the M dwarf regime, the transition from ionized to partially neutral atmospheres, occurs among the ultracool dwarfs of spectral type about M9, i.e., at temperatures of about 2400 K (Meyer & Meyer-Hofmeister 1999; Fleming et al. 2000; Mohanty et al. 2002). There is strong observational evidence that around spectral type M9, normalized Hα emission gradually decreases with spectral type, i.e., with temperature (e.g., Mohanty & Basri 2003), and that rotational braking becomes very inefficient at this point (Reiners & Basri 2008).
This is the first of two papers in which we report on high-resolution spectroscopy in a volume-complete sample of ultracool M dwarfs. In this one, we introduce the sample and search for young brown dwarfs via the lithium test. We derive radial velocities and report space velocities, from which we derive the kinematic age. In a second paper, we will investigate the properties related to activity, which are rotation, Hα emission, and magnetic flux.
2. SAMPLE SELECTION AND OBSERVATIONS
2.1. The Sample
We constructed a sample of known M dwarfs of spectral type M7–M9.5 that is almost volume-complete (d < 20 pc). The targets are taken from several catalogs and discoveries from the Deep Near Infrared Survey of the Southern Sky (DENIS) and the Two Micron All Sky Survey (2MASS) surveys.
Cruz et al. (2007) present a volume-limited sample from 2MASS that contains objects in the spectral range M7–L8. Distances are derived from spectrophotometry with MJ estimated from the spectral-type/MJ calibration from Cruz et al. (2003). This MJ is combined with photometry from the 2MASS Second Incremental Data Release Point Source Catalog (PSC) to yield  and spectrophotometric distances. Uncertainties in distance are dominated by the uncertainties in spectral type (see Cruz et al. 2003). This sample covers about 40% of the sky. The sample taken from Cruz et al. (2007) was carefully constructed to yield a sample that is complete and volume-limited with d < 20 pc in the spectral range we consider. Nevertheless, Cruz et al. (2007) note that the sample may miss several objects at M7 due to the (J − Ks)>1.0 selection criterion.
Crifo et al. (2005) and Phan-Bao & Bessel (2006) present two parts of a sample from DENIS that covers most of the late-M dwarfs up to spectral type M8.5. Two later objects were discovered in Delfosse et al. (2001) and Phan-Bao et al. (2006), which make this sample almost complete up to M9.5 while covering ∼13% of the sky.
For 15 targets, we found parallax measurements in the literature, which we use instead of the spectrophotometric distances where available. One target, 2MASS J0041353−562112, was recently reported to show evidence of accretion, which implies that it is very young (∼10 Myr; Reiners 2009). At this age, the object is much brighter affecting the spectrophotometric distance, and we use the distance reported by Reiners (2009). Taking into account parallax and age information, three of the 63 targets are found to be located at a distance d>20 pc. We did not exclude these targets from the following investigation.
We constructed a joint sample of objects within 20 pc from the two surveys. Both surveys together cover more than 50% of the sky and can be considered as almost complete in the spectral range M7–M9.5. The full "20pc–2MASS–DENIS" survey contains 63 objects, four of which are found in both the 2MASS and the DENIS surveys. The constructed survey probably misses a few M7 and a few very late-M dwarfs, and at least three of the targets are likely to be located farther away than 20 pc. Nevertheless, the constructed sample probably provides a representative and robust picture of late-M dwarfs in the solar neighborhood. We show the distribution of spectral types in the sample in Figure 1. The sample targets are given with their apparent J-band magnitude and spectrophotometric distance in Table 1.

Figure 1. Spectral type distribution of the sample targets.
Download figure:
Standard image High-resolution imageTable 1. Sample Targets and their Space Motion
| Name | Other Name | SpType | J | d (pc) | U (km s−1) | V (km s−1) | W (km s−1) | vrad* (km s−1) | pmRef | Note |
|---|---|---|---|---|---|---|---|---|---|---|
| 2MASS J0019262+461407 | M8.0 | 12.60 | 19.50 | 0 | −25 | −5 | −19.5 | Li | ||
| 2MASS J0019457+521317 | M9.0 | 12.79 | 18.70 | −6 | −38 | −6 | −29.1 | ... | ||
| 2MASS J0024246−015819 | BRI 0021-0214 | M9.5 | 11.99 | 11.55 | −1 | 12 | −6 | 10.4 | ... | |
| 2MASS J0024442−270825B | LHS 1070B | M8.5 | 9.25 | 7.71 | −17 | 16 | 35 | −35.1 | (3) | SB1 |
| 2MASS J0027559+221932A | LP 349-25A | M8.0 | 10.61 | 10.30 | −8 | −26 | 3 | −16.8 | SB1 | |
| 2MASS J0041353−562112 | M7.5 | 11.96 | 35.00a | −10 | −21 | −2 | 6.8 | (1) | Li | |
| 2MASS J0109511−034326 | LP 647-13 | M9.0 | 11.69 | 11.10 | −14 | −12 | 8 | −6.5 | ... | |
| 2MASS J0123112−692138 | M8.0 | 12.32 | 17.20 | −2 | −13 | −5 | 10.9 | Li | ||
| 2MASS J0148386−302439 | M7.5 | 12.30 | 18.40 | 0 | 11 | −12 | 9.6 | ... | ||
| 2MASS J0248410−165121 | LP 771-21 | M8.0 | 12.55 | 16.23 | 11 | −17 | −7 | 4.1 | ... | |
| 2MASS J0306115−364753 | M8.5 | 11.69 | 11.30 | 32 | −21 | −11 | 10.6 | (2) | ... | |
| 2MASS J0320596+185423 | LP 412-31 | M8.0 | 11.76 | 15.21b | −46 | −20 | −22 | 44.9 | ... | |
| 2MASS J0331302−304238 | LP 888-18 | M7.5 | 11.36 | 13.44f | 10 | −28 | −18 | 23.4 | ... | |
| 2MASS J0334114−495334 | M9.0 | 11.38 | 8.20 | −66 | −95 | −8 | 71.4 | ... | ||
| 2MASS J0339352−352544 | LP 944-20 | M9.0 | 10.73 | 4.97 | −12 | −5 | −2 | 7.6 | Li | |
| 2MASS J0351000−005244 | LHS 1604 | M7.5 | 11.30 | 14.68e | 28 | −28 | −6 | −14.7 | ... | |
| 2MASS J0417374−080000 | M7.5 | 12.18 | 17.40 | −39 | −40 | 3 | 38.4 | ... | ||
| 2MASS J0429184−312356A | M7.5 | 10.87 | 15.15f | −26 | −23 | −22 | 39.6 | ... | ||
| 2MASS J0435161−160657 | LP 775-31 | M7.0 | 10.41 | 8.60 | −46 | −19 | −23 | 52.5 | SB2 | |
| 2MASS J0440232−053008 | LP 655-48 | M7.0 | 10.66 | 9.80 | −29 | −14 | 0 | 27.5 | ... | |
| 2MASS J0443376+000205 | SDSS 0443+0002 | M9.0 | 12.51 | 16.20 | −11 | −11 | −10 | 17.1 | Li | |
| 2MASS J0517376−334902 | DE-P J0517-3349 | M8.0 | 12.00 | 17.06f | 6 | −55 | 8 | 31.4 | (2) | ... |
| 2MASS J0544115−243301 | M8.0 | 12.53 | 18.70 | 37 | −52 | −17 | 20.8 | ... | ||
| 2MASS J0741068+173845 | LHS 1937 | M7.0 | 12.01 | 17.90 | −31 | −48 | −18 | 38.6 | ... | |
| 2MASS J0752239+161215 | LP 423-31 | M7.0 | 10.88 | 10.50 | 24 | −11 | −5 | −18.4 | ... | |
| 2MASS J0818580+233352 | M7.0 | 12.18 | 19.10 | −9 | −40 | 28 | 33.1 | ... | ||
| 2MASS J0853362−032932 | LHS 2065 | M9.0 | 11.21 | 8.53e | −13 | −9 | −17 | 6.4 | ... | |
| 2MASS J1006319−165326 | LP 789-23 | M7.5 | 12.04 | 16.40 | −33 | −20 | 8 | 27.8 | (2) | ... |
| 2MASS J1016347+275149 | LHS 2243 | M8.0 | 11.99 | 14.40 | −8 | −39 | 14 | 24.4 | ... | |
| 2MASS J1024099+181553 | M8.0 | 12.27 | 16.50 | −10 | −9 | −2 | 6.0 | ... | ||
| 2MASS J1048126−112009 | M7.0 | 8.86 | 4.50 | 28 | −16 | −14 | −0.2 | (2) | ... | |
| 2MASS J1048147−395606 | DE-P J1048-3956 | M9.0 | 9.54 | 4.00b | −11 | 3 | −30 | −12.9 | ... | |
| 2MASS J1121492−131308A | LHS 2397aA | M8.0 | 11.93 | 14.29e | −25 | −36 | 9 | 31.8 | SB1 | |
| 2MASS J1124048+380805 | M8.5 | 12.71 | 19.00 | 16 | 2 | −9 | −14.0 | ... | ||
| 2MASS J1141440−223215 | M8.0 | 12.63 | 17.20 | −23 | 5 | 26 | 8.4 | (2) | ... | |
| 2MASS J1155429−222458 | LP 851-346 | M7.5 | 10.93 | 9.70 | −14 | −2 | −18 | −13.1 | (2) | ... |
| 2MASS J1224522−123835 | BR 1222-1221 | M9.0 | 12.57 | 17.06 | −13 | −17 | −16 | −5.8 | ... | |
| 2MASS J1246517+314811 | LHS 2632 | M7.5 | 12.23 | 18.10 | −60 | −32 | 4 | 5.1 | ... | |
| 2MASS J1253124+403403 | LHS 2645 | M7.5 | 12.19 | 17.50 | 43 | −30 | 15 | 3.6 | ... | |
| 2MASS J1309218−233035 | CE 303 | M8.0 | 11.78 | 13.30 | 19 | −25 | −8 | 19.3 | ... | |
| 2MASS J1332244−044112 | M7.5 | 12.37 | 18.90 | −4 | 13 | −13 | −16.9 | ... | ||
| 2MASS J1356414+434258 | LP 220-13 | M7.0 | 11.71 | 15.60 | −29 | −26 | −14 | −22.2 | ... | |
| 2MASS J1403223+300754 | M8.5 | 12.68 | 18.80 | −60 | −55 | −21 | −42.4 | ... | ||
| 2MASS J1411213−211950 | M9.0 | 12.44 | 15.70 | −2 | 5 | 5 | −0.8 | Li | ||
| 2MASS J1438082+640836 | M9.5 | 12.98 | 18.40 | 57 | 1 | −47 | −44.9 | ... | ||
| 2MASS J1440229+133923 | LSPM J1440+1339 | M8.0 | 12.40 | 17.60 | 7 | −30 | −7 | −5.2 | ... | |
| 2MASS J1456383−280947 | LHS 3003 | M7.0 | 9.97 | 6.37 | −5 | −26 | −12 | 0.9 | ... | |
| 2MASS J1507277−200043 | M7.5 | 11.71 | 22.83f | 6 | 3 | −12 | −2.5 | ... | ||
| 2MASS J1521010+505323 | M7.5 | 12.01 | 16.10 | 17 | −3 | 2 | 0.9 | ... | ||
| 2MASS J1534570−141848 | M7.0 | 11.38 | 11.09f | −81 | −35 | −23 | −75.5 | ... | ||
| 2MASS J1546054+374946 | M7.5 | 12.44 | 19.70 | 1 | −21 | −18 | −24.9 | ... | ||
| 2MASS J1757154+704201 | LP 44-162 | M7.5 | 11.45 | 19.08d | −28 | −16 | −9 | −13.5 | ... | |
| 2MASS J1835379+325954 | LSR J1835+3259 | M8.5 | 10.27 | 5.67 | 22 | −1 | −3 | 8.5 | ... | |
| 2MASS J1843221+404021 | LHS 3406 | M8.0 | 11.31 | 14.14e | −42 | −14 | 13 | −22.3 | ... | |
| 2MASS J2037071−113756 | M8.0 | 12.27 | 16.80 | −16 | −47 | 7 | −38.7 | ... | ||
| 2MASS J2206227−204706 | M8.0 | 12.37 | 26.67c | 4 | −1 | −10 | 9.8 | SB1 | ||
| 2MASS J2226443−750342 | DE-P J2226-7503 | M8.5 | 12.35 | 16.50 | 5 | −8 | −12 | 14.7 | ... | |
| 2MASS J2237325+392239 | G 216-7B | M9.5 | 13.34 | 18.89 | 21 | −64 | −9 | −61.2 | ... | |
| 2MASS J2306292−050227 | M8.0 | 11.35 | 12.11c | −44 | −67 | 16 | −56.3 | ... | ||
| 2MASS J2331217−274949 | M8.5 | 11.65 | 14.46c | −27 | 43 | 3 | −4.2 | (1) | ... | |
| 2MASS J2349489+122438 | LP 523-55 | M8.0 | 12.60 | 19.60 | 8 | −15 | −10 | −3.5 | ... | |
| 2MASS J2351504−253736 | M8.0 | 12.47 | 18.20 | −37 | −3 | 3 | −10.0 | ... | ||
| 2MASS J2353594−083331 | M8.5 | 13.03 | 19.10 | 20 | −13 | − 40 | 32.7 | (1) | ... |
Notes. Li: lithium brown dwarf; SB1: single lined binary; SB2: double lined binary. *The typical uncertainty for vrad is 1–3 km s−1 depending on rotational line broadening. References. (a) Reiners 2009; (b) Costa et al. 2005; (c) Costa et al. 2006; (d) Lépine et al. 2009; (e) Monet et al. 1992; (f) Bartlett 2006; proper motion usually taken from Faherty et al. 2009, except for (1) Phan-Bao et al. 2001; (2) Phan-Bao et al. 2003; (3) Salim & Gould (2003).
Download table as: ASCIITypeset image
2.2. Known Binaries
Our sample contains four binaries that we were previously aware of; LHS 1070B (2MASS J0024442−270825B) has a companion (Leinert et al. 1994) that is about 0 2 away at the time of observation (Seifahrt et al. 2008). LP 349-25A (2MASS J0027559+221932A) was found to be a binary by Forveille et al. (2005), and companions to 2MASS J1124048+380805 and 2MASS J2206227−204706 were discovered by Close et al. (2003). In all four systems, the spectra are dominated by the brighter component so that we carried out our analysis in the same way as for single stars.
During our analysis, we discovered that one of our targets, LP 775-31 (2MASS J0435151−160657), shows a double-peaked cross-correlation profile indicative of a double-lined spectroscopic binary (SB2), i.e., it is a binary consisting of two nearly equally bright components.
2.3. Observations
Observations for our 63 sample targets were collected using the High-Resolution Echelle Spectrometer (HIRES) spectrograph at Keck observatory for targets in the northern hemisphere, and using the Ultraviolet and Visual Echelle Spectrograph (UVES) at the Very Large Telescope at Paranal observatory for targets in the southern hemisphere (PIDs 080.D-0140 and 081.D-0190). HIRES data were taken with a 115 slit providing a resolving power of R = 31, 000. The three HIRES CCDs cover the spectral range from 570 to 1000 nm in one exposure. UVES observations were carried out using a setup centered at 830 nm covering the spectral range 640–1020 nm. All data provide the Hα line as well as the molecular absorption bands of molecular FeH around 1 μm that are particularly useful for the determination of rotation and magnetic fields in M dwarfs. These will be investigated in a second paper.
Data reduction followed standard procedures including bias subtraction, two-dimensional flat-fielding, and wavelength calibration using ThAr frames. HIRES data were reduced using the MIDAS echelle environment. For the UVES frames, we used the ESO CPL pipeline, version 4.3.0. There are two important differences to the standard pipeline products. First, the version of the pipeline used in Period 81 produced wavelengths that are offset from the correct solution by a constant factor of 1 Å, this bug has been fixed in version 4.3.0. Second, the standard pipeline extracts the spectra before flat-fielding, which is not appropriate for spectra with strong fringing patterns. The new pipeline version allows to flat-field the original two-dimensional frames so that fringe patterns are effectively removed.
The apparent brightness of our targets are in the range J = 8.9–13.4 mag. Exposure times between 200 s and 3 hr yielded signal-to-noise ratios between 20 and 100 at 1 μm in all objects.
3. MEASUREMENTS
3.1. Li Absorption
Our spectra cover the 6708 Å Li line that can be used for the "lithium-test" in low-mass objects (e.g., Magazzu et al. 1991; Basri 2000). In our spectra, the detection limit of the Li line is around 0.5 Å. While stars quickly deplete Li on a timescale of 100 Myr and less, brown dwarfs need longer for this process or do not entirely deplete Li at all. We show evolutionary tracks from D'Antona & Mazzitelli (1997) in Figure 2. The dashed blue line marks the region where Li is depleted by 99%, i.e., objects with detected Li lie on the left hand side of this line. For the temperatures of our sample stars, 2400 K ≲ Teff ≲ 2800 K, this means that objects with Li are less massive than about 65 Mjup, and younger than ∼0.5 Gyr. This also means that they are less massive than the substellar limit at 75 Mjup, hence they are young brown dwarfs.

Figure 2. Evolutionary tracks of low-mass stars and brown dwarfs from D'Antona & Mazzitelli (1997), we chose the 1998 updated models with a deuterium abundance XD = 10−5 (Censori & D'Antona 1998). Tracks are shown in red where the Li abundance is depleted by 99% and more. The dashed blue line divides the plot into regions where Li is not yet depleted (left of the dashed line) and depleted (right). Approximate spectral types according to Golimowski et al. (2004) are indicated on the right axis. Note that this plot covers the mid- and late-M dwarfs and that the L dwarf regime is not shown.
Download figure:
Standard image High-resolution imageWe have detected Li in six of the 63 objects in our sample, i.e., about 10% of our sample are brown dwarfs younger than about 0.5 Gyr. The Li lines of all six objects are shown in Figure 3. Only one of the targets, LP 944-20 (2MASS J0339352−352544), was previously known as a young brown dwarf through the detection of its Li line (Tinney 1998). Youth and brown dwarf nature of the other five objects were unknown before. Cruz et al. (2007) classified 2MASS J0443376+000205 as a low-gravity, hence probably young, object. This classification is supported by our Li detection.

Figure 3. Li lines, from left to right: top row: 2MASS J0019262+461407 (M8.0, note that rapid rotation causes the broad and relatively shallow Li line), 2MASS J0041353−562112 (M7.5), 2MASS J0123112−692138 (M8.0); bottom row: 2MASS J0339352−352544 (M9.0), 2MASS J0443376+000205 (M9.0), 2MASS J1411213−211950 (M9.0). Spectra have been smoothed with a 15 pixel box-car for better visibility.
Download figure:
Standard image High-resolution image3.2. Radial Velocities and Space Motion
Radial velocities were measured relative to a spectrum of a standard star. We used Gl 406 as radial velocity standard (vrad = 19 ± 1 km s−1; Martín et al. 1997) using the cross-correlation technique and correcting for barycentric motion. We corrected for wavelength calibration inconsistencies by cross-correlating telluric lines in the O2 A band. Thus, uncertainties in our radial velocities are on the order of 1–3 km s−1 depending on rotational line broadening. The uncertainties of the spectrophotometric distance are typically on the order of ∼10%. For our sample of nearby objects this introduces an uncertainty in the space motion components of typically ∼1 km s−1. If an object is substantially younger than assumed for the spectrophotometric distance calculation, the error is much larger. This effect is illustrated for 2MASS J0041353−562112 in Reiners (2009), but is probably not important in the other objects.
Space motions U, V, and W were computed using the IDL procedure gal_uvw,4 but we use a right-handed coordinate system with U toward the Galactic center. For most of our targets, proper motions are reported in Faherty et al. (2009). Phan-Bao et al. (2001) and Phan-Bao et al. (2003) measured proper motions for some of our objects, and we use their values where available. One object, LHS 1070B (2MASS J0024442−270825B), is not included in either of the works, and we use the proper motion given in Salim & Gould (2003). All radial velocities and space motion vectors [U, V, W] together with the references for distance and proper motion are given in Table 1.
4. RESULTS
4.1. Lithium Brown Dwarfs
From our volume-limited sample, we can draw robust constraints on the fraction of young brown dwarfs among the ultracool dwarfs. Our results are summarized in Table 2. Reid et al. (2002b) found fractions of  for M7–M9.5 dwarfs and
  for M8–M9.5 dwarfs. The Li fractions from our sample are somewhat higher than the ones reported in Reid et al. (2002b), but the discrepancy does not exceed the uncertainties due to the small sample size.
Table 2. Li Fractions
| Spectral Bin | NLi | Ntot | Li Fraction (%) |
|---|---|---|---|
| M7–M9.5 | 6 | 63 | 10+4−3 |
| M8–M9.5 | 5 | 39 | 13+7−4 |
| M7/M7.5 | 1 | 24 | 4+9−1 |
| M8/M8.5 | 2 | 27 | 7+9−2 |
| M9/M9.5 | 3 | 12 | 25+15−8 |
Download table as: ASCIITypeset image
We conclude that the fraction of lithium brown dwarfs among M7–M9.5 dwarfs is at most only little higher than previously reported. This means that the mass function index α could perhaps be a little higher than reported in Reid et al. (2002b). Nevertheless, their conclusion that α < 2 for both the Arizona and Lyon models is still valid.
Kirkpatrick et al. (2008) investigated the fraction of objects with Li detections among L dwarfs together with a search for objects with spectroscopic signatures of youth, i.e., low gravity. They show that the fraction of Li detections is about 10% at spectral type L0 and rises to about 50%–60% at mid-L (see their Figure 17). After L6, the fraction turns over and declines toward the late-L types probably because Li disappears into molecules (Lodders 1999). Kirkpatrick et al. (2008) emphasize that Li is probably not detectable in very young L dwarfs, i.e., during the first few ten million years, because the Li line is not visible at very low gravity.
We plot the fraction of lithium brown dwarfs as a function of spectral types M7–L8 in Figure 4. M7–M9 dwarfs are from this work and from Reid et al. (2002b), L dwarfs are taken from Reiners & Basri (2008), and from the Li analysis of Kirkpatrick et al. (2008) including data from Kirkpatrick et al. (1999, 2000). While the Kirkpatrick et al. works employ low-resolution LRIS spectra, the other Li detections are based on spectra with higher spectral resolution. Nevertheless, the detection thresholds from the different samples are not very different because in L dwarfs it is usually not the spectral resolution that limits the detection of Li (note that the Li lines shown in Figure 3 are smoothed to a lower effective resolution). Comparing the subsamples taken from high- and low-resolution spectra, we see no difference in the fraction of Li detections, and the results for objects that are contained in both samples are consistent.

Figure 4. Fraction of objects with detected Li per spectral type. M7–M9 objects are from this work and Reid et al. (2002b), and L dwarfs are from Reiners & Basri (2008) and Kirkpatrick et al. (1999, 2000, 2008). Numbers denote the total number of objects per spectral bin, error bars are 1σ uncertainties.
Download figure:
Standard image High-resolution imageThe fraction of lithium brown dwarfs among ultracool dwarfs continually rises from M7 to M9, because late-M dwarfs in general are less massive, so that the fraction of objects with M ≲ 0.07 M☉ is growing toward later spectral types. In Figure 4, there is also a general trend that the Li fraction rises from M7 to mid-L, which is consistent with a higher brown dwarf fraction at later spectral type. Note that the time required to deplete Li in high-mass brown dwarfs (≳60 Mjup) is longer among the L dwarfs (∼1 Gyr) than at late-M spectral type (∼300 Myr). However, the fraction of Li detections among M9 dwarfs is much higher than at M8, and, in particular, it is much higher than at spectral types L0 and L1. The number of objects in this sample is still fairly low, and the results are formally still consistent with a smooth rise in the range M7–L6 if the M9 bin is interpreted as an outlier. On the other hand, the discontinuity at spectral type M9 is fairly high while the overall scatter between the other bins is rather small. Three out of the 15 objects at spectral type M9 and M9.5 show Li, all three are most likely within 20 pc. The statistical significance of the M9 discontinuity is comparable to that of the apparent downturn in Li at late L types noted by Kirkpatrick et al. (2008). In the following, we discuss possible explanations.
The first possible explanation is that our combined sample is not strictly volume-limited, in particular the L dwarfs are not selected according to their distance. This implies a bias toward young objects and probably causes an excess of young dwarfs that still have Li. Most distances of our M dwarf sample are taken from spectrophotometry, which means that a few other young objects contained in our M dwarf sample may be situated outside 20 pc. However, this problem should apply even more to the early-L dwarfs, in which no effort was made to include faint old objects out to a certain distance. Thus, one would expect the early-L dwarfs to be biased toward higher fraction of Li detections, and this bias should be higher than the bias among the late-M dwarfs. Furthermore, the fraction of Li detections in our M9/M9.5 targets from the volume-limited sample is higher than the fraction in the full sample including the targets from Reid et al. (2002b). Thus, an observational effect that causes a bias toward young objects particularly at the M9 spectral bin is unlikely an explanation for the observed discontinuity.
A second potential reason for the discontinuity is that the L dwarf spectra are of lower quality compared to the M dwarf spectra taken for this work. This would lead to a higher Li detection threshold and hence a lower detection rate. While such an explanation might hold for the low-resolution spectra (a detection threshold of 3 Å is reported in Kirkpatrick et al. 1999, 2000, 2008), it does not apply to the high-resolution spectra of Reiners & Basri (2008). In the latter sample alone, the ratio of Li detections to total number of targets is 0/10 (0%) at spectral type L0 and 1/14 (7%) at spectral type L1, which is an even lower ratio than the one from low-resolution spectra in Kirkpatrick et al. (2008). Thus, differences in data quality do probably not lead to systematic differences in the Li fraction, and it seems unlikely that the detection threshold is the main reason for the low fraction of Li detections at early L dwarfs.
As a third potential reason, we speculate that the discontinuity is real, i.e., the fraction of objects with detectable Li peaks at spectral type M9. We see two possible ways to explain this. (1) Lithium brown dwarfs with temperatures of ∼2200 K may be classified as M9, but at older ages stars of the same temperature could be classified as L0. Classification of spectral types between M9 and L0 is based on molecular species that are temperature dependent and sensitive to the presence of dust, which is strongly influenced by gravity. In other words, the relation between temperature and spectral class may be a function of age. (2) The history of the star formation rate together with the detectability of Li as a function of age (see Kirkpatrick et al. 2008) may conspire so that today we observe an excess of Li detections at spectral type M9. This may imply a burst of star formation at a particular age. So far, however, we are not convinced that either of the two is a very likely scenario, and we will have to wait for a larger sample and better distance estimates to see whether the maximum disappears with better statistics.
4.2. Space Motion of Ultracool Dwarfs
Space motions of M dwarfs and ultracool dwarfs have raised a lot of interest during the last decades because the velocity dispersion of a sample can be tied to its age, which allows the study of the star formation rate and the time-dependence of physical processes like for example activity. Hawley et al. (1996) have shown in a volume-limited sample of M dwarfs that the velocity dispersion of active dMe stars is smaller than the dispersion of older non-active stars. Reid et al. (2002b) determined the velocity dispersion of ultracool objects finding that the velocity dispersion of their M7–M9.5 sample is smaller than the dispersion in the full dM sample of Hawley et al. (1996). Reid et al. (2002a) revisit the space velocities of ultracool M dwarfs suggesting that the early-M dwarf sample consists of members of both the thick disk and the thin disk. Late-M dwarfs, on the other hand, may have lost their thick disk component because the lower metallicity of these stars moves the hydrogen burning limit to earlier spectral types so that these stars have cooled toward later spectral types and don't show up as M7–M9.5 objects any longer.
We show the space velocities in U−V and U−W diagrams in Figure 5, and the distribution of U, V, and W in Figure 6. Lithium brown dwarfs are shown as red stars in Figure 5 and are overplotted as filled red histograms in Figure 6. The distribution of space velocities in ultracool dwarfs is clearly concentrated around the thin disk, and the six lithium brown dwarfs cluster in a very narrow range in the center of the thin disk in all three space velocities. This clustering implies a very small velocity dispersion, which is an indicator for a young sample (see Wielen 1977, and the following section). Thus, space velocities of lithium brown dwarfs are consistent with very low age. In the following, we will derive the age of our sample of M7–M9.5 dwarfs.

Figure 5. Space velocities in U − V (left) and U − W (right) diagrams. The thin disk is indicated as a red ellipsoid, and the six lithium brown dwarfs are shown as red stars.
Download figure:
Standard image High-resolution image
Figure 6. From left to right: histograms of space motion components U, V, and W. The distribution of lithium brown dwarfs is overplotted as a filled red histogram.
Download figure:
Standard image High-resolution image4.3. Ages from Velocity Dispersions
Wielen (1977) has shown how a velocity dispersion of a sample of stars can be used to determine the age of the sample. More recently, Fuchs et al. (2001) refined this picture using more recent data from different works.
First, it is important to realize that the formulae provided by Wielen (1977) are valid for dispersions σU, σV, and σW that are weighted by their vertical velocity |W| (Equations (1)–(3) in Wielen 1977, see also Reid et al. 2002a). Although it might be arguable whether this weighting is useful or not when comparing dispersions from different samples, it has to be applied if the age of a sample should be determined from the formulae in Wielen (1977). The dispersion of space velocities in our sample is (σU, σV, σW) = (27.2, 22.6, 14.6) km s−1, and the |W|-corrected velocity dispersions are (σU, σV, σW) = (30.7, 22.6, 16.0) km s−1.
A second but much more crucial principle for the calculation of ages from velocity dispersions is the calculation of the total velocity dispersion,

This means that σtot is not the dispersion of the total velocity scalar vtot = (U2 + V2 + W2)1/2, since the latter will always be smaller because motions into different directions partially cancel out each other (for example, a sample with velocities equally distributed into all directions but with the same total velocity will have zero dispersion around vtot). The uncorrected total dispersion of our sample is σtot = 38.3 km s−1, and the |W|-corrected total dispersion is σtot = 41.3 km s−1.
It should be noted that, following the same argumentation as for σtot, the total dispersion in the tangential velocity scalar, vtan, cannot be applied to calculate σtot using σtot = (3/2)1/2σtan: the total dispersion in the two-dimensional velocity vtan must be the squared sum of the two individual dispersion components. Thus, the total dispersion in vtan cannot be used for the calculation of age from the Wielen relation.
Recently, kinematics of ultracool dwarfs and brown dwarfs have been presented by Schmidt et al. (2007), Zapatero-Osorio et al. (2007), and Faherty et al. (2009) using the velocity dispersion of a sample of stars to calculate the age of the sample following the work of Wielen (1977). Schmidt et al. (2007) derive an age of 3.1 Gyr for a sample of late-M and L dwarfs, Zapatero-Osorio et al. (2007) find ages of 4 Gyr for their late-M dwarfs and about 1 Gyr for L and T dwarfs, and Faherty et al. (2009) report ages between 2 and 3 Gyr for late-M, L, and T dwarfs. Unfortunately, all three of these papers contain the errors in interpretation of the total velocity dispersion pointed out in the previous two paragraphs.
Once the velocity dispersion σtot is determined for a sample, it can be translated into an age according to Wielen (1977). He presents three different equations to carry out this task, and it is often difficult to find out which prescription authors use when publishing an age for a sample of stars. The first prescription assumes a constant diffusion coefficient and is apparently not much used in recent work (Equation (8) in Wielen 1977). The two other formulae assume velocity-dependent diffusion coefficients. The two formulae, Equations (13) and (16) in Wielen (1977), differ in the way they treat the diffusion coefficient Cv, they are
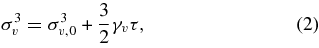
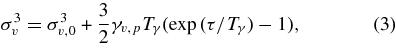
with τ the age of the sample in yr, σv,0 = 10 km s−1, γv = 1.410−5 (km s−1)3 yr−1, γv,p = 1.110−5 (km s−1)3 yr−1, and Tγ = 5109 yr. According to Wielen (1977), Equation (2) is inadequate for ages above 3 Gyr, which means that Equation (3) should be preferred.5
The determination of an age from a stellar sample assumes that the sample members (at least in a very qualitative sense) fulfill the requirement of homogeneity, i.e., their velocity distribution should not differ drastically from a Gaussian distribution. A robust way to investigate the velocity distribution in a sample is to use probability plots, or "probit" plots (Lutz & Upgren 1980). In a probability plot, the data points are sorted and assigned a probability bin, which is the distance to the mean in units of the standard deviation, that each of the sorted points in a strictly Gaussian distribution would have. If a distribution is Gaussian, the sample points will follow a straight line, and the value of the standard deviation, σ, is the steepness of this line. We show the probability plots for our sample in Figure 7. The largest part of the sample relatively well resembles a well-constrained line, which means that except for a only a handful of outliers, the distribution of space velocities is consistent with a Gaussian distribution. We overplot a fit to the inner ±1.75σ of the velocity distribution in Figure 7. Velocity dispersions and ages derived from the inner part of this distribution are statistically indistinguishable from results taken from the full sample.

Figure 7. Probability plots in U, V, and W. The red line is a fit to the data within ±1.75σ of the expected distribution assuming the data were following a Gaussian distribution.
Download figure:
Standard image High-resolution image
From the |W|-corrected space velocity dispersions, we have calculated the age of our sample as described above. Our results are summarized in Table 3, the age estimate for our volume-limited sample of ultracool dwarfs from this methodology is τ = 3.1 Gyr. We compare this result to the sample presented in Reid et al. (2002b). These authors also show that their sample matches a Gaussian distribution quite well. We calculated |W|-corrected space velocity dispersions from the 32 M7–M9.5 dwarfs (compare with their Equation (3)) given in their Table 5, and from the Wielen relation we derive an age for the sample of τ = 3.1 Gyr. Given the substantial uncertainties of this age determination, which are on the order of several hundred Myr, this is in remarkable agreement with the age derived from our sample. Thus, there is good evidence that the mean age of the local ultracool dwarf population is about 3 Gyr.
Table 3. Velocity Dispersions σU, σV, and σW, Total Dispersion σtot, and Age Constraints from this Sample and from the M7–M9.5 Sample from Reid et al. (2002b)
| Source | σU (km s−1) | σV (km s−1) | σW (km s−1) | σtota (km s−1) | Age (Gyr) |
|---|---|---|---|---|---|
| This Work | 30.7 | 22.6 | 16.0 | 41.3 | 3.1 |
| Reid et al. (2002b) | 33.7 | 17.4 | 17.4 | 41.7 | 3.1 |
Notes. Velocity dispersions are |W|-corrected according to Wielen (1977). aσtot = (σ2U + σ2V + σ2W)1/2.
Download table as: ASCIITypeset image
5. SUMMARY
Ultracool dwarfs of spectral types M7–M9.5 are of particular interest to our understanding of the physics of low-mass stars and brown dwarfs. In order to investigate the physics of ultracool dwarfs, we constructed a volume-limited sample of 63 M7–M9.5 dwarfs from the DENIS and 2MASS samples. In this first paper, we present the sample composition, the fraction of young brown dwarfs from detections of Li, and the kinematic age of the local population of ultracool dwarfs.
We detected the Li line in six of our targets, i.e., about 10% of our targets are younger than about 0.5 Gyr. This result is consistent with earlier results on the brown dwarf fraction by Reid et al. (2002b). The mass function index α is perhaps a little higher than previously thought, but α < 2 is probably still valid.
From M7 to mid-L, the Li fraction rises because the cooler stars are less massive and retain their Li for a longer period. However, we find a local maximum of the Li fraction at spectral type M9. At this point, we cannot exclude that this maximum is caused by the full sample being partially biased toward younger objects that are brighter and hence easier to observe. A potential explanation for a real Li maximum could be a situation in which the spectral appearance of lithium brown dwarfs together with the mass-dependent detectability of the Li line and the star formation rate results in a maximum of stars with detectable Li lines at spectral type M9. The details of such a scenario are not clear, and a statistically more robust sample of late-M and early-L dwarfs should be investigated before drawing further conclusions. A necessary condition for this is the availability of trigonometric parallaxes.
We investigated the space velocities of ultracool dwarfs. UVW velocities are concentrated around the thin disk, and the lithium brown dwarfs kinematically cluster around the very center of the thin disk. Space velocities of our sample generally follow a Gaussian distribution so that we can derive a kinematic age for our sample. The kinematic age of M7–M9.5 dwarfs is 3.1 Gyr, which supports earlier results (see Reid et al. 2002b) that the velocity dispersion of late-M dwarfs is significantly lower than those measured for nearby M dwarfs, and that the dispersion is similar to the one in earlier type emission-line stars.
Based on observations collected at the European Southern Observatory, Paranal, Chile, PIDs 080.D-0140 and 081.D-0190, and observed from the W. M. Keck Observatory, which is operated as a scientific partnership among the California Institute of Technology, the University of California, and the National Aeronautics and Space Administration. We would like to acknowledge the great cultural significance of Mauna Kea for native Hawaiians and express our gratitude for permission to observe from atop this mountain. We thank Andreas Seifahrt and Denis Shulyak for helpful discussions on space velocities and Li abundances. A.R. has received research funding from the DFG as an Emmy Noether Fellow (RE 1664/4-1). G.B. thanks the NSF for grant support through AST06-06748.
Footnotes
- 4
- 5
Schmidt et al. (2007) use Equation (2) and present it in a slightly different form with t the age of the sample and τ a characteristic timescale, τ = 2108 yr. However, this actually should have been written as τ−1 ≈ 210−8 yr−1. It provides a fortunate compensation for the error in computing total velocity dispersions. Thus, the results of Schmidt et al. (2007), Zapatero-Osorio et al. (2007), and Faherty et al. (2009) end up fortuitously consistent with other work (and ours). To illustrate, Schmidt et al. (2007) find an age of 3.1 Gyr for σtot = 20.8 km s−1, but this small-velocity dispersion would in fact imply an age well below 1 Gyr.