


ABSTRACT
The Rosetta spacecraft is en route to comet 67P/Churyumov-Gerasimenko for a rendezvous, landing, and extensive orbital phase beginning in 2014. With a limited amount of available observational data, planning of the mission as well as the interpretation of measurements obtained by instruments on board the spacecraft requires modeling of the dusty/gas environment of the comet. During the mission, the collision regime in the inner coma will change starting from transitional to fully collisionless. As a result, a physically correct model has to be valid at conditions that are far from equilibrium and account for the kinetic nature of the processes occurring in the coma. A study of the multi-species coma of comet 67P/Churyumov-Gerasimenko is presented in our previous paper, where we describe our kinetic model and discuss the results of its application to cases that correspond to the different stages during the mission. In this work, we focus on numerical modeling of the dust phase in the coma of comet 67P/Churyumov-Gerasimenko and its interaction with the surrounding gas. The basic phenomena that govern the dynamics and energy balance of the dust grains are outlined. The effect of solar radiation pressure and the nucleus gravity in limiting the maximum liftable mass of the grains is discussed. The distribution of the terminal velocity of the dust grains as a function of subsolar angle is derived in the paper. We have found that in the regions with high gradients of the gas density, spike-like features can form in the dust flow. The obtained results represent the state of the coma in the vicinity of the nucleus for a series of stages throughout the Rosetta mission. The implications of the model results for future measurements by the GIADA instrument are discussed.
Export citation and abstract BibTeX RIS
1. INTRODUCTION
The main scientific objectives of the Rosetta mission are the global characterization of the nucleus, the determination of the surface composition, and the study of the development of comet activity. The original target of the mission was comet 46P/Wirtanen. But the cancellation of the original launch resulted in the change of the target to comet 67P/Churyumov-Gerasimenko, which is another short-period Jupiter family comet. The spacecraft will reach the comet at the beginning of 2014 October, when the comet will be at a heliocentric distance of 3.25 AU in the pre-perihelion portion of its orbit, and accompany the comet along its way to and through perihelion. In addition, the Rosetta mission includes the Philae probe that will land on the nucleus to perform a detailed investigation of its physical and compositional properties (Hechler 1997).
Comet 67P/Churyumov-Gerasimenko was discovered on 1969 October 22 (Churyumov & Gerasimenko 1970). Once it was chosen to be the new Rosetta target, a flurry of observational activity occurred as the comet receded from its last perihelion apparition in 2003 (Kidger 2004; Weiler et al. 2004; Lara et al. 2005; Schleicher 2006; Kelley et al. 2006, 2008; Ishiguro 2008; Ishiguro et al. 2009).
Focusing on the problem of the interaction between the gas and dust phases in the coma, we limit the domain of the study to a distance of about 102 km from the nucleus. This range of cometocentric distances determines a region that is the most relevant for studying the dust phase of the coma during the mission. Within this region, the chemical composition and dynamics of the coma are dominated by those of the gas directly sublimating from the cometary nucleus. The gas coma at cometocentric distances up to 106 km has been considered in our previous work, which is described by Tenishev et al. (2008).
Gravity of the nucleus and the drag force that is due to momentum exchange between the gas and dust phases in the coma are the most important forces present in the range of cometocentric distances that we consider in this work. The balance of these forces determines the trajectories and limits the maximum liftable size of dust grains. Being one of the dominant factors in the dynamics of the dust phase, momentum exchange between dust and gas phases generally has no effect on the gas flow in the inner coma of comet Churyumov-Gerasimenko because of its low overall production rate (Gombosi et al. 1985; Crifo et al. 2005; Markelov et al. 2006; Moreno et al. 2004).
The current work continues the efforts on developing a numerical model that is applicable to the dusty/gas coma of comet Churyumov-Gerasimenko. For this purpose, we used the same boundary conditions and the same nucleus model as described in our previous paper by Tenishev et al. (2008). The primary goal of this paper is the study of the innermost coma and therefore we limit the gas phase to water only. The next most abundant component, CO, does not change the general picture of the coma but adjusts the properties of the coma according to its abundance. For this reason, the presence of CO was taken out of consideration.
In this work, we study the coma of comet Churyumov-Gerasimenko at heliocentric distances of rh = 1.29 AU, 2.0 AU, 2.7 AU, and 3.25 AU that correspond to several stages of the Rosetta mission. This is a part of a larger effort, performed in connection with a number of instrument and science working teams of the Rosetta mission.
2. MODELING OF THE COMA OF COMET CHURYUMOV-GERASIMENKO
As a comet approaches the Sun, water vapor with some fraction of other gases sublimates, generating a cloud of gas, ice, and other refractory materials (rocky and organic dust) ejected from the surface of its nucleus. Having little or no gravity, comets produce a large and highly variable extensive dusty coma with a size that is much larger than the characteristic size of the comet's nucleus.
The gas injected into a coma can be thermalized through collisions in the vicinity of the cometary nucleus (Crifo 1989; Combi 1996). Beginning at a few hundred kilometers from the nucleus, its dynamics is dominated by the formation of energetic daughter species (Combi & Smyth 1988; Xie & Mumma 1996; Festou 1999; Gunnarsson et al. 2002; Tenishev et al. 2008) produced in photodissociation reactions. Among other important processes occurring in a coma are photoionization (Feldman et al. 1998; Combi et al. 2004; Singh et al. 1991) and radiational cooling (Bockelée-Morvan & Crovisier 1987; Xie & Mumma 1996; Marconi & Mendis 1982).
In most cases of practical interest, and especially for comet Churyumov-Gerasimenko during most of the Rosetta mission, study of cometary comae involves rarefied gas flows under strong non-equilibrium conditions. As a result, the dynamics of the coma should be described by the Boltzmann equation
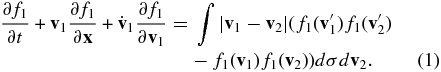
Here, f1 is a one-particle distribution function and σ is the total collision cross section. The integral in Equation (1) represents collisions, by which collision partners having velocities  and
and  get the velocities
  and
and  after the collision. Equation (1) can be generalized for gas mixtures and the influence of external forces can also be taken into account.
The numerical solution of kinetic equations is a challenging problem in modern computational physics. The main difficulty is the dramatic variation of the involved characteristic temporal and spatial scales. The lowest limit of the spatial scales is determined by the local value of the mean free path at the subsolar point of the nucleus. In the case of comet Churyumov-Gerasimenko, it varies from approximately 0.5 m at a heliocentric distance of rh = 1.29 AU to about 400 m at a heliocentric distance of rh = 3.25 AU. Assuming a characteristic value for the speed of gas molecules in the vicinity of the surface of the nucleus of about 700 m s−1, the lowest limit of the timescale varies starting from 10−3 s at a heliocentric distance of 1.29 AU up to about 1 s at a heliocentric distance of 3.25 AU. In the outer coma, the characteristic timescale is determined by rates of photolytic reactions and can be estimated to be of the order of 105–106 s at a heliocentric distance of 1 AU.
Among a variety of numerical methods (Aristov 2001) for the solution of the Boltzmann equation (Equation (1)), the Direct Simulation Monte Carlo (DSMC) method (Bird 1994) is the most popular approach for numerical simulation of multi-dimensional rarefied gas flows under strongly non-equilibrium conditions. Within this approach the state of a rarefied gas flow is determined by the collisional dynamics of a finite number of model particles. Hence, it holds the potential for providing information about gas flows, where the collision rate is not sufficient to maintain equilibrium distribution. The key feature of the method is the separation of the translational motion from the intermolecular interaction. After a free-molecular motion particles change their spatial location. At the relaxation stage, the velocity coordinates of a pair of particles from the same cell can be changed due to a chosen probabilistic relaxation model. The conservation laws are satisfied because the post-collision velocities are determined with the use of conservation of mass, momentum, and energy in every intermolecular interaction.
Examples of application of the DSMC method for simulating a neutral gas coma are described by Combi (1996), Markelov et al. (2006), Skorov et al. (2004), Zakharov et al. (2009), and Crifo et al. (2005). A detailed description of our DSMC model of a cometary coma and its application to the Rosetta target comet Churyumov-Gerasimenko is discussed by Tenishev et al. (2008).
Even though in general a cometary coma has to be treated as a rarefied gas, in the relatively close vicinity of bright comets a hydrodynamic approach is still applicable. The gas number density, n, at the nucleus surface can be evaluated by considering the equilibrium vaporization of water from (probably just below) its surface. A typical number density near the surface of an active comet at a heliocentric distance of 1 AU is n ≈ 1019 m−3 and with the water collisional cross section of σ ≈ 10−19 m−2 the value of the mean free path in the coma is 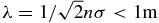 , which allows one to apply a hydrodynamic model in the vicinity of the nucleus.
Strictly speaking though, a hydrodynamic description is possible only in the collision-dominated region. A traditional definition of the collision zone (Whipple & Huebner 1976; Combi & Smyth 1988) is a sphere with radius Rcoll, where the local value of the mean free path is equal to the distance to the center of the nucleus
This definition is highly oversimplified but gives some measure of the characteristic size of the area where a hydrodynamic approach remains somewhat valid. The typical size of the collision sphere is ∼104 m for bright comets with a simple spherically symmetric constant expansion gas production rate of the order of ∼1029 s−1 at a heliocentric distance of 1 AU.
Even when the inner coma has a large fluid region, a Knudsen layer, where the gas released from the nucleus becomes thermalized, unavoidably separates the latter from the nucleus. Thus, in order to apply a hydrodynamic approach to a cometary coma, it is necessary to formulate boundary conditions not on the surface of the nucleus but on top of the Knudsen layer (Crifo 1995, 1987; Rickman 1989). Kinetic models do not have such limitations as no equilibrium in the gas is assumed in the vicinity of the nucleus. The boundary conditions used in our simulation have been obtained from the thermophysical model (Davidsson & Gutiérrez 2004, 2005, 2006) that accounts for the processes occurring within the porous nucleus (such as sublimation and recondensation) as well as within the surface Knudsen layer and thus provides the right surface conditions for our coma DSMC calculation.

Figure 1. Surface temperature (a) and water flux (b) distributions over the nucleus surface at heliocentric distances of rh = 1.29 AU, 2.0 AU, 2.7 AU, and 3.25 AU obtained with the thermophysical model (Davidsson & Gutiérrez 2004, 2005) and used to formulate the boundary conditions for the gas flow on the surface of the nucleus.
Download figure:
Standard image High-resolution imageOutside of the collision zone, a kinetic approach has to be used to simulate a coma. In this regard, it may be useful to combine both kinetic and hydrodynamic approaches in the area of their validity to achieve the maximum performance of a numerical model. Some recent developments in coupling of DSMC and computational fluid dynamics approaches are presented by Abbate et al. (2009), Burt & Boyd (2009a, 2009b), Holman & Boyd (2009), Roveda et al. (1998), Zakharov et al. (2008), and Schwartzentruber et al. (2008, 2006). Associated with the coupling, the breakdown parameter is described by Ozawa et al. (2010).
2.1. Gas Production of the Nucleus
A porous layer of ice and solid grains that covers the surface of a cometary nucleus is subjected to a periodic solar illumination that causes the sublimation of volatiles into the coma. A theoretical description of the outgassing from a nucleus requires accounting for a large number of processes accompanying the sublimation itself and, eventually, determining the production rate of the nucleus. Among these processes are the gradual absorption of the solar energy in the surface layer due to the finite optical opacity of the ice/dust mixture, the thermal reradiation, the recondensation of the gaseous constituents of the coma on the surface of the nucleus, the solid-state heat conduction, the sub-surface ice sublimation and recondensation, and the sub-surface transport of mass and energy due to gas diffusion.
These processes have formed the background for thermophysical models of the nucleus gas production that can be used to define the boundary conditions on the surface of the nucleus. The description of such models is given by Prialnik et al. (2004), Davidsson & Gutiérrez (2004, 2005, 2006), Davidsson et al. (2010), de Sanctis et al. (2010), and Rosenberg & Prialnik (2010).
Applied to comet Churyumov-Gerasimenko at the considered portion of its orbit, the thermophysical model (Davidsson & Gutiérrez 2004, 2005, 2006) produces an outgassing pattern across the surface of its nucleus. In order to match the observed total production rate (Hanner et al. 1985), the modeled gas flux has been scaled down. The actual temperature and water flux distributions on the surface of the nucleus used in this work to formulate boundary conditions for the gas flow are presented in Figure 1 and Table 1. A more detailed formulation of the boundary conditions used in this work is presented in Tenishev et al. (2008).
Table 1. Model Cases for Comet 67P/Churyumov-Gerasimenko
| rh (AU) | Q (s−1) | Ts (Night) | Nightside Flux | Rosetta Phase |
|---|---|---|---|---|
| 1.29 | 5 × 1027 | 172 K | 5.8% | Perihelion |
| 2.0 | 8 × 1026 | 165 K | 7.0% | |
| 2.7 | 8 × 1025 | 150 K | 9.2% | |
| 3.25 | 1 × 1024 | 139 K | 11.6% | All instruments on |
Note. A detailed description of the simulation results of the gas in the coma for these cases is given by Tenishev et al. (2008).
Download table as: ASCIITypeset image
3. DUST IN A COMETARY COMA
One of the most important problems in simulating the dust phase of a coma is the lack of quantitative knowledge of the properties of the dusty grains themselves (such as optical properties, the density, and size distribution), properties of the nucleus (such as mass, its surface topology, and distribution of sources), and the production rate and the boundary conditions for the gas phase of a coma.
Ground-based observations of dust in a coma can be done only by observing scattered light and are limited by dust sizes that have the maximum scattering efficiency. Some of the obtained results are presented by Harris et al. (1997), Sarmecanic et al. (1997), Harmon et al. (1997), Jewitt & Matthews (1997), and Moreno (2009). Calculations of optical properties of dusty grains based on optical observations are described by Kolokolova et al. (2004), Lasue et al. (2009), and Shen et al. (2009). Recent results of observations of dust in the coma of comet Churyumov-Gerasimenko are outlined by Agarwal et al. (2009) and Agarwal et al. (2010).
A significant improvement (Hanner & Bradley 2004) in understanding properties of cometary dust has been achieved with the Giotto (McDonnell et al. 1993, 1987), Vega (Kissel et al. 1986; Simpson et al. 1986), Deep Space 1 (Ho et al. 2003), Stardust (Brownlee et al. 2006; Landgraf et al. 1999), and Deep Impact (Jorda et al. 2007) missions to different comets, where it was found that dust particles are made from carbonaceous and silicate materials (Agarwal et al. 2007) and range from nanometers to millimeters in size. There is a long list of publications that discuss physical properties of sublimating dust particles based on those observations. For example, some properties of such particles are discussed by Delsemme & Miller (1971a), Lichtenegger & Komle (1991), Patashnick & Rupprecht (1975, 1977), and Hanner (1981).
It is possible that dust grains are porous aggregates (Kolokolova & Kimura 2010) and therefore have a density that depends on the size and varies in the range of 0.3–3 g cm−3 (Brownlee 1978; Biver et al. 1997; Harmon et al. 1997). The density of dust grains is suggested (Divine et al. 1986; Agarwal et al. 2007) to be in the form ρ = ρ0 − σ0a/(a + a0), where ρ0 = 3 g cm−3, σ0 = 2.2 g cm−3, and a0 = 2 μm. Such grains might carry volatiles (Delsemme & Miller 1971b; Cottin & Fray 2008). Being heated by the Sun, they may add to the total gas production of a comet by forming a distributed source (Cottin & Fray 2008).
Based on observations of the spectral energy distribution (SED), Sekanina & Farrell (1982) have derived a grain size distribution in the form n(a) = g0(1 − a0/a)M(a0/a)N, which has been shown to give a good fit to SED of a number of comets (Hanner et al. 1985; Hanner & Campins 1986; Sekanina et al. 2001; Divine et al. 1986). Here, g0 is a normalization factor, a0 = 0.1 μm is the minimum grain radius, N (N ≈ 3.7–4.2) defines the slope of the distribution at large grain radii, and M (M = 28) determines the grain radius aP = a0(M + N)/N where the distribution has its maximum. A more simple expression for the distribution of grain size has been proposed (Hanner 1982; Divine et al. 1986; Grün et al. 1989) in the form

where s is a power index. It was found that for comet 67P/Churyumov-Gerasimenko the power index of the dust size distribution varies from −4.1 up to −3.5 (Agarwal et al. 2010; Fulle et al. 2010; Ishiguro 2008; Kelley et al. 2008, 2009). In this work, we have used a power index of s = −4. Because of the small back heating and drag on the gas by the dust for the low production rate of 67P/Churyumov-Gerasimenko, the results of the simulations presented here can easily be scaled to other particle size and bulk density distribution functions.
Processes occurring in the dust phase of a coma are described by Divine et al. (1986), Bonev (2008), and Levasseur-Regourd et al. (2007, 2008). The most important among these processes are the momentum exchange with the surrounding gas, charging by plasma, and absorption of solar UV radiation. It is generally recognized that because of the UV-radiation-induced photoemission and interaction with the plasma environment, dust particles in cometary tails are electrostatically charged (Borisov & Mall 2006; Goertz 1989; Popel & Gisko 2006; Horányi 1996; Horanyi & Mendis 1985). The electrostatic fragmentation and interaction with the interplanetary magnetic field are the two primary consequences of the dust grain charging. Boehnhardt (1986) and Boehnhardt & Fechtig (1987) conclude that only fluffy dust particles (particles where a small inclusion of ice is filled into a porous mineral component, which can be considered as a matrix) with a radius in the range of 0.1–1 μm can be broken electrostatically.
The energy balance (Lien 1990) of dusty grains comes from summing a number of sources. Mainly, grains can gain and lose energy (Delsemme & Miller 1971a; Herman & Podolak 1985; Dziak-Jankowska et al. 2002) from absorbing and emitting radiation, and sublimation and recondensation of the ambient gas. As the sublimation and thermal radiation processes proceed slowly enough (Hanner 1981; Mekler & Podolak 1994) in comparison to the heat transport within a grain, the energy balance of a grain can be obtained by solving a steady-state energy conservation equation (Patashnick & Rupprecht 1975, 1977; Mekler & Podolak 1994; Lamy 1974; Beer et al. 2006; Sarmecanic et al. 1997) in the form Es + Ec + Ea + Er = 0, where Es and Ec are the power that is released by sublimation and absorbed by recondensation, respectively. Ea and Er are the power that a grain absorbs and emits with radiation, respectively. An example of the resulting dependence of grain temperature on its size is given in Figure 8 presented in the paper by Lien (1990).
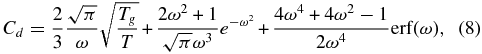
The rates of energy absorption and radiation by a spherical particle (Patashnick & Rupprecht 1975; Mekler & Podolak 1994) are
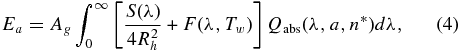
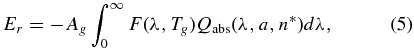
where S(λ) is the solar energy spectrum (Labs & Neckel 1970) and F(λ, Tw) is the blackbody radiation spectrum at background temperature (Patashnick & Rupprecht 1975) Tw = 4 K. The absorption efficiency, Qabs, is a function of the wavelength λ, radius of the grain a, and the complex index of refraction n* (Irvine & Pollack 1968; Bertie et al. 1969). Its numerical value can be calculated (Patashnick & Rupprecht 1975; van de Hulst 1957; Wiscombe 1980; Kimura et al. 2009) using the Mie theory.
The variation of a dust grain's energy due to sublimation and recondensation (Patashnick & Rupprecht 1975; Mekler & Podolak 1994) can be evaluated as Es = −LAgZ and 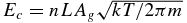 , respectively. Here, L = 2.78 × 10⁶ J kg−1 is the latent heat of sublimation, Ag is the surface area of a grain, Z is the sublimation rate, and n is the number density of water molecules in the vicinity of the grain. The sublimation rate, Z, can be approximated (Delsemme & Miller 1971a; Lien 1990; Gombosi et al. 1986) by
 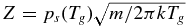 , where ps(Tg) is the saturation vapor pressure (Gombosi et al. 1986; Lichtenegger & Komle 1991) obtained from the Clausius–Clapeyron equation
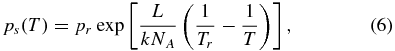
where pr = 105 N m−2 is the pressure of water vapor at the reference temperature Tr = 373 K. Approximate expressions for the pressure of saturated vapor over ice are given by Lichtenegger & Komle (1991), Fanale & Salvail (1984), and Beer et al. (2006). Icy grain sublimation is discussed by Delsemme & Miller (1971a), Hanner (1981), and Lien (1990). Sublimation of porous spherical grains was considered by Gunnarsson (2003) and Fray et al. (2006).
4. DYNAMICS OF A DUSTY GRAIN IN A COMA
Having an insufficient amount of information regarding the physical properties of dust grains in a cometary coma, a wide area is opened for the development of grain models. Usually, dust grains are assumed (Benson et al. 2000; Burt & Boyd 2003) to be spherical. Neglecting collisions between them as well as the influence of solar radiation pressure, Lorentz force, and solar gravity, one can obtain (Gombosi et al. 1986; Skorov & Rickman 1999; Molina et al. 2008) the following equation of motion for an individual grain:
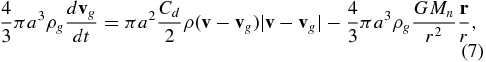
where G is the gravitational constant, Mn is the mass of the comet's nucleus,  is the position of a dust grain with respect to the nucleus, Cd is a drag coefficient,
  is the bulk velocity of the gas in the coma,
  is the velocity of a spherical dust grain with radius a, and ρ and ρg are the mass density of the surrounding gas and dust grains, respectively. This equation was used in this study because the dust grain's motion is considered only within close proximity of the nucleus where it is dominated by the interaction with the gas phase of the coma and the gravity of the nucleus. Assuming full accommodation on the surface of a grain, the drag coefficient in a free molecular approximation (Probstein 1969; Gombosi 1987; Gombosi et al. 1986; Kitamura 1986; Marconi & Mendis 1982; Crifo et al. 2005) is
where 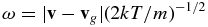 . Here, m is the mass of a gas molecule and Tg and T are the temperatures of the dust grain and the surrounding coma, respectively. This approximation of the drag coefficient is valid when the surrounding gas is in equilibrium. For typical conditions in a coma, the drag coefficient can be approximated by a constant Cd = 2 (Gombosi et al. 1986; Grün et al. 1989), which was also done in this work. Other approximations of the drag coefficient, Cd, are presented by Rodionov et al. (2002), Baines et al. (1965), Nakamura et al. (1994), and Davidsson et al. (2010).
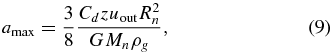
The maximum mass of dust grains that can be lifted from the surface of the nucleus is determined by the balance of all applied forces. For simulations presented in this paper, it was assumed that the radiation pressure can be neglected within 200 km from the nucleus. In some cases, however, it is important to account for the force caused by the solar radiation pressure: on the dayside of the nucleus the combination of this force and the gravity of the nucleus balances the drag force by the gas (Crifo et al. 2005). The importance of radiation pressure for determining the maximum size of liftable dust grains at a particular heliocentric distance depends on its magnitude relative to that of the nucleus' gravity and the drag by the gas, and is described in the discussion section of this paper.
The role of gravity in limiting the size of grains that can be lifted from the surface of a nucleus was discussed by Huebner (1970), Delsemme & Miller (1971a, 1971b), and Crifo et al. (2005). Neglecting the solar radiation pressure and assuming that a dust grain starts with zero velocity (Gombosi et al. 1986) at the surface of the nucleus, the maximum size of a dust grain, amax, can be obtained from Equation (7) in the form
where uout is the gas outflow velocity and z is the local mass production rate of a nucleus with radius Rn. Even when lifted, larger grains will fall back, most probably outside of the active region triggering new emission activity.
At a distance of about 10 nuclear radii, dust is completely decoupled from the gas phase of the coma. The terminal speed of the dust grains cannot exceed the velocity of the gas in the coma and can vary by a few orders of magnitude over the whole range of dust grain sizes.
In the far regions of the coma, the trajectory of a dust grain is determined by the combination of solar radiation pressure and solar gravity, and can be described by the coefficient β = (3 L☉)/(16πcGM☉)Qpr/(ρga) (Agarwal et al. 2007; Kelley et al. 2008), where L☉ and M☉ are the luminosity and mass of the Sun, respectively, c is the speed of light, G is the gravitational constant, and Qpr (Ishiguro 2008; Burns et al. 1979; Köhler et al. 2007) is a material-dependent radiation pressure efficiency. In addition to that, the Lorentz force can be an important factor in determining the trajectory of an electrically charged grain. Since we simulate the flow of electrically neutral dust grains within cometocentric distances important for the Rosetta mission (within 200 km), we neglect the influence of those forces on the motion of dusty grains. An example of the study of dust motion outside of the acceleration region is presented by Bonev (2008). Theoretical aspects of a large-scale simulation of dust flow across the solar system that involves the effect of charging of the grains are considered by Landgraf et al. (1999).
4.1. Numerical Simulation of a Dust Phase of a Cometary Coma
A number of approaches have been used lately for numerical simulation of dust in the coma. All of them can be split into two major classes by their representation of the dust phase. A number of dusty gas hydrodynamic models have been considered by Kitamura (1986), Körösmezey & Gombosi (1990), Divine et al. (1986), Combi et al. (1997), and Gombosi et al. (1986). Application of the test particle technique to the problem of dust expansion into a coma has been studied by Skorov & Rickman (1999) and Zakharov et al. (2009). Davidsson et al. (2010) have used a Monte Carlo model to simulate the distribution of the gas and dust in the inner coma of comet Churyumov-Gerasimenko. Application of a Monte Carlo model for simulation of the cometary tail formation is presented by Kharchuk et al. (2009) and Moreno (2009).
Used in this work, the numerical model of the dusty coma is developed within the frame of Monte Carlo methods (Sobol 1975). This means that the dust phase in the coma is represented by a large but finite number of model particles that simulate real dust grains in the coma. Macroscopic parameters of the dust flow (such as density and bulk velocity) are obtained by averaging of the appropriate microscopic parameters of the model particles. In order to relate the number density of model particles and that of real dust, an additional parameter, which is called statistical weight, is introduced. The statistical weight is defined as the ratio between the number of real dust grains and that of model particles in the same volume and can be considered as the number of real dust grains that are represented by a single model particle. Each model particle has all the properties of a real dust grain such as radius, mass, and velocity, and is acted upon by the gravity of the cometary nucleus and the gas drag force.
According to Kidger (2003), Ishiguro (2008), Osip et al. (1992), Hanner et al. (1985), and Moreno et al. (2004), the ratio of the dust-to-gas mass production rate obtained from observations varies in the range of 0.21–1.5. In this work, we have assumed the value of the ratio to be 0.8, which is the average.
It is not until the gas and dust production rates are about a factor of 20 or more larger than our perihelion case that nonlinear effects come into play, as in the case of 1P/Halley at a heliocentric distance of 0.9 AU. For gas production rates of a few times 1029 s−1, photochemical heating becomes significant and so differences in gas production rate on the order of 50% or more can cause nonlinear effects in the temperature as well as the gas expansion velocity (Bockelée-Morvan & Crovisier 1987; Combi 1989, 1996; Rubin et al. 2011). Similarly, proportionally larger dust production rates can cause more significant feedback effects of initially slowing and subsequently heating of the gas flow in the very inner coma (Crifo et al. 2002). However, for the range of gas and dust production rates of comet Churyumov-Gerasimenko used in this work the gas production rates, dust/gas mass production ratios, and dust particle size distributions can be scaled linearly to other values with only minimal nonlinear impact.
In a numerical simulation a set of computational cells covers the area of interest. Macroscopic parameters of the dusty-gas coma are averaged over the volume of a cell, Ω, and the time step of the simulation, Δt. Being injected into the coma, a dust grain trajectory is integrated until it intersects the surface of the nucleus or leaves the computational domain.
The key element of the model is the calculation of the scattering frequency. Obtained from a usual definition in kinetic theory, the scattering frequency is ν = ngn〈crσ〉. Here, ng and n are the number densities of the dust and gas phases, respectively, and cr is the relative speed. The collision cross section, σ, can be approximated by πa2, which is the projected surface area of a spherical grain with radius a.
Absorbing solar radiation, the temperature of dust grains can increase and exceed that of the surrounding gas. As a result, scattering of gas molecules on the grains can cause an increase in gas temperature in the inner coma of an active comet, where such scattering is most probable. Neglecting possible adsorption/desorption and chemical reactions on the surface of a dust grain and assuming uniform scattering of a gas molecule in a solid angle of 4π with a velocity determined by the equilibrium distribution at the grain's temperature, the probability density of a gas molecule velocity distribution after a scattering event occurred is proportional to  , where
  , and
, and  and
and  are the velocities of a dust grain and a gas molecule after the event, respectively. This gives the final expression for the velocity components of a scattered gas molecule in the form
where v'i and vg, i are the components of the vectors  and
and  , respectively, and γ1, 2 are random numbers uniformly distributed in the interval (0, 1). Our study shows that the heating of the gas in coma of comet 67P/Churyumov-Gerasimenko by collisions with the dust is negligible.
Acceleration of dust grains can be calculated directly from Equation (10) accompanied by the momentum conservation law. But it is more practical to simulate a dust grain's trajectory using the macroscopic drag force defined in Equation (7), which serves to reduce the statistical noise in the drag force that is caused by the nature of the Monte Carlo method.
5. RESULTS AND DISCUSSION
At least for the production rate of a typical Jupiter family comet modeling of the coma can be naturally split into two parts: simulation of the neutral gas and simulation of dust in the coma. A detailed description of the model used for simulation of the gas in the coma of comet 67P/Churyumov-Gerasimenko and results thereof are given in the paper by Tenishev et al. (2008). Our previous study is extended here by incorporating dust into the model. This paper describes the results of the numerical simulation of the dust in the coma of comet 67P/Churyumov-Gerasimenko at heliocentric distances of rh = 1.29 AU, 2.0 AU, 2.7 AU, and 3.25 AU.
Recently, Davidsson et al. (2010) have presented results of their numerical study of the dusty gas coma of comet 67P/Churyumov-Gerasimenko. The numerical approach used in their work is similar to that described in this paper. The principal difference in the physical content of the dust models is the calculation of the drag coefficient, Cd, used in the equation of motion (Equation (7)) of the grains. The direct comparison of the results obtained with both models is complicated because of the different boundary conditions, assumptions of the geometrical symmetry of the coma, and the properties of the nucleus itself that have been used in the studies. The coma at perihelion has been considered with both models, which make possible meaningful comparison of the simulation results. Despite the different assumptions, both models provide similar terminal velocities of the dust grains. The size of the largest liftable grains that has been reported by Davidsson et al. (2010) exceeds that obtained with our model at the subsolar point by a factor of ∼3, which can be explained by the larger drag coefficient and higher values of the surface gas production rate and temperature assumed in their model.
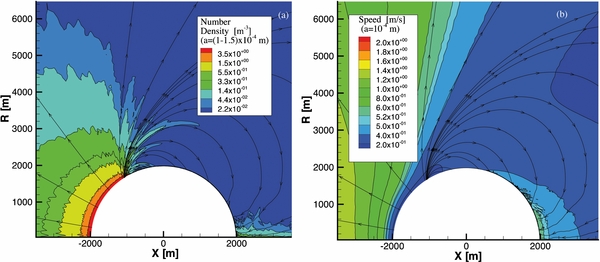
In accordance with Equation (7), the motion of a dust grain is determined by the combination of the nucleus' gravity and the drag by the gas. For this reason, it is important to have a physically correct model of the gas in the coma. In the range of cometocentric distances considered in this paper, the state of the gas depends primarily on the distribution of the gas sources on the surface of the nucleus. The boundary conditions used in this work are presented in Figure 1 and the resulting number density of water in the coma at cometocentric distances up to 30 km is given in Figure 2 when the comet is at a heliocentric distance of 1.29 AU.

Figure 2. Number density of water in the immediate vicinity of the nucleus (a) and at a cometocentric distance of up to ∼30 km (b). The presented distribution is obtained for the heliocentric distance of 1.29 AU. A detailed description of the state of the gas phase in the coma for the other heliocentric distances considered is given by Tenishev et al. (2008). Here and hereafter, the X-axis is in the anti-solar direction with the origin at the center of the nucleus. The R-axis gives the distance of a point from the axis of symmetry.
Download figure:
Standard image High-resolution imageThe balance of the drag and gravity forces defines the maximum mass of a grain that can be lifted from the surface of the nucleus. As follows from the flux and temperature distributions of injected gas (Figure 1), the maximum liftable mass of a dust grain should depend not only on the heliocentric distance but also on the local value of the subsolar angle. The number density and velocity distributions of the gas have been extracted from our numerical simulations at different heliocentric distances and used to calculate the maximum liftable mass, which is presented in Figure 3. For a given heliocentric distance, the maximum liftable mass can vary by about four orders of magnitude with a change of the subsolar angle.

Figure 3. Maximum liftable mass (left axis) and corresponding radius (right axis) of dust grains as a function of a subsolar angle for heliocentric distances of rh = 1.29 AU, 2.0 AU, 2.7 AU, and 3.25 AU.
Download figure:
Standard image High-resolution imageEven though the local water production rate changes only by a factor of 2 × 10³ over the considered range of heliocentric distances, the variation of the maximum liftable mass spans ∼10 orders of magnitude for the same subsolar angle. The drag force at the surface of the nucleus is proportional to zoutT1/2, where zout is the local production rate and T is the local temperature of the injected gas. The variation of the gas temperature, T, with heliocentric distance (Figure 1) does not make an important contribution to the corresponding change of the drag force. The maximum liftable mass can be evaluated from the equation of a grain's motion (Equation (7)) by matching the drag force with that of the nucleus' gravity. Assuming a constant dust grain's density, it follows that amaxzout ≈ const, where amax is the radius of the largest liftable dust grains. As a result, the maximum liftable size, amax, varies by a factor of 2 × 10³ and the maximum liftable mass of dust grains spans almost 10 orders of magnitude within the range of considered heliocentric distances at the same subsolar angle, which is consistent with the results presented in Figure 3.
5.1. Limiting the Maximum Size of the Largest Liftable Dust Grains by the Solar Radiation Pressure
Solar radiation pressure is an additional factor that limits the maximum size of dust grains liftable from the surface of the nucleus. But its relative importance strongly depends on the heliocentric distance as well as the size of dust grains.
The correction of the size of the largest dust grains, amax, lifted from the surface of the nucleus can be evaluated by solving the equation of motion (Equation (7)) that includes the effect of solar radiation pressure. Balancing the drag by the gas, the gravity of the nucleus and the radiation pressure force results in the following expression for amax:
where v is the bulk speed of the expanding gas, Rn is the radius of the nucleus, rh is a heliocentric distance, G is the gravitational constant, Mn is the mass of the nucleus, M☉ is the mass of the Sun, θ is the subsolar angle, and ρg and ρ are the densities of the dust grains and gas, respectively. The solar radiation pressure coefficient, β, is defined as the ratio between the solar radiation pressure force and the gravity of the Sun. Solar radiation pressure adds to the gravity of the cometary nucleus and causes a decrease of the maximum liftable mass on its dayside.
In the range of grain radii of 3 × 10⁻⁷ m < a < 3 × 10⁻⁵ m, the radiation pressure coefficient can be approximated as β = 2.5 × 10⁻⁷/a (Wilck & Mann 1996). Using this approximation, we have calculated the distribution of the maximum size of the largest liftable dust grains. The result of this calculation is presented in Figure 4 for a heliocentric distance of 3.25 AU. This approximation of the radiation pressure coefficient is valid in the range of the subsolar angles starting from 0 and up to ∼50°. At these subsolar angles, the correction caused by accounting for radiation pressure varies in the range of 0.2 < (amax, 0 − amax, s)/amax, 0 < 0.5, where amax, 0 and amax, s are the maximum sizes of liftable dust grains calculated with and without accounting the radiation pressure, respectively.

Figure 4. Comparison of the largest liftable dust grain size when radiation pressure is neglected and when it is accounted for at a heliocentric distance of rh = 3.25 AU. Here, amax, 0 and amax, s are the maximum sizes of liftable dust grains calculated with and without accounting for radiation pressure, respectively.
Download figure:
Standard image High-resolution image
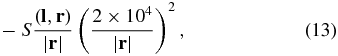
Figure 5. Number density of dust in the immediate vicinity of the nucleus (a) and at a cometocentric distance of up to ∼80 km (b) for the heliocentric distance of 1.29 AU.
Download figure:
Standard image High-resolution imageFor grains with radii, a, between 1 × 10⁻⁷ m and 3 × 10⁻⁷ m, the coefficient β can be approximated by a constant β = 0.7. And it decreases for dust grains of smaller sizes (Oberc 1997; Wilck & Mann 1996; Mukai et al. 1989; Mignard 1982). This means that for grains smaller than 3 × 10⁻⁷ m, the relative importance of radiation pressure reduces and the correction of the maximum liftable size is less than 50% of that calculated by balancing the gravity of the nucleus and the gas drag at the heliocentric distance of 3.25 AU. Because of the size distribution of the injected dust grains, the macroscopic parameters of the dust phase in the coma are dominated by grains with small radius. As a result, the correction mentioned above has no significant influence on the general structure of the dust flow in the coma.
A similar analysis has been performed for all three of the other smaller heliocentric distance and shows that the solar radiation pressure has a negligible effect on the distribution of maximum sizes of liftable grains and can be neglected there.
The rotation of the nucleus results in an additional centrifugal force that acts upon dust grains (Crifo et al. 2005; Rodionov et al. 2002; Oberc 1997). Opposite to solar radiation pressure, the centrifugal force increases the maximum liftable mass. The relative importance of the force for calculation of the maximum liftable mass can be evaluated by considering the balance of all forces in Equation (7). With the rotation period of the nucleus being about ΔT = 12.4–12.7 hr (Lamy et al. 2006, 2007), the resulting maximum value of the centrifugal acceleration is 3.9 × 10⁻⁵ m s−2. The effect of solar radiation pressure is noticeable only at a heliocentric distance of 3.25 AU, where the corresponding acceleration is about 3.4 × 10⁻⁵ m s−2 for dust grains with radius of 4 μm (the maximum liftable size at the subsolar point). For comparison, the acceleration due to the gravity of the nucleus is about 1.7 × 10⁻⁴ m s−2. As a result, both solar radiation pressure and the centrifugal force can cause a small change in the mass and size distribution of the largest liftable dust grains at large heliocentric distances. The relative importance of these forces depends on the local direction of the nucleus surface normal and the direction of the actual axis of rotation.
Another effect that could be important in determining the maximum liftable mass is related to charging of both the grains and the nucleus (Mendis et al. 1981; Wallis & Hassan 1983; Horanyi & Mendis 1985; Boehnhardt 1986; Mendis & Rosenberg 1994; Chen et al. 2004; Tenishev et al. 2010). We plan to address the problem of charged dust grains in cometary comae in the follow-up paper.
5.2. Distribution of Dust in the Inner Coma: Formation of the Density Spike
In the presence of a sharp variation of the water production rate (Figure 1), the gas in the coma expands into the region with the lower density and forms a tangential gas flow. The streamlines of such flow are presented in the left panel of Figure 2. The moving gas adds a tangential component to the streamlines of the dust bulk flow (left panel of Figure 5) and sweeps dust grains toward the nightside of the nucleus.
In the innermost vicinity of the nucleus this effect is not noticeable and the distribution of dust follows those of the parent gases. But at an altitude of a few hundred meters above the terminator, a density "spike" is formed caused by the deflection of the dust grains' bulk motion toward the nightside of the nucleus.
It is important to remember that the dust density distribution presented in Figure 5 is obtained with the assumption of cylindrical symmetry of the gas and dust productions and, as a result, the "spike" is a three-dimensional feature of the dust density enhancement symmetrical with respect to the comet-to-Sun axis. The dust column densities calculated with the simulated dust distribution would maintain appearance of the spikes if viewed perpendicular to the comet–Sun line but totally wash it out if viewed parallel to the comet–Sun line.
A similar spike in the dust density also has been obtained by Kitamura (1986) with a hydrodynamic model of a dusty coma. This phenomenon is illustrated in the left panel of Figure 5 that shows the number density of the dust in the immediate vicinity of the nucleus at a heliocentric distance of 1.29 AU. The fully developed spikes in the dust density are presented in the right panel of Figure 5 and in Figure 6 for the heliocentric distances of 1.29 AU, 2.7 AU, and 3.25 AU.

Figure 6. Number density of dust in the coma at heliocentric distances of 2.7 AU (a) and 3.3 AU (b). The black vertical line denotes the terminator.
Download figure:
Standard image High-resolution imageThe direction of the spike changes with heliocentric distance. At small heliocentric distances, the intermolecular collisions in the innermost coma on the dayside of the nucleus increase the tangential component of the drag force and cause a higher inclination of the spike relative to the direction to the Sun. At a heliocentric distance of 3.25 AU (Figure 6), where the inner coma is mostly in a collisionless regime, the direction of the spike is close to the direction to the terminator.
It is important to note that the parent species of the coma (Figure 2) do not have any signatures of spike-like features in their density profiles. The spike-like features in the dust density can be an indicator of the presence of regions with a sharp change of the local water production rate (such as edges of gas jets).
5.3. The Distribution of the Dust Macroscopic Parameters in the Inner Coma
The density and bulk velocity are the most important macroscopic parameters of the dust phase in the coma. The modeled bulk velocity distributions of the dust along the subsolar angles of 5°, 45°, 90°, 135°, and 175° are presented in Figure 7 for the heliocentric distances of 1.29 AU, 2.0 AU, 2.7 AU, and 3.25 AU. The same for the dust density are given in Figure 8. The results presented in Figures 7 and 8 are number density averages of corresponding microscopic parameters of individual dust grains and as such are determined by the smallest grains that dominate the dust size distribution used.
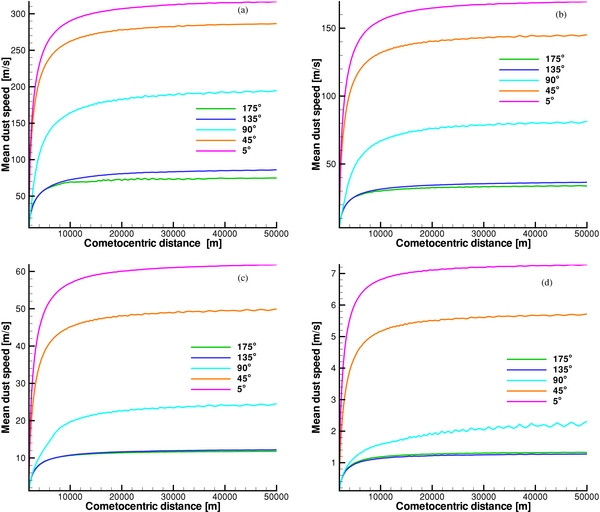
Figure 7. Mean dust velocity at heliocentric distances of 1.29 AU (a), 2.0 AU (b), 2.7 AU (c), and 3.25 AU (d) as a function of a cometocentric distance. The profiles give the absolute velocities along rays inclined at subsolar angles of 5°, 45°, 90°, 135°, and 175°.
Download figure:
Standard image High-resolution image
Figure 8. Dust number density at heliocentric distances of 1.29 AU (a), 2.0 AU (b), 2.7 AU (c), and 3.25 AU (d) as a function of a cometocentric distance. The near-surface number density of dust at subsolar angles of 90°, 135°, and 175° is the same due to the chosen local gas production rate used in this work and presented in Figure 1.
Download figure:
Standard image High-resolution imageThe dust grains start their motion having a negligibly small velocity at the surface of the nucleus and are accelerated by the gas drag as they move into the coma. It can be seen in Figure 7 that the dust decouples from the gas within the distance of approximately 10 nuclear radii. Being decoupled, the dust expands into the coma with a constant velocity and its number density decreases as r−2 (Figure 8) with increase of the cometocentric distance. The terminal velocity of the dust flow is a function not only of the heliocentric distance but also of the subsolar angle of the grains' origin. For the cases considered in this study, it changes by a factor of 6–7 (Figure 7) over the range of subsolar angles between 0° and 180° for a given heliocentric distance.
The radial dust density profile given in Figure 8 contains two signatures of the density spike. First, the increase and the following rapid drop of the dust density at a cometocentric distance of approximately 6 km at a heliocentric distance of 2.7 AU along the terminator (dark vertical line in the left panel of Figure 6). Second, a change of the slope of the density profile at a heliocentric distance of 3.25 AU along the terminator (dark vertical line in the right panel of Figure 6) at a cometocentric distance of about 8 km. In both cases, the changes in the pattern of the radial density distribution are caused by dust grains that populate the density spike.
5.4. The Dependence of the Dust Macroscopic Parameters on the Grain's Size
The motion of a dust grain is determined by the combination of the gravity of the comet's nucleus and by the gas drag in the coma. Assuming a constant density of the dust grains, the acceleration by the drag force (Equation (7)) is proportional to a−1, where a is the grain radius. This makes parameters of a dust grain's trajectory dependent on its mass and size. This effect is illustrated in Figures 9 and 10 where the dust number densities and velocities are plotted for grains of radii a = 10−7 m, 10−6 m, 10−5 m, and 10−4 m at a cometocentric distance of 20 km.

Figure 9. Total dust number density integrated over the grains' radius intervals of (1–1.5) × 10−7 m, (1–1.5) × 10−6 m, (1–1.5) × 10−5 m, and (1–1.5) × 10−4 m at a cometocentric distance of 20 km. The density profiles are presented at heliocentric distances of 1.29 AU (a), 2.0 AU (b), 2.7 AU (c), and 3.25 AU (d) as a function of a subsolar angle.
Download figure:
Standard image High-resolution image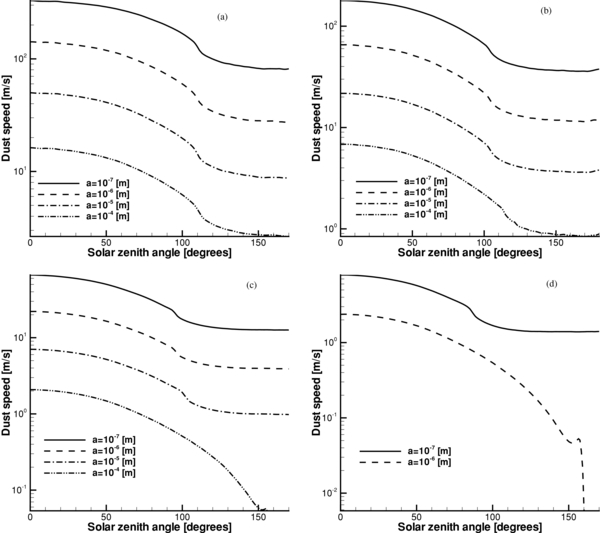
Figure 10. Dust grains' speed at heliocentric distances of 1.29 AU (a), 2.0 AU (b), 2.7 AU (c), and 3.25 AU (d) as a function of a subsolar angle. The speed profiles are presented for dust grains of 10−7 m, 10−6 m, 10−5 m, and 10−4 m at a cometocentric distance of 20 km.
Download figure:
Standard image High-resolution imageOur results show that the direction of the spike depends not only on the heliocentric distance (Figures 5 and 6) but also on the grain's size. With an increase in grain size, the direction of the spike is tilted more toward the nightside of the nucleus, which is caused by the increasing role of the nucleus' gravity in defining the trajectories of heavy dust grains. The density spike and presiding gap in the density and grain's mass flux distribution are marked in Figures 9 and 11 by the sharp decrease and following increase in dust density. It can be seen from the plot that the subsolar angle of the spike's position shifts in the anti-solar direction with increasing grain size.
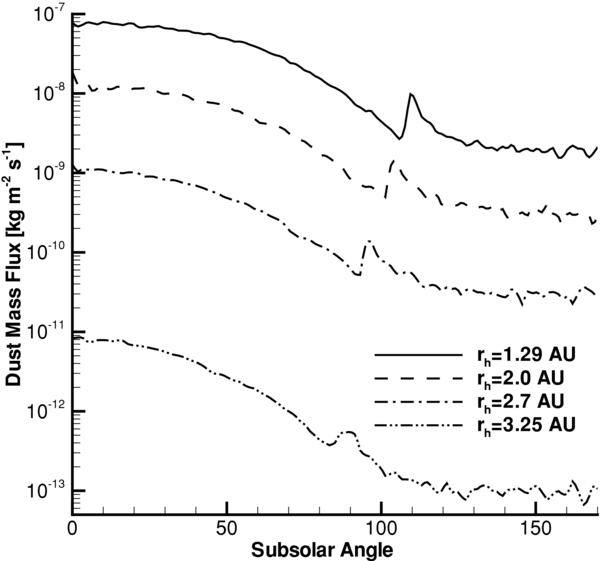
Figure 11. Mass flux of dust grains at a cometocentric distance of 20 km as a function of the subsolar angle for heliocentric distances of rh = 1.29 AU, 2.0 AU, 2.7 AU, and 3.25 AU.
Download figure:
Standard image High-resolution imageDepending on the cometocentric distance, the velocity of dust grains of the same size (Figure 10) can be different by a factor of 5–6, which is important to account for when modeling the inner coma.
The local value of the maximum liftable dust mass depends on both the heliocentric distance and the subsolar angle. For each grain mass and subsolar angle, there is a limiting heliocentric distance starting from which the grain can no longer be lifted from the surface of the nucleus. For example, at a heliocentric distance of 2.7 AU particles with the radius of a = 10−4 m are present in the coma at a cometocentric distance of 20 km on the dayside of the nucleus (Figure 9), while they are absent at the same altitude in the vicinity of the anti-solar direction. Similar patterns can be seen for dust grains with the radius of a = 10−6 m at a heliocentric distance of 3.25 AU.
5.5. The Distribution of the Terminal Velocity of the Dust Grains
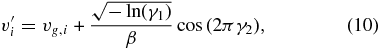
The terminal velocity that grains of the same radius can reach depends (Figure 10) on the subsolar angle of the grain's origin because of the variation in the gas flux with subsolar angle. The variation of the terminal velocity can be described in terms of the distribution function, fv(v), that is defined such that dN/N = fv(v)dv, where N is the total number of dust grains in a unit volume and dN/N gives the fraction of those particles that have terminal velocities, v, in the range of v ∈ (v, v + dv).
As was shown before, the dust decouples from the gas of the coma within approximately 10 nuclear radii. For this reason, in this work the terminal velocity distribution function, fv(v), is calculated at the cometocentric distance of rc = 20 km.
Our results indicate that the terminal velocity is a monotonic function of the subsolar angle (Figure 10) and there is a unique relation, θ(v), between the terminal velocity and the subsolar angle. Using  and
and  to denote the number density and velocity of the dust grains at the subsolar angle θ and the cometocentric distance rc, and accounting for the axial symmetry of the coma, the increment of the total number of dust grains is dN = 2πr2cnrc(θ)sin θdθdr. A simple transformation of variables (Grimmett & Stirzaker 2001) allows one to calculate the terminal velocity distribution function as
Here, vmax , min are the dust grain's terminal velocity at subsolar angles of θ = 0 and θ = π, respectively.
The modeled terminal velocity distribution function is presented in Figure 12 for grains of radii a = 10−7 m, 10−6 m, 10−5 m, and 10−4 m. It can be seen in Figure 10 that the rate of variation of the terminal velocity with change of the subsolar angle reaches its minima in the solar and anti-solar directions. As a result, a large number of dust grains have similar velocities, which explain the increase of the distribution function in the vicinity of vmax , min . Similarly, fv(v) has its minimum at the velocity that grains have in the vicinity of the terminator, the place that has the highest rate of change in dust velocity with the subsolar angle.

Figure 12. Terminal velocity distribution function at heliocentric distances of 1.29 AU (a), 2.0 AU (b), 2.7 AU (c), and 3.25 AU (d) as a function of a subsolar angle. The profiles are presented for dust grains of 10−7 m, 10−6 m, 10−5 m, and 10−4 m at a cometocentric distance of 20 km.
Download figure:
Standard image High-resolution imageThe Finson–Probstein approach (Finson & Probstein 1968) to understanding the distribution of dust in comets, as well as several subsequent variations (Fulle 2004), typically assumed a spherically symmetric outflow of gas and dust and yielded the usual one-to-one-to-one correspondence among dust particle size, terminal velocity, and radiation pressure acceleration (usually expressed in terms of β, its ratio to solar gravity). This correspondence has been used to invert observations of dust tails (e.g., Fulle 1987) to provide model-dependent information about the dust size distribution. Processes such as fragmentation of dust particles (Thomas & Keller 1991; Combi 1994; Fulle et al. 1995) have been shown to break the one-to-one-to-one correspondence, producing a range of terminal velocities for each dust particle size, so that particles of a particular size have a range of velocities when leaving the inner coma. The results shown in Figure 12 show that the variation in gas flux on the surface also introduces a large range of terminal velocities for each particle size, covering in this case roughly an order of magnitude from the smallest to the largest value. The variation in gas flux in the particular models shown here results from the variation of solar insolation with respect to solar zenith angle and yields a peculiar variation of dust particle velocity with subsolar angle. However, the more important interpretation of these results leads to a much more general expectation that dust particles of a particular size should be expected to have a rather broad range of so-called terminal velocities when leaving the inner coma. A realistic cometary surface is likely to be rather complex, mixing variations of gas flux and dust flux non-uniformly in location and time, the latter possibly being some combination of both irregular sporadic variations and periodic variations with rotation. The appearance of dust coma and tail images then will be the result of time and rotational averaging of a broad range of gas flux environments distributed on the surface; therefore, in general one can expect dust particle terminal velocities to cover a broad range of values up to the largest based on the maximum local gas flux.
5.6. The Effect of the Nucleus' Gravity on the Abundance of Heavy Dust Grains in the Coma Behind the Terminator
The results presented in Figures 9 and 10 show the presence of dust grains whose masses exceed the maximum liftable mass at the corresponding subsolar angle. These particles are transported from the pre-terminator part of the coma where they are accelerated to a velocity below the escape speed. This phenomenon is illustrated in Figure 13, which shows the dust number density integrated over the grain's radius of a ∈ (1, 1.5) × 10−4 m (a) and the speed distribution of the grains with radius a = 10−4 m (b) in the innermost coma at a heliocentric distance of 2.7 AU.
Figure 13. Total number density of dust grains integrated over the radius interval a = (1–1.5) × 10−4 m (a) and speed of dust grains with radius of a = 10−4 m (b) in the innermost coma at a heliocentric distance of 2.7 AU.
Download figure:
Standard image High-resolution image
As is seen in Figure 3, dust grains of this size can be lifted by the drag force at subsolar angles less than ∼50°. Depending on the position of their injection into the coma, such dust grains are accelerated to different velocities by the drag force. Some of them get velocities that exceed the escape speed and move into the far regions of the coma. Others, being decoupled from the gas phase of the coma, move in the gravitational field on elliptical orbits that intersect the nightside's surface of the nucleus as shown by the streamlines in Figure 13. The density and speed of non-escaping dust grains on the nightside of the nucleus depend on their initial position of injection. This also explains the peak in the dust density and the speed at the anti-subsolar point, where the elliptical orbits of the returning heavy dust grains intersect the comet's surface.
5.7. Implications of the Model Results for Measurements of the GIADA Instrument
The Grain Impact Analyser and Dust Accumulator (GIADA) on board the Rosetta spacecraft will collect dust in the environment of comet Churyumov-Gerasimenko. The main goal of the observations is to analyze physical and dynamical properties of individual dust grains ejected by the nucleus and to monitor the dust flux and spatial distribution as a function of time (Colangeli et al. 2007). To achieve this goal GIADA will measure the following physical quantities: cumulative dust mass flux (deposited mass per unit surface and time) from five different directions, momentum, velocity, and mass of single grains coming from the nucleus, dust velocity, and mass distributions as a function of time.
The total dust mass flux has been evaluated based on our model results and is presented in Figure 11. The mass flux presented in the figure is estimated at a cometocentric distance of 20 km. As was mentioned before, the dust grains reach their terminal velocity by this distance. So, the flux at cometocentric distances farther than 20 km can be calculated by scaling the presented results. Applying this to measurement predictions of the GIADA instrument, the scaling factor for the total dust mass flux will be
where  is the position of the spacecraft in the cometocentric frame of reference, S is the surface area of the instrument sensor, and
  is the normalized direction of view of the instrument. At smaller distances from the nucleus, this simple expression may not be valid because grains can have a significant tangential velocity and may not have reached terminal velocity either. It is important to remember that the effect of the dust charging is not included in this approximation, which can be important outside of the diamagnetic cavity.
6. SUMMARY
In this paper, we present the results of the development and application of our new Monte Carlo kinetic dusty gas model to the coma of comet 67P/Churyumov-Gerasimenko. The main focus of the presented work is the dust phase of the coma in the range of cometocentric distances important for the Rosetta mission. The dust phase was modeled starting from the surface of the nucleus up to 200 km, where the dust, which is accelerated beyond the escape velocity of the nucleus, is completely decoupled from the gas phase and expands into the outer coma acted upon by the gravity of the Sun and the solar radiation pressure.
The distinctive feature of our model is the self-consistent kinetic treatment of both the gas and the dust phases of the coma. This approach allows us to capture important kinetic effects that determine the state of the gas coma and the complex motion of the dust grains in a single fully coupled simulation. The acceleration of dust grains changes dramatically over the whole range of dust grain sizes present in a coma. The employed approach is based on modeling the evolution of the dust velocity and size distribution function. As a result, the whole range of dust grains can be modeled in the same simulation rather than considering individual dust groups as has to be done in a fluid approach.
The forces that are important for determining the dust grain's motion in the inner coma include the gravity of the nucleus and the drag by the gas. The latter is described in terms of the drag coefficient (Equation (8)) that depends on parameters such as temperature of the gas and dust grains as well as bulk velocity and molecular mass of the surrounding gas. In this work we have found that the back coupling of momentum exchange in the coma does not affect the gas phase for the production rate levels of comet 67P/Churyumov-Gerasimenko.
The balance of all applied forces defines the maximum mass of a grain that can be lifted from the surface. It was found that the radiation pressure can be important in determining the maximum liftable mass at the heliocentric distance of 3.25 AU. At smaller heliocentric distances its effect can be neglected and the maximum liftable mass can be estimated by balancing the nucleus' gravity and the drag force by the gas.
For each grain's mass and subsolar angle there is a heliocentric distance beyond which the gas drag cannot lift the dust grains. Because the minimum of the gas production is located on the nightside of the nucleus, the heaviest dust grains often cannot be lifted there. Even though such particles are not lifted directly, they still can be present in the coma behind the terminator. Being injected from the dayside of the nucleus and accelerated to a speed below escape, these grains are transported past the terminator by the gravity of the nucleus that dominates the motion of heavy dust grains.
Of course, the model calculations presented here are for water-dominated cometary nucleus activity only. There is observational evidence for more volatile species, e.g., CO and CO2 (Henry et al. 2002), remaining relatively more active, and perhaps even dominating activity and producing dust jets (Farnham et al. 2007) even when those regions of the nucleus are on the nightside. Our modeling approach can easily treat such situations, provided the nucleus boundary conditions can be specified.
Even though in our model the local dust production rate on the surface of the nucleus is proportional to that of the gas, the combined action of the gravity and drag force makes the general pattern of the distribution of the dust density in the inner coma very different from that of the gas. The most interesting feature in the general pattern of the dust distribution in the coma is the density spike. In the configuration of the surface gas sources used in this paper, the spikes originate in the vicinity of the terminator. It is important to note that the gas density profiles have no spike-like signatures in their distribution. Results obtained in this work indicate that these features of the dust distribution are formed in the regions of high variability of the gas density. So, they can be an indicator of the high gradients of the gas density in the coma. For example, if the spikes produced in the models here correspond to observed dust jets, then dust jets could actually appear at the edges of, or adjacent to, the responsible active gas jet region that is propelling the dust.
The variation of the gas and dust surface production rates with change of subsolar angle results in a strong subsolar angle dependence of the dust macroscopic parameters such as density and bulk velocity. It was found that the dust terminal velocity in the solar and anti-solar directions can be different by the factor of 5–6. The terminal velocity distribution obtained for dust grains of the same radius has some interesting properties. Because dust is accelerated by gas flows of different flux levels from different regions of the nucleus, in a realistic nucleus with a non-uniform gas production flux, dust particles of the same size will have smaller terminal velocities in low gas flux regions and larger terminal velocities in high gas flux regions. Therefore, instead of having predominantly a single-value delta function it will likely have a fairly broad range as wide as its mean value. It is important to account for the terminal velocity distribution in modeling the dust phase in the far regions of the coma.
This work was supported by JPL subcontract 1266313 under NASA grant NMO710889, NASA Planetary Atmospheres program grant NNX09AB59G, grant AST-0707283 from the NSF Planetary Astronomy program.