


ABSTRACT
We report on Transition Region And Coronal Explorer 171 Å observations of the GOES X20 class flare on 2001 April 2 that shows EUV flare ribbons with intense diffraction patterns. Between the 11th to 14th order, the diffraction patterns of the compact flare ribbon are dispersed into two sources. The two sources are identified as emission from the Fe ix line at 171.1 Å and the combined emission from Fe x lines at 174.5, 175.3, and 177.2 Å. The prominent emission of the Fe ix line indicates that the EUV-emitting ribbon has a strong temperature component near the lower end of the 171 Å temperature response (∼0.6−1.5 MK). Fitting the observation with an isothermal model, the derived temperature is around 0.65 MK. However, the low sensitivity of the 171 Å filter to high-temperature plasma does not provide estimates of the emission measure for temperatures above ∼1.5 MK. Using the derived temperature of 0.65 MK, the observed 171 Å flux gives a density of the EUV ribbon of 3 × 1011 cm−3. This density is much lower than the density of the hard X-ray producing region (∼1013 to 1014 cm−3) suggesting that the EUV sources, though closely related spatially, lie at higher altitudes.
Export citation and abstract BibTeX RIS
1. INTRODUCTION
The Transition Region And Coronal Explorer (TRACE) is a NASA Small Explorer mission to image the solar corona and chromosphere at white light, UV, and EUV wavelengths at 1'' spatial resolution (Handy et al. 1999). The EUV images are integrated over three narrow (∼6−10 Å) spectral bands around the lines of Fe ix (171 Å), Fe xii (195 Å), and Fe xv (284 Å), respectively. Visible light is excluded from the EUV channels by aluminum filters that are supported by an opaque 70 line-per-inch nickel mesh. While the diffraction of EUV photons on the nickel mesh generally is negligible, very intense sources show diffraction patterns that can be seen up to the 23rd order in some flares (Lin et al. 2001). Lin et al. 2001 discussed how these diffraction patterns can be used to estimate the fluxes of the saturated sources. At high orders, dispersion effects additionally give spectral information within the bandpass of the filter, providing temperature and emission measure (EM) diagnostics. Essentially, the presence of the mesh makes TRACE into a slitless spectrograph capable of imaging spectroscopy. We use these techniques established by Lin et al. (2001) to estimate the temperature and EM of EUV flare ribbons.
The EUV emission of flare ribbons correlates well in intensity (e.g., Mrozek et al. 2007) and location (e.g., Liu et al. 2007) with hard X-ray (HXR) emission produced by flare-accelerated electrons through the bremsstrahlung mechanism. While it is clearly established that there must be a link between the EUV ribbons and the energy release seen in non-thermal electrons, the link itself is not understood. Soft X-ray observations of flare ribbons are often difficult to obtain, as the coronal soft X-ray emission is generally brighter and therefore dominate the soft X-ray images. Nevertheless, soft X-ray emission from flare ribbons are likely always present (McTiernan et al. 1993; Hudson et al. 1994; Mrozek & Tomczak 2004). Temperature estimates from flare ribbons in soft X-ray show typical temperatures of several million K, but lower than the soft X-ray looptop sources.
In this paper, we derive the temperature and EM of the brightest flare ribbon sources of the GOES X20 flare of 2001 April 2. This extremely strong flare shows intense diffraction patterns of flare ribbons in the 171 Å images, providing a unique opportunity to estimate temperature and EM from TRACE diffraction patterns.
2. DIAGNOSTIC POTENTIAL OF TRACE DIFFRACTION PATTERNS
The dispersion at the order m is given by Δθ ∼ ma−1Δλ (Lin et al. 2001), where θ is the angle between the source and the diffraction pattern, Δθ is the dispersion introduced between two wavelengths separated by Δλ, and a is the pitch of the mesh (a = 3.63 × 10⁻⁴ for the TRACE 171 Å filter, as determined by Lin et al. 2001). The TRACE spatial resolution of 1'' gives a spectral resolution at the highest order diffraction pattern (m = 14) seen in the 2001 April 2 flare of Δλ = 1.26 (m/14)−1 Å (i.e., δλ/λ ∼ 0.008). Hence, the FHWM of the 171 Å bandpass of about 6.5 Å is dispersed by about ∼5Δλ or 10 TRACE pixels, allowing us to detect spectral features within the 171 Å passband. Hence, the diffraction patterns can provide temperature diagnostics of the EUV emitting plasma. For temperatures between 0.5 MK and 1.5 MK, the 171 Å passband is dominated by emission from Fe ix and Fe x lines (Figure 1). At very low (T < 0.5 MK) and very high (T > 30 MK), the emission is dominated by continuum (e.g., Raftery et al. 2011). If the diffraction patterns show two lines, the temperature of the EUV emitting plasma can be derived. In the absence of a second line, at least a lower and upper limit can be estimated. If the emission is produced by continuum (Feldman et al. 1999), the source should be elongated with a length equal or larger than Δθ. Hence, the diffraction patterns at higher order hold significant temperature diagnostics. However, the TRACE 171 Å response is biased toward emission from a 1 MK plasma (Figure 1, right) with much reduced sensitivity to high-temperature plasmas.

Figure 1. TRACE 171 Å response as a function of wavelength and temperature. Left: spectrogram plot convolved with the TRACE 171 Å temperature response using the same emission measure for all temperatures. Right: same plot but normalized for each temperature separately to highlight all lines and the continuum that are in principle available for diagnostics. Although there is a large variety of different lines seen (right), the TRACE 171 Å response highly favors emission from Fe ix and Fe x lines (left). Hotter lines such as Fe xxiv can only be detected in diffraction pattern if their emission measure is orders of magnitude larger than the emission measure of the Fe ix and Fe x lines (e.g., Raftery et al. 2011).
Download figure:
Standard image High-resolution imageIn practice, the diagnostic potential of the diffraction patterns mainly depends on the following three criteria: (1) since the intensity of the diffraction pattern is proportional to the intensity of the source, more intense sources and longer exposure times yield brighter diffraction patterns. (2) The background EUV emission at the location of the diffraction pattern should be low to simplify the background subtraction. (3) The EUV source should be spatially compact along the diffraction direction (i.e., of the same order or smaller than the TRACE resolution of 1'') to avoid a complex convolution between spatial and spectral information. We searched all X-class flares observed by TRACE for strong diffraction patterns of flare ribbons. The best example by far is the X-class flare on 2001 April 2 around 22 UT.
3. OBSERVATIONS OF THE X20 FLARE ON 2001 APRIL 2
The 171 Å image taken on 21:48:44 UT has the most intense diffraction patterns, clearly visible up to the 14th order (Figure 2). This image is taken at the HXR peak time (Figure 3), strongly suggesting that the EUV emission is coming from the flare ribbons. The disappearance of the diffraction patterns after the decay of the HXR emission supports this interpretation, as do their image morphology and interpolated positions. The emission at zero order, the flare ribbon itself, unfortunately falls a few arcsec outside the TRACE CCD, but likely would have been saturated anyway. However, the lowest orders clearly show the extent of the ribbon. Perpendicular to the direction of diffraction, the ribbon is extended with at least three individual sources (Figure 4). The parallel extent, however, is compact. Source 1 and 2 are significantly stronger than the third one. Consequently, the diffraction patterns at orders 11 and higher are best seen for the stronger two sources. For orders above 11, most clearly seen for order 14, the diffraction patterns show that dispersion produces a double source, indicating that the spectrum is dominated by two lines. This excludes significant continuum emission contributions in this spectrogram since that would smear out the source.
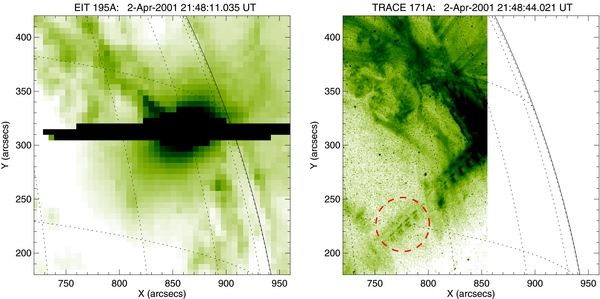
Figure 2. EUV imaging from Solar and Heliospheric Observatory/EIT 195 Å (left) and TRACE 171 Å (right) at the HXR peak time (dark corresponds to enhanced emission). The main flare emission around [870'';310''] is saturated in the EIT image. The flare occurs a few arcsec outside the TRACE image. However, the diffraction patterns generated in southeastern direction are clearly visible occurring at a location of low background emission (dashed red circle is high-lightening diffraction patterns at orders 11–14).
Download figure:
Standard image High-resolution image
Figure 3. GOES soft X-ray and Hard X-ray Spectrometer (HXRS) hard X-ray time profile of the 2001 April 2 flare (GOES time profiles are saturated during the peak). The time of the TRACE image with the most prominent diffraction patterns (red vertical line) occurs right at the peak time of the non-thermal hard X-ray emission. This strongly suggests that the EUV emissions producing the diffraction patterns come from the flare ribbons.
Download figure:
Standard image High-resolution image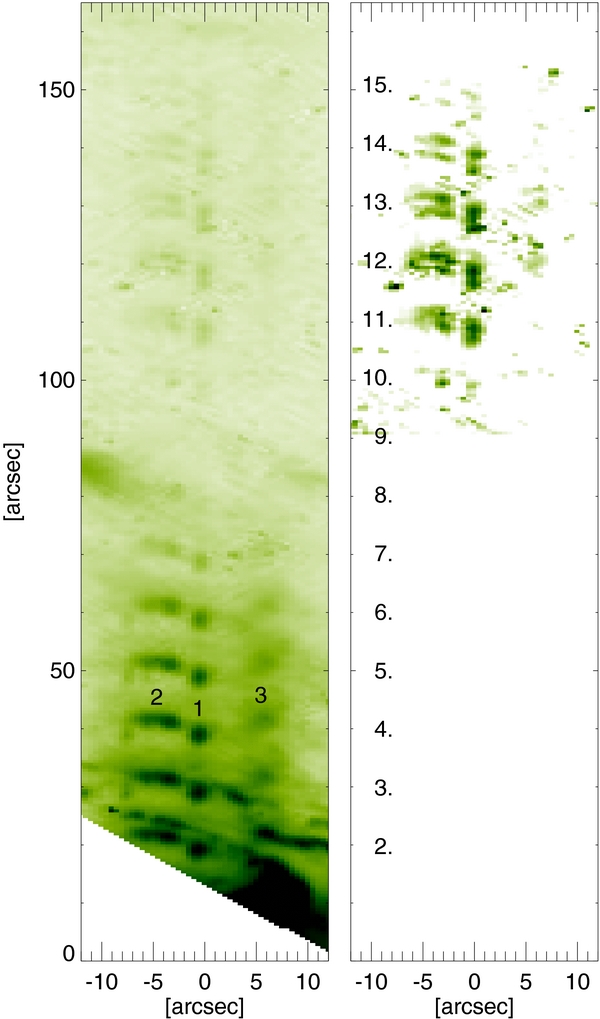
Figure 4. Details of the diffraction patterns in the southeastern direction. The TRACE image shown in Figure 1 has been rotated and the location of the strongest EUV source has been set as the new origin. The edge seen in the image corresponds to the edge of the TRACE CCD. The left image is scaled to show the low-order diffraction patterns mostly clearly, while the right image is scaled to enhance the higher order patterns with the low-order patterns not shown. The low-order patterns clearly reveal emission from an elongated flare ribbon that is unresolved perpendicular to the ribbon. The clearest case of dispersion is observed in the 14th order where the emission from the flare ribbon is split into two sources. Cosmic ray hits occasionally interfere with the diffraction patterns, most notable for parts of the 12th and 13th order emission.
Download figure:
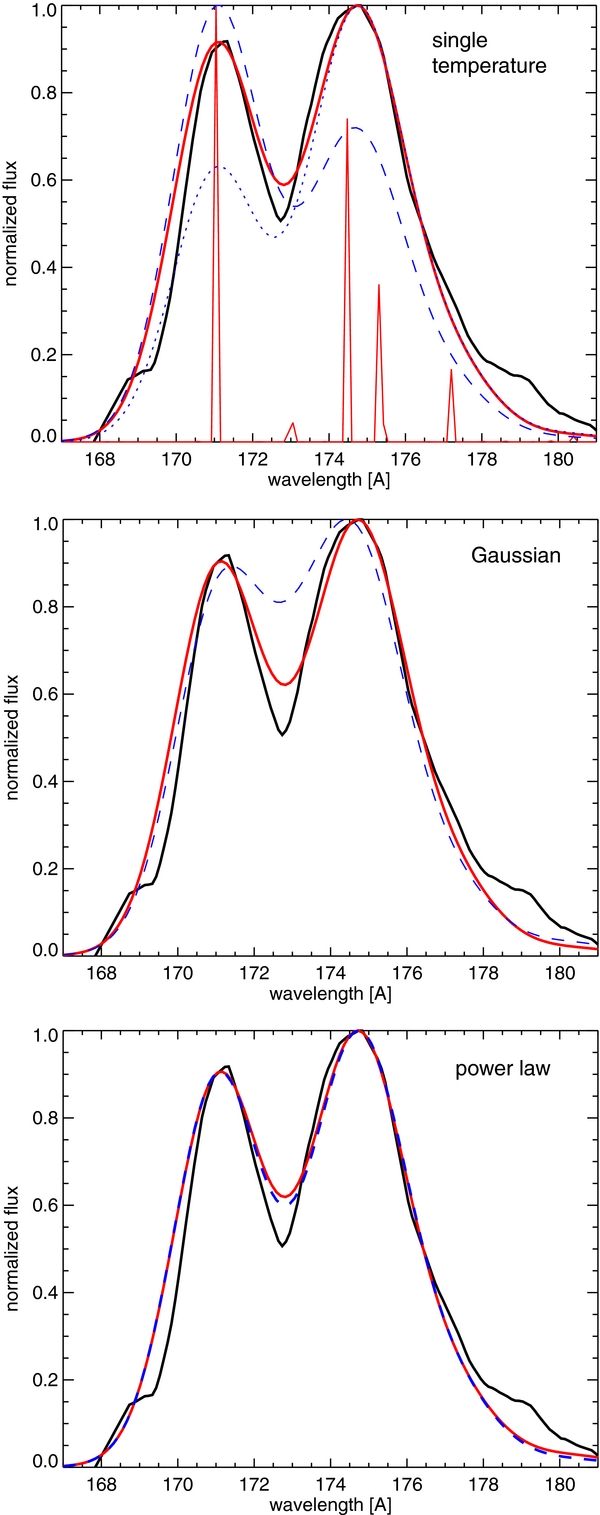
Standard image High-resolution imageTranslating the spatial information into wavelength, θ ∼ ma−1λ (for details see Lin et al. 2001), a spectrum for each order can be derived. Figure 5 shows the combined spectrum using order 11 through 14, avoiding spectra that are contaminated with cosmic ray hits. The two peaks in the spectrum can be identified as the lines of Fe ix at 171.1 Å and the Fe x at 174.5, 175.3, and 177.2 Å . Using a single temperature component, the observed spectrum can be best fit for a temperature of 0.65 MK (red curve in Figure 5, top). For an isothermal plasma, the line emissions are very sensitive to temperature variations and fits with 0.60 MK and 0.70 MK do not match the observations (blue curves in Figure 5, top). However, the EUV flare ribbons are like a multi-thermal plasma. Therefore, we also fit a Gaussian (Figure 5, center) and power-law (Figure 5, bottom) temperature distribution. The best Gaussian fits are provided by peak temperatures around 0.66 MK and an FWHM of 0.10 MK or smaller. In this fit, the contributions of Fe ix and Fe x from the cold and hot wing of the Gaussian distribution are averaging out and the observed spectrum is matched. Increasing the FWHM to even larger values, however, adds contribution from low-temperature lines of O v and O vi (see Figure 1), and the spectrum starts to deviate from the observations (dashed blue line in Figure 5, center). Gaussian fits with peak temperatures above ∼0.7 MK are excluded because the Fe x emission becomes too strong. A power-law distributed fit with a sharp temperature cutoff at low temperatures works well for much of the parameter range, as long as the cutoff temperature is between ∼0.5 and 0.7 MK and the power-law index is negative (see Figure 5, bottom). In summary, the observed spectrum shows that the EUV-emitting flare ribbons are at the lower end of the 171 Å temperature sensitivity between ∼0.5 MK and ∼0.7 MK.
Figure 5. In all panels, the black curve gives the spectrum derived from the diffraction pattern. Three different temperature distributions are fitted to the data: (top) a single temperature component at ∼0.65 MK fits the data well (red curves). The fit is shown as a line spectrum and convolved with the spectral resolution obtained by diffraction pattern method (see Section 2). For comparison, the blue dashed and dotted curves show spectra for 0.6 MK and 0.7 MK, respectively. Center: the red line gives a fit to the observed spectrum using a Gaussian temperature distribution around 0.66 MK with an FWHM of 0.10 MK. This fit represents the observed spectrum almost as well as the single temperature fit shown above. If the FWHM is large such as 0.4 MK (dashed blue curve), contributions by low-temperature lines of O v and O vi (see Figure 1) produce a disagreement with the observations. Bottom: fit using a power-law distribution with a sharp low energy cutoff. Many fit parameters provide good agreement as long as the cutoff temperature is between ∼0.5 MK and 0.7 MK and power-law index α is negative. The spectra shown are for a cutoff temperature of 0.50 MK and α = −3.0 (red) and 0.58 MK and α = −9.2 (dashed blue).
Download figure:
Standard image High-resolution image
Knowing the temperature range of the EUV-emitting flare ribbon, it is possible to estimate the density of the emitting plasma. For simplicity, we are only estimating the density of source 1 (see Figure 1) that has an area of 1 5 × 1'' (FWHM). Using Equation (4) from Lin et al. 2001, the desaturated intensity of footpoint 1 becomes 1.4 × 10⁵ DN s−1. Compared to the statistical study of EUV footpoints by Mrozek et al. 2007, this value is comparable to the largest values reported (note that the value cited here is for source 1 only, while Mrozek et al. 2007 report flare-integrated values). Using the temperature of 0.65 MK, the desaturated intensity, and the 171 Å filter response, the EM of footpoint 1 becomes EM ∼ n2V ∼ 6 × 1046 cm−3. To derive the density of the EUV emitting plasma, n, the vertical depth of the source has to be assumed. Using a value of d1 = 1'' gives a density of 3 × 10¹¹d−0.51 cm−3. Using lower temperatures slightly increases the density, but even for a temperature of 0.5 MK, the density stays of the same order of magnitude at 4 × 1011 cm−3. Similarly, if the flare ribbon is narrower or thinner than what is used above, the density does not increase very quickly. Hence, even for extreme parameters, the derived density is still below 1012 cm−3.
4. DISCUSSION AND CONCLUSIONS
Using the spectral information provided by the TRACE diffraction patterns, we estimated the temperature and density of EUV flare ribbon for the 2001 April 2 flare at the HXR peak time. For the brightest source on the flare ribbon in the 171 Å image, the estimated temperature is around 0.65 MK and the density of the EUV-emitting ribbons is 3 × 1011 cm−3. This density is lower than the density of the HXR producing region, which has been estimated at ∼1013 cm−3 to ∼1014 cm−3 (e.g., Kontar et al. 2008; Saint-Hilaire et al. 2010), suggesting that EUV ribbons are above the HXR footpoint sources.
The estimated temperature is biased toward the 171 Å temperature response. The FWHM of the 171 Å temperature response gives temperature between ∼0.6 MK and ∼1.3 MK, with contributions from colder and hotter plasma rapidly decreasing (e.g., Phillips et al. 2005). Hence, the derived temperature is heavily weighted toward a narrow temperature range around 1 MK (Figure 1). Within this temperature range, the rather strong intensity of the observed Fe ix line compared with Fe x indicates that the derived temperature is at the lower end of the 171 Å sensitivity range. Hence, the differential EM above 0.7 MK must decrease with increasing temperature. However, the much lower sensitivity of the 171 Å filter to plasma at several MK makes the diffraction pattern diagnostics less valuable for higher temperatures. As an example, for 5 MK plasma that emits emission in the 171 Å passband below the detection limit in the diffraction patterns (we estimate a signal-to-noise ratio from the observed diffraction patterns of about 10), we estimate an upper limit of EM5 MK < 50 × EM ∼ 3 × 1048 cm−3, where EM is the emission measure at 0.65 MK. The upper limit for a density of the 5 MK plasma then becomes 2 × 1012 cm−3. Hence, the EM at 5 MK could be much larger than the derived EM at 0.65 MK. Similarly, the absence of smeared-out sources in the diffraction patterns does not provide very strong diagnostics for very hot temperatures. We should obtain better high temperature diagnostics from diffraction patterns of some of the filters of the Atmospheric Imaging Assembly on board the Solar Dynamic Observatory, in particular if combined with soft X-ray observations from Hinode. This will provide new insights into the temperature distribution of flare ribbons that are crucial in understanding the flare energetics.