


ABSTRACT
The Baldwin, Phillips, and Terlevich emission-line ratio diagnostic ([O iii]/Hβ versus [N ii]/Hα, hereafter BPT diagram) efficiently separates galaxies whose signal is dominated by star formation (BPT-SF) from those dominated by active galactic nucleus (AGN) activity (BPT-AGN). Yet this BPT diagram is limited to z < 0.5, the redshift at which [N ii]λ6584 leaves the optical spectral window. Using the Sloan Digital Sky Survey (SDSS), we construct a new diagnostic, or TBT diagram, that is based on rest-frame g − z color, [Ne iii]λ3869, and [O ii]λλ3726 + 3729 and can be used for galaxies out to z < 1.4. The TBT diagram identifies 98.7% of the SDSS BPT-AGN as TBT-AGN and 97% of the SDSS BPT-SF as TBT-SF. Furthermore, it identifies 97% of the OPTX Chandra X-ray-selected AGNs as TBT-AGN. This is in contrast to the BPT diagram, which misidentifies 20% of X-ray-selected AGNs as BPT-SF. We use the Great Observatories Origins Deep Survey North and Lockman Hole galaxy samples, with their accompanying deep Chandra imaging, to perform X-ray and infrared stacking analyses to further validate our TBT-AGN and TBT-SF selections; that is, we verify the dominance of AGN activity in the former and star formation activity in the latter. Finally, we address the inclusion of the majority of the BPT-comp (sources lying between the BPT-SF and BPT-AGN regimes) in our TBT-AGN regime. We find that the stacked BPT-comp source is X-ray hard (〈Γeff〉 = 1.0+0.4−0.4) and has a high X-ray luminosity to total infrared luminosity ratio. This suggests that, on average, the X-ray signal in BPT-comp is dominated by obscured or low accretion rate AGN activity rather than by star formation, supporting their inclusion in the TBT-AGN regime.
Export citation and abstract BibTeX RIS
1. INTRODUCTION
The most commonly used optical emission-line diagnostic for separating star-forming galaxies from type II active galactic nuclei (AGNs) relies on [O iii]λ5007/Hβ versus [N ii]λ6584/Hα (hereafter BPT diagram— Baldwin et al. 1981; Veilleux & Osterbrock 1987). The basic idea is that the emission lines in star-forming galaxies are powered by massive stars, so there is a well-defined upper limit on the intensities of the collisionally excited lines relative to the recombination lines (such as Hα or Hβ). In contrast, AGNs are powered by a source of far more energetic photons, making the collisionally excited lines more intense relative to the recombination lines. Two demarcations are commonly used for identifying AGN-dominated galaxies versus star formation-dominated galaxies—(1) the Kewley et al. (2001) theoretical division between galaxies whose extreme-ultraviolet ionizing radiation field is dominated by an AGN (>50%) and those dominated by star formation and (2) the Kauffmann et al. (2003) empirical demarcation based on the location of the Sloan Digital Sky Survey (SDSS; York et al. 2000) star-forming galaxies. Galaxies that lie between these two curves are often referred to as composite galaxies. Hereafter, we refer to these categories as BPT-AGN, BPT-SF, and BPT-comp.
The BPT diagram is limited in its use with optical spectra to galaxies with z < 0.5 (the redshift at which [N ii] leaves the optical spectral window). A number of groups have tried to extend optical emission-line diagnostics to higher redshifts by only using lines at the blue end of the spectrum. Lamareille (2010) replaced [N ii]/Hα with [O ii]λ3726+λ3729/Hβ, creating the "blue diagram," which can be used to classify galaxies out to z < 0.9 (see also Tresse et al. 1996; Rola et al. 1997; Lamareille et al. 2004). They find that this diagnostic is very successful at identifying star-forming galaxies (with >99% of the BPT-SF still classified as SF-dominated) but that it requires complementary diagnostics to robustly classify BPT-AGN (see Marocco et al. 2011). We also note that [O ii] and Hβ are relatively distant in wavelength, requiring more careful calibration and extinction corrections.
Recently, Yan et al. (2011) and Juneau et al. (2011) introduced the CEx and MEx diagnostics, respectively, in which they replaced [N ii]/Hα with rest-frame U − B color (CEx) or with stellar mass (MEx; see also Weiner et al. 2007). Both diagnostics recover the BPT-AGN classification very well, with 95.7% and >99% of the BPT-AGN still classified as AGNs in the CEx and MEx diagnostics, respectively. However, because these diagnostics rely on Hβ at λ4861 Å, their use with optical spectra is limited to z < 1.
At higher redshifts, the Stasińska et al. (2006) DEW diagnostic, based on Dn[4000], [Ne iii]λ3869, and [O ii] (see also Rola et al. 1997), can be used with optical spectra out to z < 1.4, at which point the lines move into the infrared. While these emission lines are not as strong as [O iii] and Hβ, their ratio is the only choice for pushing optical spectra to these higher redshifts. [Ne iii] emission indicates the presence of highly ionized gas and is much stronger than [O ii] in high-excitation AGNs. However, because Dn[4000] requires a sufficiently high signal-to-noise continuum (i.e., using SDSS, we find that the uncertainty on Dn[4000] ranges from 5% at SN/Å = 5 to 25% at SN/Å = 1; see also Cardiel et al. 1998) and requires the survey to be spectrophotometrically calibrated, its usage with distant galaxies is limited.
In this paper, we examine whether rest-frame g − z color, which requires near-infrared imaging at the higher redshifts, is a compelling replacement for Dn[4000]. While the ratio of [Ne iii]/[O ii] alone effectively separates metal-rich star-forming galaxies from AGNs, metal-poor star-forming galaxies have high values of [Ne iii]/[O ii] (as a result of less line blanketing enabling a harder stellar radiation field). Fortunately, metal-poor galaxies also tend to be bluer (see Figure 7 in Tremonti et al. 2004), so we can use their color to distinguish them from AGNs (which tend to be bulge dominated and redder; see Yan et al. 2011). We refer to this new diagnostic as the Trouille, Barger, and Tremonti (TBT) diagram.
We first establish the reliability of the TBT diagnostic in reproducing the BPT classifications at low redshifts using SDSS, the largest spectroscopic sample to date of emission-line galaxies. We then test the TBT diagnostic at higher redshifts using the highly spectroscopically complete OPTX X-ray-selected sample of AGNs (Trouille et al. 2008, 2009; Trouille & Barger 2010). The misidentification of X-ray-selected AGNs as SF-dominated galaxies is a potential issue for all optical emission-line diagnostic diagrams. In Trouille & Barger (2010), we found that ∼20% of the LX > 1042 erg s−1 Chandra X-ray-selected AGNs in our OPTX sample that have [O iii], Hβ, [N ii], and Hα fluxes with signal-to-noise ratio (S/N) greater than five are misidentified by the BPT diagram as BPT-SF (see also Winter et al. 2010 for evidence of this in the Swift Burst Alert Telescope (BAT) sample and Bongiorno et al. 2010 for evidence of this in the XMM-COSMOS sample). Existing high-redshift optical emission-line diagnostics also misidentify a significant fraction of X-ray-selected AGNs, e.g., ∼8% and ∼22% of X-ray-selected AGNs in the MEx and CEx diagrams lie in the MEx-SF and CEx-SF regimes, respectively.
Stacking techniques have been widely used in X-ray astronomy to study the average properties of source populations selected to have certain well-defined properties and which are too X-ray faint to be detected individually (e.g., Brandt et al. 2001; Alexander et al. 2001; Hornschemeier et al. 2002; Nandra et al. 2002; Georgakakis et al. 2003; Laird et al. 2005; Lehmer et al. 2005, 2008; Treister et al. 2009). As a proof of concept of the TBT diagnostic, we perform an X-ray stacking analysis of the TBT-SF and TBT-AGN in the highly spectroscopically complete Great Observatories Origins Deep Survey North (GOODS-N; Giavalisco et al. 2004) with accompanying Chandra Deep Field North (CDFN; Alexander et al. 2003) imaging to determine whether they are, on average, X-ray soft or X-ray hard.
An X-ray hard source is indicative of obscured AGN activity or the presence of high-mass X-ray binaries (HMXBs) associated with ongoing star formation. An X-ray soft source is indicative of unobscured AGN activity or the presence of low-mass X-ray binaries (LMXBs) associated with old stellar populations. In order to distinguish between these scenarios, we perform an infrared (IR) stacking analysis using the Spitzer Space Telescope 24 μm data. Numerous studies have found a relation between the X-ray and IR luminosities for star-forming galaxies and for AGNs (Ptak et al. 2003; Persic et al. 2004; Alexander et al. 2005; Teng et al. 2005; Georgakakis et al. 2007). We compare the X-ray and IR luminosities for our stacked TBT-SF and stacked TBT-AGN with the results from these studies to verify the dominance of star formation activity in the former and AGN activity in the latter.
We then perform X-ray and IR stacking analyses of the BPT categories to confirm the presence of AGN activity in BPT-comp, as suggested by the TBT diagnostic. In most optical emission-line diagnostics, the BPT-comp lie in a transition region or within the SF-dominated regime. For example, Kewley et al. (2006) find that BPT-comp are indistinguishable from H ii regions and are significantly distinct from Seyferts in an [O iii]/[O ii] versus [O i]/Hα plot. In both the "blue diagram" and the CEx diagnostic, the majority of BPT-comp lie within their SF-dominated regimes (∼83% and ∼75%, respectively). In contrast, the bulk of BPT-comp lie within our TBT-AGN regime (see also the MEx diagnostic). Because BPT-comp are a significant percentage of the overall low-redshift emission-line galaxy population (e.g., in SDSS,5 BPT-SF, BPT-comp, and BPT-AGN comprise 69%, 20%, and 11%, respectively, of the overall population), inclusion or exclusion of BPT-comp in AGN samples can have an important impact on results. In order to have the necessary statistics required to do a robust stacking analysis, we combine our GOODS-N galaxy sample with galaxy samples from two Lockman Hole (LH) fields, all of which have deep Chandra imaging.
The structure of the paper is as follows. In Section 2, we briefly describe the SDSS sample, our OPTX X-ray-selected sample of AGNs, and our optical spectroscopic samples of the GOODS-N/LH fields. In Section 3, we use the SDSS sample to calibrate our TBT diagnostic to match the BPT diagram. In Section 4, we determine how well our TBT-AGN selection matches with an X-ray selection of AGNs. In Section 5, we do X-ray and IR stacking analyses to verify the reliability of our TBT-AGN and TBT-SF classes. In Section 6, we do X-ray and IR stacking analyses on our BPT-comp to determine whether the implications of the TBT diagnostic with respect to the dominance of AGN activity in BPT-comp are confirmed. In Section 7, we compare our TBT diagnostic to other diagnostics for separating star-forming galaxies from AGNs. In Section 8, we summarize our results.
All magnitudes are in the AB magnitude system. We assume ΩM = 0.3, ΩΛ = 0.7, and H0 = 70 km s−1 Mpc−1.
2. SAMPLE
2.1. SDSS: Low-redshift Galaxy Sample
SDSS has obtained deep, multi-color images covering more than a quarter of the sky with follow-up spectroscopy of over a million objects. Here, we use the SDSS spectroscopic data from Data Release 8 (DR8; Aihara et al. 2011). We use the emission-line fluxes measured by the MPA-JHU group as described in Section 4.3 of the data release paper. These fluxes are estimated from simultaneous Gaussian fits to the continuum-subtracted spectra to account for stellar absorption and line blending. DR8 provides spectra for 868,492 different galaxies. The SDSS spectral range is 3800–9200 Å. Since the [O ii] line lies at 3726 Å and the [N ii] line lies at 6584 Å, we limit our SDSS samples to galaxies with 0.02 < z < 0.35. Our SDSS BPT sample consists of the 243,865 SDSS galaxies that have Hα, [N ii], Hβ, and [O iii] fluxes with S/N greater than five (out of the 818,333 spectra for different galaxies in the DR8 sample). Of these SDSS BPT galaxies, 23,048 also have both [Ne iii] and [O ii] fluxes with S/N >5. We refer to these as our SDSS TBT sample.
2.2. OPTX: X-ray-selected Sample of AGNs
The OPTX sample consists of 1789 X-ray sources in two intermediate-depth wide-field surveys in the LH region of low galactic column density and one deep pencil-beam survey (CDFN; Brandt et al. 2001; Alexander et al. 2003). The LH fields are the Chandra Large Area Synoptic X-ray Survey (CLASXS; Yang et al. 2004) and the Chandra Lockman Area North Survey (CLANS; Trouille et al. 2008, 2009; Wilkes et al. 2009). We have spectroscopically observed 84% of the OPTX sources using the DEep Imaging Multi-Object Spectrograph (DEIMOS; Faber et al. 2003) on the Keck II 10 m telescope and the HYDRA multi-object spectrograph on the WIYN6 3.5 m telescope (for details of the observations and reduction process, see Trouille et al. 2008).
In Trouille et al. (2008, 2009), we used the X-ray fluxes and spectroscopic redshifts to calculate rest-frame 2–8 keV luminosities, LX. At z < 3 (which is all we consider in this paper), we calculated the luminosities from the observed-frame 2–8 keV fluxes, assuming an intrinsic X-ray spectral index of Γ = 1.8. That is, LX = f × 4πd2L × k-correction, where for z < 3, k-correction =(1 + z)Γ − 2 and f = f2–8 keV. Using the individual X-ray spectral indices (e.g., 〈Γ〉 ∼ 1.75 with a dispersion of ≈0.33 derived by Tozzi et al. 2006 for the X-ray bright Chandra Deep Field South sources), rather than the universal X-ray spectral index of Γ = 1.8 adopted here, to calculate the k-corrections would result in only a small difference (an average factor of 0.9) in the rest-frame luminosities. We have not corrected the X-ray luminosities for absorption since these corrections are small in the 2–8 keV band (e.g., Barger et al. 2002), and we are only using the X-ray luminosities to identify sources as X-ray AGNs.
In the following, we limit our study to the 561 OPTX X-ray sources with spectroscopic redshifts, whose 2–8 keV flux has a significance greater than 3σ, and whose LX > 1042 erg s−1 (247, 163, and 151 sources from the CLANS, CLASXS, and CDFN fields, respectively). LX > 1042 erg s−1 is a commonly used conservative threshold for AGN activity (Hornschemeier et al. 2001; Barger et al. 2002; Szokoly et al. 2004; Silverman et al. 2005; Coil et al. 2009) that is based on energetic grounds (Zezas et al. 1998; Moran et al. 1999). Using the calibration by Ranalli et al. (2003), one would need a star formation rate (SFR) of 200 M☉ yr−1 to produce enough X-ray luminosity from non-AGNs to cross this threshold. In Trouille & Barger (2010), we found a <5% contamination rate of our OPTX sample by sources with SFR > 200 M☉ yr−1. We determined this using the Magnelli et al. (2009) space densities at a range of redshifts for ultraluminous infrared galaxies (ULIRGs) with estimated SFR > 172 M☉.
Our study focuses on optical emission-line ratio diagnostics based on flux ratios. We compute the relative line fluxes from the spectra using the Tremonti et al. (2004) software. In brief, we subtract the stellar continuum and absorption lines by fitting a linear combination of single stellar population models of different ages (Bruzual & Charlot 2003). We remove any remaining residuals from the continuum using a sliding 250 Å median. The relative line fluxes and errors are estimated from simultaneous Gaussian fits to the continuum-subtracted spectra.
Our DEIMOS spectra are of high quality from ∼4800 Å to ∼9300 Å, such that the [O ii] and [Ne iii] lines lie within our spectral window from z ∼ 0.3 to 1.4. Of our 561 OPTX X-ray sources, 197 are non-broad-line AGNs (hereafter non-BLAGNs; FWHM < 2000 km s−1) and lie within this redshift range. We only include non-BLAGNs in this analysis, since the narrow lines in BLAGNs are overwhelmed by the emission from the broad-line region. We identify 103 OPTX X-ray-selected AGNs that have [Ne iii] and [O ii] fluxes with S/N >5.
2.3. GOODS-N/LH: Higher-redshift Galaxy Sample
Each of the three OPTX fields is the focus of a comprehensive spectroscopic follow-up of all galaxies in the field. The CDFN encompasses the intensively studied GOODS-N field, which we describe in more detail below. The CLANS and CLASXS fields reside in the LH region of low Galactic column density.
A random spectroscopic sample of 3082 Ks, AB < 21.5 galaxies in these two LH fields was obtained using DEIMOS on Keck II (L. Cowie 2008, private communication). We hereafter refer to this combined sample as the LH galaxy sample.
The GOODS-N field has among the deepest images ever obtained in a number of bandpasses, including the Chandra 2 Ms CDFN image. It also has been the target of extensive spectroscopic observations over the years (e.g., Cohen et al. 2000; Wirth et al. 2004; Cowie et al. 2004; Barger et al. 2008; Cooper et al. 2011). With its high optical spectroscopic completeness and deep X-ray coverage, the GOODS-N catalog provides an ideal sample for studying the average X-ray properties of optically selected samples of AGNs.
Barger et al. (2008) presented a highly complete spectroscopic survey of the GOODS-N field. Over the years, a number of groups have made observations of this region, first primarily using the Low-Resolution Imaging Spectrograph (LRIS; Oke et al. 1995) on the Keck I 10 m telescope and later using DEIMOS. Barger et al. added to these samples by observing all missing or unidentified galaxies to date with DEIMOS. In order to provide a uniform spectral database, they also re-observed sources where the original spectra were of poor quality or where previous redshifts were obtained with instruments other than DEIMOS. The redshift identifications are now greater than 90% complete to magnitudes of F435WAB = 24.5 and Ks, AB = 21.5 and to 24 μm fluxes of 250 μJy. The final Barger et al. catalog provides spectroscopic redshifts for 2710 galaxies in this field.
We compute the relative line fluxes for the relevant emission lines in the combined GOODS-N/LH galaxy sample using the same method and software as described for the OPTX X-ray sample above. To create our GOODS-N/LH BPT diagram, we use the 727 sources that have [O iii], Hβ, [N ii], and Hα fluxes with S/N > 5. For our GOODS-N TBT diagram, we use the 670 sources that have [Ne iii] and [O ii] fluxes with S/N > 5. As discussed in the previous subsection, because of the DEIMOS spectral window, the GOODS-N sources plotted in our TBT diagnostic have a redshift range from z = 0.3 to 1.4.
In Figure 1, we show the redshift distributions (out to z = 1.5) for the SDSS, GOODS-N, LH, and OPTX samples. The large SDSS sample has a median redshift of 〈z〉 ∼ 0.1, whereas the GOODS-N, LH, and OPTX surveys allow us to test our TBT diagnostic out to z = 1.4.
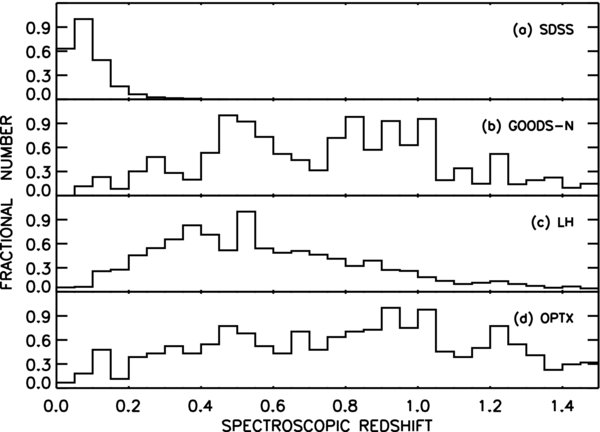
Figure 1. Spectroscopic redshift distribution out to z = 1.5 for (a) the SDSS BPT sample, (b) the GOODS-N galaxy survey, (c) the LH galaxy survey, and (d) the OPTX survey. The different redshift ranges seen in panels (a)–(c) reflect the magnitude limits of the different surveys.
Download figure:
Standard image High-resolution image2.4. Rest-frame g, z Magnitudes
We have u, g, r, i, z magnitudes for the SDSS galaxies (Abazajian et al. 2009), g, r, i, z, J, H, Ks magnitudes for the OPTX AGNs and LH galaxies (Trouille et al. 2008; Keenan et al. 2010), and B, V, R, I, Z, J, H, Ks magnitudes for the GOODS-N galaxies (Giavalisco et al. 2004; Barger et al. 2008; Keenan et al. 2010). We transform the observed photometry into g and z magnitudes at z = 0 using kcorrect v4_1_4 (Blanton & Roweis 2007). For z = 1.4 sources, the g band (∼0.5 μm) redshifts into the J band (∼1.2 μm) and the z band (∼0.9 μm) redshifts into the K band (∼2.2 μm). As a result, fields with extensive photometric coverage use observed-frame bandpasses that are very close to the rest-frame g and z bandpasses of interest, and so the k-corrections are small. For our TBT diagnostic, we subtract the rest-frame z band from the rest-frame g band to obtain the rest-frame g − z color; hereafter, 0.0(g − z).
To determine the error associated with the 0.0(g − z) color for each sample, we randomly alter the magnitudes by an amount consistent with the photometric uncertainties and re-run the Blanton & Roweis (2007) software. We then determine the 1σ standard deviation on Δ = 0.0(g − z)original − 0.0(g − z)random. For our SDSS sample, σΔ = 0.21. For our GOODS-N/LH sample, σΔ = 0.07. The high-quality photometry and extensive coverage of our GOODS-N/LH fields ensures these low k-correction errors.
Chilingarian et al. (2010) compare the Blanton & Roweis (2007) kcorrect code with their own to explore the systematic error associated with k-correction software. For k-corrected optical colors (e.g., 0.0[g − r], 0.0[r − z]), the differences between the resulting colors from the two codes are relatively small (∼0.05 or less). Therefore, for our study, systematic errors are not significant. However, we note here for completeness that for k-corrected colors in which one band is in the rest-frame IR (e.g., 0.0[r − H], 0.0[r − K]), the differences can be significant (∼0.15; see their Figure 7), and the systematic error needs to be taken into account.
3. A NEW z < 1.4 EMISSION-LINE RATIO DIAGNOSTIC
Figure 2 shows the BPT diagram (based on flux ratios of the specified lines) applied to our SDSS BPT sample. The dotted curve indicates the Kewley et al. (2001) theoretical division and the dashed curve indicates the Kauffmann et al. (2003) empirical division between AGNs and star-forming galaxies, as discussed in Section 1. In this and subsequent figures, we represent the SDSS data using a combination of a two-dimensional histogram and plotted points. We histogram the data where more than four data points fall in an individual pixel (the size of the pixel is determined by dividing the plot into 150 × 150 bins) and plot it as individual points otherwise. The histograms have been square root scaled for better visibility. Each step in contour level represents 20% fewer sources. The darkest contours correspond to 391 sources, 42 sources, and 151 sources for the BPT-SF, BPT-AGN, and BPT-comp, respectively.
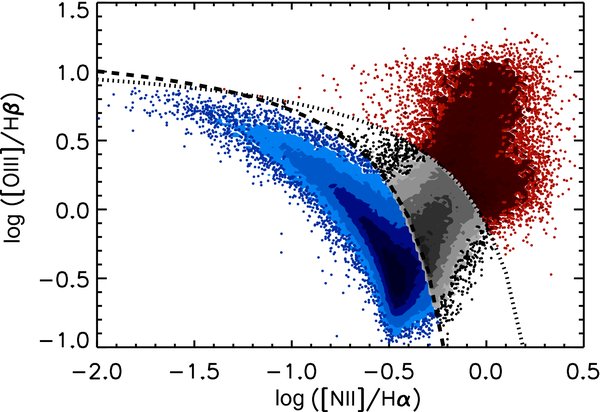
Figure 2. BPT diagram—log ([N ii]/Hα) vs. log ([O iii]/Hβ)—for the SDSS galaxies that have [O iii], Hβ, [N ii], and Hα with S/N > 5. The dashed curve shows the Kauffmann et al. (2003) empirical division between star-forming galaxies and AGNs. The dotted curve shows the Kewley et al. (2001) theoretical division. As discussed in the text, we represent the SDSS data using a combination of a two-dimensional histogram and plotted points. BPT-SF are shown in blue, BPT-comp in gray, and BPT-AGN in red.
Download figure:
Standard image High-resolution imageWe find that 69% of our SDSS BPT sample lie below the Kauffmann et al. (2003) division, in the BPT-SF regime, 11% lie above the Kewley et al. (2001) division, in the BPT-AGN regime, and 20% lie in between the two divisions, in the BPT-comp regime. If instead we apply the BPT diagnostic to our SDSS TBT sample (i.e., SDSS galaxies that have [O iii], Hβ, [N ii], Hα, [Ne iii], and [O ii] fluxes with S/N > 5), we find that 60% are BPT-SF, 32% are BPT-AGN, and 8% are BPT-comp.
The BPT diagram can only be used to identify AGNs out to z = 0.5, the redshift at which [N ii] leaves the optical spectral window. The ratio of [Ne iii] to [O ii] is a good candidate for pushing optical narrow emission-line ratio diagnostics to higher redshifts because both lines are relatively strong, lie in the blue end of the spectrum (measurable in optical spectra out to z < 1.4), and are close in wavelength (thus avoiding reddening effect issues). Furthermore, [Ne iii] has a significantly higher ionization potential (40.96 eV) than [O ii] (13.61 eV). As a result, the [Ne iii]/[O ii] ratio is higher in AGNs than in star-forming galaxies. We also note that the ionization potential for [Ne iii] is significantly higher than for [O iii], whose ionization potential is 35.12 eV. In Section 7, we discuss how AGN selection using an [Ne iii]-based diagnostic may be more discerning than one based on [O iii] as a result of this higher ionization potential (requiring a harder ionizing flux).
In Figure 3(a), we plot our TBT diagnostic—0.0(g − z) color versus log ([Ne iii]/[O ii])—for our SDSS TBT sample, color-coded according to the BPT classifications in Figure 2. The top, middle, and bottom panels show the locations of the BPT-AGN, BPT-comp, and BPT-SF, respectively. The darkest contours correspond to 71 sources, 16 sources, and 68 sources for the BPT-AGN, BPT-comp, and BPT-SF, respectively. The BPT-SF show a trend with color in that the bluer BPT-SF exhibit higher values of [Ne iii]/[O ii]. This provides a separation in color space between the BPT-AGN and the BPT-SF with high values of [Ne iii]/[O ii]. This trend with color is likely due to the fact that bluer galaxies are more metal poor (see Figure 7 in Tremonti et al. 2004) and hence have harder stellar radiation fields (higher [Ne iii]/[O ii]; Shi et al. 2007). On the other hand, few BPT-AGN reside in very blue galaxies. As discussed in detail in Section 3.3 of Yan et al. (2011), nearly all BPT-AGN are found in red galaxies or in galaxies with intermediate colors between red and blue.

Figure 3. (a) TBT diagram—0.0(g − z) color vs. log ([Ne iii]/[O ii])—for the SDSS galaxies that have [O iii], Hβ, [N ii], Hα, [Ne iii], and [O ii] fluxes with S/N >5. The top, middle, and bottom panels show the positions of the BPT-AGN, BPT-comp, and BPT-SF, respectively. The dashed line provides the empirical separation maximizing the fraction of BPT-AGN to total population in the upper right of the diagram (see Equation (1)). (b) Same as panel (a) but for SDSS galaxies that have [O iii], Hβ, [N ii], Hα, and [O ii] with S/N >5, but [Ne iii] has S/N < 5. For the 15% with [Ne iii] ⩽ 0, we set [Ne iii] equal to the 1σ error.
Download figure:
Standard image High-resolution imageThe dashed line designates

our empirical separation maximizing the fraction of BPT-AGN to total population in the upper right of the diagram. Hereafter, we refer to the sources in the upper right (lower left) of our TBT diagnostic as TBT-AGN (TBT-SF).
We find that 98.7% of the BPT-AGN lie in the TBT-AGN regime and 97.2% of the BPT-SF lie in the TBT-SF regime. Likewise, we find that only 3.5% of the sources in the TBT-AGN regime are BPT-SF and 1% of the sources in the TBT-SF regime are BPT-AGN. The BPT-comp lie on either side of the division, with 68.6% in the TBT-AGN regime. Overall, the BPT-comp constitute 5% and 16% of the TBT-SF and TBT-AGN, respectively.
There are 200,712 galaxies in our SDSS BPT sample that have [O ii] with S/N >5 but [Ne iii] with S/N < 5. In Figure 3(b), we show the TBT diagram for these sources. For the 15% with [Ne iii] ⩽0, we set [Ne iii] equal to the 1σ error. The darkest contours correspond to 94 sources, 170 sources, and 546 sources for the BPT-AGN, BPT-comp, and BPT-SF, respectively. We find that ∼85% of the BPT-SF lie within the TBT-SF regime, ∼86% of the BPT-AGN lie within the TBT-AGN regime, and ∼62% of the BPT-comp lie within the TBT-AGN regime. The trends follow those for our SDSS TBT sample. The 8% of SDSS BPT galaxies for which neither [O ii] nor [Ne iii] has S/N >5 and the <1% of SDSS BPT galaxies for which [Ne iii] has S/N >5 but [O ii] has S/N <5 are not considered here.
We have trained our TBT diagnostic on the SDSS galaxies, which have 〈z〉 ∼ 0.1. Because our TBT diagnostic can be used with optical spectra out to z = 1.4, we examine the impact of metallicity evolution with redshift on our empirical separation between TBT-AGN and TBT-SF. Galaxy metallicities decrease by a factor of ∼0.3 dex between the local value and the value at z ∼ 2 (Erb et al. 2006; see also Cowie & Barger 2008; Kewley & Ellison 2008; Zahid et al. 2011). For an Mstar = 1010 M☉ galaxy, this corresponds to a shift from 12 + log (O/H) = 8.6 to 8.3 (note that more massive galaxies undergo less metallicity evolution). Using the Shi et al. (2007) relation between metallicity and log ([Ne iii]/[O ii]), we find that, in this case, log ([Ne iii]/[O ii]) shifts by only ∼20%, from −0.89 to −0.72. Applying this 20% increase in the ratio of [Ne iii] to [O ii] to all SDSS BPT-SF, we find that an additional 5% move to the TBT-AGN regime. This corresponds to an increase of only 5.5% in the number of TBT-AGN that are BPT-SF. Similarly, there is only a 1.8% increase in the number of TBT-AGN that are BPT-comp. Because the impact is relatively small, in this paper we do not consider any metallicity evolution with redshift in our empirical separation between TBT-SF and TBT-AGN.
We also considered the impact of color evolution on our TBT diagnostic. At higher redshifts, galaxies are bluer as a result of higher specific SFRs. Purely passive evolution models (Bruzual & Charlot 2003) with an instantaneous burst and a Chabrier (2003) initial mass function predict a Δ0.0(g − z) ∼ 0.24 between z = 0 and 1.4, for a formation redshift of 5. Applying this color evolution to all SDSS BPT-SF, the impact is in our favor. The BPT-SF move down the y-axis in our TBT diagnostic to lie even further below our empirical separation, in the TBT-SF regime. Applying this color evolution to all SDSS BPT-AGN, we find that an additional 3.6% move to the TBT-SF regime. This corresponds to an increase of 2.7% in the number of TBT-SF that are BPT-AGN. Similarly, there is only a 2.9% increase in the number of TBT-SF that are BPT-comp. Because the impact is small, in this paper we do not consider any color evolution with redshift in our empirical separation between TBT-SF and TBT-AGN.
4. COMPARING THE TBT DIAGNOSTIC WITH AN X-RAY SELECTION OF AGNs
In Trouille & Barger (2010), we found that only a little over half (52%) of the X-ray-selected non-BLAGNs in our OPTX sample lie in the BPT-AGN regime of the BPT diagram. These sources form a sequence similar to that of the BPT-AGN, emerging from the H ii region sequence and extending to the upper-right-hand side of the BPT diagram.
Of the X-ray-selected non-BLAGNs in our OPTX sample, 20% are misidentified as BPT-SF, i.e., as pure star-forming galaxies (Trouille & Barger 2010; see also Winter et al. 2010 for evidence of this in the Swift BAT sample). Increased extinction does not account for these. Instead, in Trouille & Barger (2010) we note that these misidentified sources have lower ![$L_{\scriptsize \mbox{[O\,{\sc iii}]}}/L_X$](https://content.cld.iop.org/journals/0004-637X/742/1/46/revision1/apj408594ieqn1.gif) ratios than those that lie in the BPT-AGN regime. We postulate that the low forbidden emission-line strengths in the misidentified sources are a result of the complexity of the structure of the narrow-line region, which causes ionizing photons from the central engine to not be absorbed.
ratios than those that lie in the BPT-AGN regime. We postulate that the low forbidden emission-line strengths in the misidentified sources are a result of the complexity of the structure of the narrow-line region, which causes ionizing photons from the central engine to not be absorbed.
The misidentification of X-ray-selected AGNs as star-forming galaxies is a potential issue for all optical emission-line diagnostic diagrams, including our TBT diagram. In Figure 4(a), we plot the TBT diagram—0.0(g − z) color versus log ([Ne iii]/[O ii])—for the 0.3 < z < 1.4 X-ray-selected non-BLAGNs in our OPTX sample that have [Ne iii] and [O ii] with S/N >5. We find that 97% (100/103) of our X-ray-selected AGNs lie in the TBT-AGN regime. Thus, the TBT diagnostic does a much better job of correctly identifying X-ray-selected AGNs than the BPT diagnostic, misidentifying only 3% as TBT-SF compared to the BPT diagnostic's misidentification of 20% as BPT-SF.

Figure 4. (a) TBT diagram—0.0(g − z) color vs. log ([Ne iii]/[O ii])—for the X-ray-selected non-BLAGNs in our OPTX sample with 0.3 < z < 1.4 for which the [Ne iii] and [O ii] fluxes have an S/N >5. Small black triangles: non-BLAGNs with 1042 < LX < 1044 erg s−1. Large black triangles: non-BLAGNs with LX > 1044 erg s−1. The dashed line provides the empirical separation maximizing the fraction of BPT-AGN to total population in the upper right of the diagram (see Figure 3 and Equation (1)). (b) Same as panel (a) but for the OPTX X-ray-selected non-BLAGNS for which [O ii] has an S/N >5 but [Ne iii] has an S/N <5. For the 6% with [Ne iii] ⩽0, we set [Ne iii] equal to the 1σ error.
Download figure:
Standard image High-resolution imageAs mentioned in Section 2.2, there are 94 0.3 < z < 1.4 OPTX non-BLAGNs that do not fulfill the criteria of having both [Ne iii] and [O ii] with S/N >5. Sixteen of these have neither [O ii] nor [Ne iii] with an S/N >5. In Figure 4(b), we show the remaining 78 OPTX X-ray-selected non-BLAGNs for which [O ii] has an S/N >5 but [Ne iii] has an S/N <5. No sources have only [Ne iii] with an S/N >5. We find that 92% (72/78) lie in the TBT-AGN regime. This supports our results for the OPTX sources in which both [Ne iii] and [O ii] have an S/N >5.
5. VERIFICATION OF THE TBT DIAGNOSTIC: STACKING ANALYSES
The GOODS-N sample of spectroscopically observed galaxies with deep Chandra and Spitzer imaging out to z = 1.4 provides an ideal pilot for confirming the dominance of AGN activity in the TBT-AGN and star formation activity in the TBT-SF.
Figure 5 shows our TBT diagnostic for the 642 0.3 < z ⩽ 1.4 GOODS-N sources for which the [Ne iii] and [O ii] fluxes have an S/N >5. We have excluded sources with broadened emission lines (FWHM >2000 km s−1) from this analysis. The dashed line indicates our empirical division between the TBT-AGN and TBT-SF (see Figure 3 and Equation (1)). We find that 189 GOODS-N sources lie in the TBT-AGN regime, corresponding to a space density of 4.6 × 10⁻⁵ Mpc−3 optically selected GOODS-N TBT-AGN.
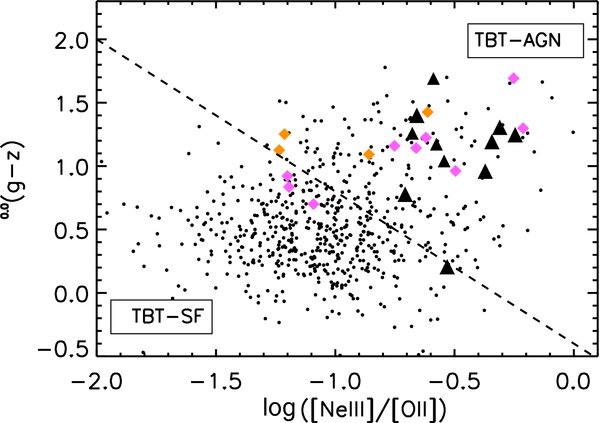
Figure 5. TBT diagram—0.0(g − z) color vs. log ([Ne iii]/[O ii])—for the GOODS-N 0.3 < z < 1.4 sources for which the [Ne iii] and [O ii] fluxes have an S/N >5. Large black triangles: non-BLAGNs cross-listed in the Chandra catalog with LX > 1042 erg s−1. Orange diamonds: non-BLAGNs cross-listed in the Chandra catalog, but with LX < 1042 erg s−1. These sources are significantly detected in both the 0.5–2 keV band and 2–8 keV band. Magenta diamonds: non-BLAGNs cross-listed in the Chandra catalog, but with LX < 1042 erg s−1. These sources are significantly detected in the 0.5–2 keV band but not in the 2–8 keV band. Black circles: remaining sources. The dashed line provides the empirical separation maximizing the fraction of BPT-AGN to total population in the upper right of the diagram (see Figure 3 and Equation (1)).
Download figure:
Standard image High-resolution imageThere are 11 GOODS-N sources in our TBT diagram that are cross-listed as non-BLAGNs in the CDFN catalog with LX > 1042 erg s−1 (black triangles). As discussed in Section 4, our TBT diagnostic has a much lower rate of misidentifying X-ray-selected AGNs as star-forming galaxies than the BPT diagnostic (∼3% versus 20%). We use our OPTX X-ray-selected sample of AGNs for that analysis. Since the GOODS-N field lies within the CDFN, one of our OPTX fields, it is no surprise that only one of the LX > 1042 erg s−1 non-BLAGNs (black triangles) in Figure 5 is misidentified as a TBT-SF.
In the following section, we perform X-ray and IR stacking analyses in order to investigate whether the remaining LX < 1042 erg s−1 TBT-AGN harbor obscured AGN activity, verifying the validity of our TBT-AGN selection. We also perform stacking analyses of our TBT-SF in order to verify the dominance of star formation activity in these sources. The effective X-ray spectral slope (Γeff; derived from the ratio of the 2–8 keV band to the 0.5–2 keV band) is indicative of different source types. Unobscured AGNs exhibit Γeff ⩾ 1.7. In obscured AGNs, photoelectric absorption of X-ray soft photons by neutral gas along the line of sight causes a flattening of the slope, such that Γeff < 1.7 (although see Trouille et al. 2009 for a discussion of discrepancies between X-ray and optical spectral type). At the same time, X-ray binaries exhibit a range in X-ray spectral slopes. LMXBs, which are associated with old stellar populations, tend to be softer in X-rays, with Γ > 1.7. HMXBs, which are associated with ongoing star formation, tend to be harder in X-rays, with Γ = 0.5–1 (Colbert et al. 2004). See Fabbiano (2006) and Remillard & McClintock (2006) for detailed reviews of X-ray binary populations. In order to distinguish between these scenarios, we perform an IR stacking analysis in Section 5.2.
We restrict our analysis to lower-redshift sources (z < 0.7) in order to not be misled by the automatic softening of the effective X-ray spectral slope as one observes to higher redshifts (i.e., as the redshift increases, the 0.5–2 keV and 2–8 keV bands are sampling higher energies whose photons can more easily penetrate obscuring material).
5.1. X-Ray Stacking
Quantitatively, if stacking a sample of "n" objects yields "Ns" counts in a signal aperture of area "As" and "Nb" smoothed background counts in that same area "As," then the mean number of source counts per object in the signal region is

We obtain an estimate of the mean spectral slope of the detected signal by performing the stacking in two energy bands, soft (0.5–2 keV) and hard (2–8 keV), and deriving an effective power-law photon index, 〈Γeff〉.
Here, we use the STACKFAST X-ray stacking program (Hickox et al. 2007). In STACKFAST, "As" is defined as the area enclosed within r90 from the source position, where r90 is an approximation of the 90% point-spread function (PSF) energy encircled radius at 1.5 keV, and varies as7

with θ equal to the off-axis angle. In order to maximize the number of source counts, rather than limiting the stacking to only the central 6' as in Hickox et al. (2007), we use the central 10' around the pointing center for each observation.
A few bright sources would dominate our estimate of the mean spectral shape, so we exclude from our analysis sources that lie close to or are associated with a known X-ray-detected source, hereafter called coincidental contaminants (see also Hickox et al. 2007; Georgantopoulos et al. 2008; Fiore et al. 2008). To this end, we first applied a mask to all known X-ray-detected source positions. We used 3 × r90 (see Equation (3)) as the mask aperture radius.
We cross-reference the "As" for our sources of interest with the X-ray photon locations from each Chandra pointing (i.e., each ObsID event file). We then create smoothed 0.5–2 keV and 2–8 keV background maps using the CIAO WAVDETECT task and determine the background counts within the same "As." Subtracting this background and dividing by the number of sources being stacked, we obtain the average X-ray signal in counts per source. We create exposure maps using custom routines (A. Vikhlinin 2007, private communication) and determine the total exposure time for each source being stacked. Dividing the total counts in the stacked source by the total exposure time, we derive the average count rate (counts per second) for the stacked source. We use the ratio of the 2–8 keV count rate to the 0.5–2 keV count rate to derive 〈Γeff〉.
Count uncertainties are calculated using the approximation  , where X is the number of counts in a given band (Gehrels 1986). We set a significance threshold of 3σ. Uncertainties in the hardness ratio and 〈Γeff〉 are derived by propagating these count rate errors.
Table 1 shows the results from our stacking analysis for the GOODS-N TBT-SF and TBT-AGN. Column 2 lists the total number of sources in each of these categories. Column 3 provides the total number of sources used in the stacking analysis, after excluding individually X-ray-detected sources and coincidental contaminants. Columns 4 and 5 state fluxes and detection significance for the given X-ray band. We consider that stacked sources with <3σ detection are not significantly detected. Column 6 provides the 〈Γeff〉 value for the stacked source. In Column 7, we list the volume-weighted redshift for the stacked source and in Column 8 we list the derived 2–8 keV luminosity based on the f2–8 keV and the volume-weighted redshift.
Table 1. TBT X-ray Stacking Analysis Results
| Category | Total No. | No. used in Stack | f0.5–2 keVa | f2–8 keVa | 〈Γeff〉 | zb | log L2–8 keV |
|---|---|---|---|---|---|---|---|
| (erg s−1) | |||||||
| (1) | (2) | (3) | (4) | (5) | (6) | (7) | (8) |
| TBT-SFc | 155 | 148 | 0.62 ± 0.13 (4.7σ) | 2.50 ± 1.1 (2.2σ) | 1.5+0.7−0.4d | 0.58 | 40.53d |
| TBT-AGNc | 72 | 54 | 1.13 ± 0.2 (5.4σ) | 5.87 ± 1.4 (4σ) | 1.0+0.3−0.3 | 0.58 | 40.86 |
Notes. aIn units of 10−17 erg cm−2 s−1. bVolume-weighted redshift for the stacked source. cOnly including sources with z < 0.7. dWe caution that this is based on a low-significance 2–8 keV signal.
Download table as: ASCIITypeset image
We provide specifics for each category in the following subsections.
5.1.1. TBT-SF
There are 155 z < 0.7 GOODS-N TBT-SF. As discussed above, we restrict our analysis to these lower redshifts in order to not be misled by the automatic softening of the effective X-ray spectral slope as one observes to higher redshift. Only one of these z < 0.7 GOODS-N TBT-SF is directly X-ray detected, and then only in the 0.5–2 keV band. Using the 2–8 keV flux limit for the CDFN image (see Table 2), we determine an upper limit to its hardness ratio and find that it is X-ray soft, with Γ > 1.7.
Table 2. Flux Limits
| Chandra 2–8 keV Image | Flux Limit |
|---|---|
| (erg cm−2 s−1) | |
| CDFN | 1.5 × 10⁻¹⁶ |
| CLANS | 3.5 × 10⁻¹⁵ |
| CLASXS | 3.5 × 10⁻¹⁵ |
| Spitzer 24 μm image | Flux limit (μJy) |
| GOODS-N | 75 |
| LHa | 150 |
Note. aIncludes both the CLANS and CLASXS fields.
Download table as: ASCIITypeset image
After excluding this known X-ray source, as well as coincidental contaminants, we use the STACKFAST program to determine the average X-ray signal in the remaining 148 TBT-SF. The stacked source is significantly detected in the 0.5–2 keV band (4.7σ) but not in the 2–8 keV band (2.2σ). We find a 〈Γeff〉 = 1.5+0.7−0.4, although we caution that this is based on a low-significance 2–8 keV signal. Given the large uncertainties, the stacked source could be X-ray soft (Γ > 1.7).
5.1.2. TBT-AGN
There are 72 z < 0.7 GOODS-N TBT-AGN. Six are directly X-ray detected in both the 0.5–2 keV and 2–8 keV bands. Three of these are obvious X-ray-selected AGNs with LX > 1042 erg s−1. The three remaining X-ray-detected sources have LX < 1042 erg s−1. All three are X-ray hard, with Γ < 1.4.
After excluding these known X-ray sources, as well as coincidental contaminants, we use the STACKFAST program to determine the average X-ray signal in the remaining 54 TBT-AGN. The stacked source is significantly detected in both bands (5.4σ in the 0.5–2 keV band and 4.0σ in the 2–8 keV band). We find a 〈Γeff〉 = 1.0+0.3−0.3, consistent with being X-ray hard (Γ < 1.4).
5.1.3. Monte Carlo Simulation
We carried out a series of Monte Carlo (MC) stacking simulations to assess false-detection probabilities empirically. For each category, we performed 1000 trials and used the same number of stacked sources and the same procedure as in the original stacking, albeit with random R.A. and decl. positions.
In Section 5.1.1, we found that the TBT-SF are significantly detected in the 0.5–2 keV band but not in the 2–8 keV band. In Section 5.1.2, we found that the TBT-AGN are significantly detected in both the 0.5–2 keV and 2–8 keV bands.
Our MC simulations yield a 0.1% probability of generating the observed 0.5–2 keV flux for our stacked TBT-SF source and a 52% probability of generating the observed 2–8 keV flux. Our MC analysis confirms that the TBT-SF clearly have an excess of 0.5–2 keV counts, well above those we obtain randomly. The 2–8 keV signal is within the noise. Thus, the observed X-ray softness in our TBT-SF appears to be a reliable result.
Our MC simulations for the TBT-AGN yield a 0% probability that we would see the observed 0.5–2 keV flux or the observed 2–8 keV flux. Our MC analysis confirms we are recovering a real signal in both bands. None of our MC simulations for the TBT-AGN result in both the 0.5–2 keV and 2–8 keV bands detected at a 3σ level or greater. In other words, there is a ∼0% false-alarm rate for our stacked TBT-AGN signal. Thus, the observed X-ray hardness in our TBT-AGN appears to be a reliable result.
5.2. IR Stacking
In Section 5.1, we derived the average X-ray properties for the GOODS-N TBT-SF and TBT-AGN using an X-ray stacking analysis. The stacked TBT-AGN source was significantly detected in both the 0.5–2 keV and 2–8 keV bands and was quite X-ray hard, with 〈Γeff〉 = 1.0+0.3−0.3. This X-ray hard signal could be due either to AGN activity with obscuration or HMXBs associated with ongoing star formation.
Numerous studies have found that in star-forming galaxies without an AGN, the total X-ray luminosity correlates with the SFR (Nandra et al. 2002; Bauer et al. 2002; Ranalli et al. 2003; Grimm et al. 2003; Colbert et al. 2004; Persic et al. 2004; Hornschemeier et al. 2005; Persic & Rephaeli 2007; Rovilos et al. 2009). Furthermore, David et al. (1992) found a linear relation between the far-infrared (FIR) luminosity and the 0.5–4.5 keV luminosities for a sample of starburst galaxies observed by Einstein (see also Fabbiano & Shapley 2002). Ranalli et al. (2003) extended this study to the 2–10 keV band using the ASCA and BeppoSAX satellites. Persic et al. (2004) determined the relation between the X-ray and FIR luminosities for both the full contribution from star formation activity and for HMXBs alone. A number of groups have shown that AGNs and AGN–starburst composite galaxies lie above these relations (Ptak et al. 2003; Alexander et al. 2005; Teng et al. 2005; Georgakakis et al. 2007). The additional X-ray luminosity is attributed to AGN activity in these galaxies.
Following these previous studies, here we use the IR properties of our TBT-AGN to determine whether the X-ray hard signal is due to AGN activity with obscuration or HMXBs. We also check whether the X-ray soft signal in our TBT-SF is consistent with pure star-forming galaxies. In Trouille et al. (2009), we determined the Spitzer 24 μm fluxes and luminosities for our OPTX X-ray-selected AGNs. We follow the same procedure here to determine f24 μm and L24 μm for our GOODS-N galaxies.
To determine f24 μm for our stacked TBT-AGN and stacked TBT-SF, we use the publicly available IAS Stacking Library IDL software (Bethermin et al. 2010). The IAS Stacking software uses a DAOPHOT-type photometry IDL procedure, APER, with a preset PSF for the Spitzer 24 μm band (13'' for the object aperture and sky radii of 20''–32''). A median stacking is preferable to mean stacking because the median analysis is more stable and robust to small numbers of bright sources. Using the volume-weighted redshift for our stacked source, we transform f24 μm into L24 μm. We then use the Rieke et al. (2009) Equation (A6) to transform L24 μm into the total infrared luminosity, LTIR.
The IAS Stacking software provides the 1σ standard deviation on the stacked flux. However, given that the Spitzer image resolution is low, we need to consider the likelihood of misidentifications and overlap. To assess how well this 1σ standard deviation reflects the contamination from spurious signals, we carry out a series of MC stacking. We perform 1000 trials and use the same number of stacked sources and follow the same procedure as in the original stacking. The only difference is that we use random R.A. and decl. positions. For both our stacked TBT-AGN and our stacked TBT-SF, >99% of our simulations result in stacked fluxes less than our 1σ error. While <10% of the random R.A., decl. positions in each simulation do overlap with real 24 μm sources (as expected given the low image resolution), because we use a median stacking, these spuriously high fluxes are excluded from the stacked signal.
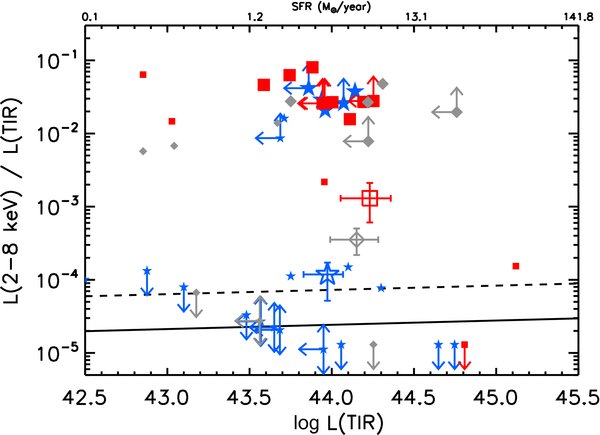
In Figure 6, we plot the ratio of the X-ray to total IR luminosities, LX/LTIR, versus LTIR for our TBT categories. The top axis shows the associated SFR for a given LTIR, following Rieke et al. (2009). The solid line shows the expected ratio derived by Persic et al. (2004) for the HMXB population in a galaxy with the given SFR. The dashed line shows the Mineo et al. (2011) expected ratio for all star formation activity in a galaxy with the given SFR. The stacked TBT-SF (blue open star) was significantly detected in the 0.5–2 keV band (4.7σ) but not in the 2–8 keV band (2.2σ). Nonetheless, we use the derived LX from the stacking analysis (see Table 1) and determine the 1σ error on LX/LTIR by propagating the errors on both the stacked X-ray and IR signal. The stacked TBT-SF LX/LTIR is consistent with that expected for pure star-forming galaxies. This corroborates what we find for the one individually X-ray-detected TBT-SF (blue filled star). Since this source is undetected in both the Spitzer 24 μm image and the CDFN 2–8 keV image, we assign it the flux limits for these images (see Table 2) and use the arrows to designate it as corresponding to upper limits. Given these uncertainties, its LX/LTIR is not inconsistent with pure star-forming galaxies.

Figure 6. L2–8 keV/LTIR vs. log LTIR for our 0.3 < z < 0.7 GOODS-N galaxies that have [Ne iii] and [O ii] fluxes with S/N >5. Red filled squares: directly X-ray-detected TBT-AGN. Large (small) symbols indicate sources with LX > 1042 erg s−1 (LX < 1042 erg s−1). Blue filled star: directly X-ray-detected TBT-SF. The downward pointing arrow indicates that the source is undetected in the 2–8 keV band and is assigned the 2–8 keV flux limit (see Table 2). The upward and leftward pointing arrows indicate that the source is undetected in the Spitzer 24 μm image and is assigned the 24 μm flux limit (see Table 2). Red open square: stacked TBT-AGN, excluding directly X-ray-detected sources. Blue open star: stacked TBT-SF, excluding directly X-ray-detected sources. Solid line: expected ratio for the HMXB population in a galaxy with the given SFR (see top axis), according to Persic et al. (2004); dashed line: expected ratio for the overall star formation occurring in a galaxy with the given SFR, according to Mineo et al. (2011).
Download figure:
Standard image High-resolution imageThe three X-ray-detected TBT-AGN with LX > 1042 erg s−1 (large red filled squares) and the three X-ray-detected TBT-AGN with LX < 1042 erg s−1 (small red filled squares) lie clearly above the expected range for LX/LTIR for pure star-forming galaxies. The stacked TBT-AGN (red open square) also lies well above this range. We determine the 1σ error on LX/LTIR for the stacked source by propagating the errors on both the stacked X-ray and IR signal. We find that the stacked TBT-AGN lies >3σ above the expected range for LX/LTIR for pure star-forming galaxies, supporting our hypothesis that, on average, TBT-AGN harbor AGN activity.
6. BPT DIAGNOSTIC: STACKING ANALYSES
In Section 3, we found that the majority of the SDSS BPT-comp lie within the TBT-AGN regime. Here, our primary goal is to do X-ray and IR stacking analyses to investigate whether the BPT-comp signal, on average, is dominated by AGN or star formation activity.
Since the BPT diagram is restricted to sources with z < 0.5, there are too few GOODS-N BPT-comp for a robust stacking analysis (specifically, there are only 22 GOODS-N BPT-comp). To increase our numbers, here we also include the LH galaxy sample. Figure 7 shows the BPT diagram for the 727 z < 0.5 GOODS-N/LH galaxies that have [O iii], Hβ, [N ii], and Hα fluxes with S/N >5. We have excluded sources with broadened emission lines (FWHM > 2000 km s−1) from this analysis.

Figure 7. (a) BPT diagram for the GOODS-N/LH z < 0.5 sources that have [O iii], Hβ, [N ii], and Hα fluxes with S/N >5. Large black triangles: non-BLAGNs cross-listed in the Chandra catalog with LX > 1042 erg s−1. Orange diamonds: non-BLAGNs cross-listed in the Chandra catalog, but with LX < 1042 erg s−1. These sources are significantly detected in both the 0.5–2 keV band and 2–8 keV bands. Magenta diamonds: non-BLAGNs cross-listed in the Chandra catalog, but with LX < 1042 erg s−1. These sources are significantly detected in the 0.5–2 keV band but not the 2–8 keV band. Black circles: remaining sources. The dashed curve shows the Kauffmann et al. (2003) empirical division between star-forming galaxies and AGNs. The dotted curve shows the Kewley et al. (2001) theoretical division.
Download figure:
Standard image High-resolution imageAs discussed in Section 4, the BPT diagnostic does not match 100% with an X-ray selection of AGNs. In Figure 7, we see that 50% (9/18) of the X-ray-selected non-BLAGNs with LX > 1042 erg s−1 (black triangles) are BPT-AGN, 28% (5/18) are BPT-comp, and 22% (4/18) are BPT-SF.
In the following sections, we do stacking analyses to verify that the remaining LX < 1042 erg s−1 BPT-AGN and BPT-SF are, on average, AGN-dominated and SF-dominated, respectively. Having tested our stacking analyses on these more secure BPT categories, we apply them to our BPT-comp.
6.1. X-Ray Stacking
Table 3 provides the results from our X-ray stacking analysis for the GOODS-N/LH BPT-SF, BPT-AGN, and BPT-comp. We followed the same procedure as in Section 5.1. We provide specifics for each category in the following subsections.
Table 3. BPT X-ray Stacking Analysis Results
| Category | Total No. | No. used in Stack | f0.5–2 keVa | f2–8 keVa | 〈Γeff〉 | zb | log L2–8 keV |
|---|---|---|---|---|---|---|---|
| (erg s−1) | |||||||
| (1) | (2) | (3) | (4) | (5) | (6) | (7) | (8) |
| BPT-SF | 605 | 448 | 0.66 ± 0.12 (5.5σ) | 2.82 ± 1.23 (2.3σ) | 1.5+0.7−0.3c | 0.41 | 40.20c |
| BPT-AGNd | 31 | 17 | 5.39 ± 3.37 (1.6σ) | 39.4 ± 22.9 (1.8σ) | 0.72+1.5−0.2e | 0.41 | 41.35c |
| BPT-comp | 91 | 76 | 1.71 ± 0.33 (5.2σ) | 8.92 ± 2.23 (4.0σ) | 1.0+0.4−0.4 | 0.41 | 40.70 |
Notes. aIn units of 10−17 erg cm−2 s−1. bVolume-weighted redshift for the stacked source. cWe caution that this is based on a low-significance 2–8 keV signal. dThree out of four GOODS-N BPT-AGN and 11 out of 27 LH BPT-AGN are directly detected in their respective Chandra image. Stacking the remaining 17 GOODS-N/LH X-ray-undetected BPT-AGN provides poor statistics for the stacking analysis. eWe caution that this is based on a low-significance 0.5–2 keV and 2–8 keV signal.
Download table as: ASCIITypeset image
6.1.1. BPT-SF
There are 605 GOODS-N/LH BPT-SF. Twenty-one are directly X-ray detected. Four of these are obvious X-ray-selected AGNs with LX > 1042 erg s−1. Of the 17 X-ray-detected sources with LX < 1042 erg s−1, 10 are only detected in the 0.5–2 keV band. Using the 2–8 keV flux limit for their Chandra image (see Table 2), we determine an upper limit to their hardness ratios and find that all 10 are X-ray soft, with Γ > 1.7. Of the seven remaining sources that are detected in both bands, three are X-ray soft, with Γ > 1.7. Therefore, the majority (13/17) of the X-ray detected, LX < 1042 erg s−1 sources are X-ray soft, with Γ > 1.7.
After excluding these known X-ray sources, as well as coincidental contaminants, we use the STACKFAST program to determine the average X-ray signal in the remaining 448 BPT-SF. The stacked source is significantly detected in the 0.5–2 keV band (5.5σ) but not in the 2–8 keV band (2.3σ). We find a 〈Γ〉 = 1.5+0.7−0.3, although we caution that this is based on a low-significance 2–8 keV signal. Given the large uncertainties, the stacked source could be X-ray soft (Γ > 1.7).
Our MC simulations (see Section 5.1.3 for details of the procedure) yield a 2% probability of randomly generating the observed 0.5–2 keV flux for our stacked BPT-SF and a 96% probability of generating the observed 2–8 keV flux. Our MC analysis confirms that these BPT-SF clearly have an excess of 0.5–2 keV counts, well above those we obtain randomly. The 2–8 keV signal is within the noise.
6.1.2. BPT-AGN
There are 31 GOODS-N/LH BPT-AGN. Fourteen are directly X-ray detected. Nine of these are obvious X-ray-selected AGNs with LX > 1042 erg s−1. Of the five X-ray-detected sources with LX < 1042 erg s−1, one is only detected in the 0.5–2 keV band. Using the 2–8 keV flux limit for its Chandra image (see Table 2), we determine an upper limit to its hardness ratio and find that it is X-ray soft, with Γ > 1.7. The four remaining sources that are detected in both bands are X-ray hard, with Γ < 1.4.
After excluding these known X-ray sources, as well as coincidental contaminants, we use the STACKFAST program to determine the average X-ray signal in the remaining 17 BPT-AGN. Given the small number of sources in this stacking analysis, it is not surprising that the stacked source is neither significantly detected in the 0.5–2 keV band (1.6σ) nor in the 2–8 keV band (1.8σ). We find a 〈Γ〉 = 0.72+1.5−0.2, although we caution that this is based on a low-significance 0.5–2 keV and 2–8 keV signal. Given the large uncertainties, this stacked source could be X-ray hard (Γ < 1.4).
Our MC simulations (see Section 5.1.3 for details of the procedure) yield a ∼98% probability of randomly generating the observed 0.5–2 keV and 2–8 keV fluxes. Our MC analysis confirms that the 0.5–2 keV and 2–8 keV signals are within the noise.
6.1.3. BPT-comp
There are 91 GOODS-N/LH BPT-comp. Eleven are directly X-ray detected. Five of these are obvious X-ray-selected AGNs with LX > 1042 erg s−1. Of the six X-ray-detected sources with LX < 1042 erg s−1, three are only detected in the 0.5–2 keV band. Using the 2–8 keV flux limit for their Chandra image (see Table 2), we determine an upper limit to their hardness ratios and find that all three are X-ray soft, with Γ > 1.7. The remaining three sources are detected in both bands and are X-ray hard, with Γ < 1.4.
After excluding known X-ray sources, as well as coincidental contaminants, we use the STACKFAST program to determine the average X-ray signal in the remaining 76 BPT-comp. The stacked source is significantly detected in both bands (5.2σ in the 0.5–2 keV band and 4.0σ in the 2–8 keV band). We find a 〈Γeff〉 = 1.0+0.4−0.4, i.e., the source is X-ray hard.
Our MC simulations for the BPT-comp yield a 5% probability that we would see the observed 0.5–2 keV flux and a 2% probability we would see the observed 2–8 keV flux, confirming that we are recovering a real signal in both bands. Fewer than 1% of our MC simulations for the BPT-comp result in both the 0.5–2 keV and 2–8 keV bands detected at a 3σ level or greater. In other words, there is a <1% false-alarm rate for our stacked BPT-comp signal. Thus, the observed X-ray hardness in our BPT-comp appears to be a reliable result.
6.2. IR Stacking
As discussed in Section 5.2, the X-ray hard signal in our stacked BPT-comp could be due either to HMXBs or to AGN activity with obscuration. We follow the same procedure as in Section 5.2 to distinguish between these scenarios using the IR. We determine the 1σ error on LX/LTIR for the stacked BPT-comp (gray open diamond) by propagating the errors on both the stacked X-ray and IR signal. Figure 8 shows that the stacked BPT-comp lies >3σ above the expected range for LX/LTIR for pure star-forming galaxies (dashed line). This corroborates what we find for the individually X-ray-detected BPT-comp (gray filled diamonds), where the majority (8/11) have LX/LTIR values well above the expected range for pure star-forming galaxies. These results support our TBT diagnostic inclusion of the bulk of BPT-comp in the TBT-AGN regime.
Figure 8. L2–8 keV/LTIR vs. log LTIR for our z < 0.5 GOODS-N/LH galaxies that have [O iii], Hβ, [N ii], and Hα fluxes with S/N >5. Red filled squares: directly X-ray-detected BPT-AGN. Blue filled stars: directly X-ray-detected BPT-SF. Gray filled diamonds: directly X-ray-detected BPT-comp. Large (small) symbols designate sources with LX > 1042 erg s−1 (LX < 1042 erg s−1). Downward pointing arrows indicate sources undetected in the 2–8 keV band (but detected in the 0.5–2 keV band) that are assigned the 2–8 keV flux limit (see Table 2). Upward and leftward pointing arrows indicate sources undetected in the Spitzer 24 μm image that are assigned the 24 μm flux limit (see Table 2). Blue open star: stacked BPT-SF, excluding directly X-ray-detected sources. Red open square: stacked BPT-AGN, excluding directly X-ray-detected sources. Gray open diamond: stacked BPT-comp, excluding directly X-ray-detected sources. Solid line: expected ratio for the HMXB population in a galaxy with the given SFR (see top axis), according to Persic et al. (2004). Dashed line: expected ratio for the overall star formation occurring in a galaxy with the given SFR, according to Mineo et al. (2011).
Download figure:
Standard image High-resolution image
We also note that all BPT-AGN, BPT-SF, and BPT-comp with LX > 1042 erg s−1 (large filled symbols) have LX/LTIR values well above the expected range for pure star-forming galaxies. This further confirms that the signal in these X-ray-selected AGNs is dominated by AGN activity. An optical classification as BPT-SF is inaccurate.
The stacked BPT-AGN (red open square in Figure 8) was not significantly detected in either the 0.5–2 keV or 2–8 keV band (1.6σ or 1.8σ, respectively). Nonetheless, we use the derived LX from the stacking analysis (see Table 3) and determine the 1σ error on LX/LTIR by propagating the errors on both the stacked X-ray and IR signal. The stacked BPT-AGN LX/LTIR lies well above the expected range for pure star-forming galaxies. This corroborates what we find for the individually X-ray-detected BPT-AGN with LX < 1042 erg s−1 (small red filled squares), where the majority (3/5) have LX/LTIR well above the expected range for pure star-forming galaxies. The two with LTIR > 1044.5 lie within the expected range for pure star-forming galaxies. These two sources are an additional example of the BPT diagnostic potentially misidentifying sources—in this case, SF-dominated sources as BPT-AGN.
The stacked BPT-SF (blue open star in Figure 8) was significantly detected in the 0.5–2 keV band (5.5σ) but not in the 2–8 keV band (2.3σ). Nonetheless, we use the derived LX from the stacking analysis (see Table 3) and determine the 1σ error on LX/LTIR by propagating the errors on both the stacked X-ray and IR signal. The stacked BPT-SF LX/LTIR is consistent with that expected for pure star-forming galaxies. This corroborates what we find for the individually X-ray-detected BPT-SF with LX < 1042 erg s−1 (small blue filled stars), where the majority (12/17) have LX/LTIR values consistent with the expected range for pure star-forming galaxies.
7. DISCUSSION—COMPARISON WITH ALTERNATIVE DIAGNOSTICS
As mentioned in the Introduction, Lamareille (2010) investigate the use of a "blue diagnostic"—[O iii]/Hβ versus [O ii]/Hβ—to classify galaxies as star-forming galaxies, AGNs, and composites. Although Lamareille (2010) separate out LINERs,8 here we include both AGNs and LINERs in the BPT-AGN category, as in the rest of our article. Since [O iii], [O ii], and Hβ lie at the blue end of the spectrum, this diagnostic can be applied to galaxies with optical spectra out to z ∼ 0.9. This method provides a successful means for creating a reliable sample of star-forming galaxies out to these redshifts. Their SF-dominated regime (SFG in their Table 1) encloses >99% of the BPT-SF. Only 1.5% of the sources in the SFG regime are BPT-AGN. The "blue diagnostic," however, is not as effective in creating a reliable AGN selection. Their combined Sy2, SF/Sy2, and LINER regimes identify ∼94% of all the BPT-AGN. However, ∼23% of the sources in this combined regime are BPT-SF.9
A classification scheme based on [Ne iii]/[O ii] (Stasińska et al. 2006; this work) complements this "blue diagnostic" by correctly classifying galaxies in the Lamareille (2010) SF/Sy2 category. Marocco et al. (2011) recently examined the location of the Lamareille (2010) SF/Sy2 galaxies in the Stasińska et al. (2006) DEW diagnostic—[Ne iii]/[O ii] versus Dn[4000]. They find that by applying an additional empirical cut in the DEW diagnostic space to these SF/Sy2 galaxies, they are able to correctly identify 99% of the BPT-SF and 97% of the Seyfert 2s. Overall, this combined diagnostic correctly identifies 85% of Seyfert 2s and 99% of BPT-SF.
Our TBT diagnostic, based on [Ne iii]/[O ii] versus rest-frame g − z color (rather than Dn[4000]), results in minimal overlap between the BPT-SF and BPT-AGN, with only ∼1.3% of the BPT-AGN lying within the TBT-SF regime and only 2.8% of BPT-SF lying within the TBT-AGN regime. Likewise, of the sources in the TBT-AGN regime, only 3.5% are BPT-SF and of the sources in the TBT-SF regime, only 1% are BPT-AGN.
The Juneau et al. (2011) MEx diagnostic—[O iii]/Hβ versus stellar mass—also complements the "blue diagnostic" in its ability to reliably identify AGNs. The MEx-AGN regime encloses 99% of BPT-AGN. Only 6% of the sources in the MEx-AGN regime are BPT-SF. Similarly, the Yan et al. (2011) CEx diagnostic—[O iii]/Hβ versus rest-frame U − B color—also complements the "blue diagnostic," with the CEx-AGN regime enclosing 95.7% of BPT-AGN. Only 1.9% of the sources in the CEx-AGN regime are BPT-SF.
An important difference between the MEx and CEx diagnostics and our TBT diagnostic is the classification of X-ray-selected AGNs. While 8% (8/101) of the Juneau et al. and 22% (30/126) of the Yan et al. X-ray-selected LX > 1042 erg s−1 AGNs lie in the MEx-SF and CEx-SF regimes of their diagnostics, respectively, only 3% (3/103) of our X-ray-selected AGNs lie within our TBT-SF regime (see Section 4). This may be a result of the higher ionization potential of the [Ne iii] line (40.96 eV) as compared with the [O iii] line (35.12 eV). The higher ionization potential appears to foster a more reliable selection of AGN-dominated galaxies, i.e., the weaker ionizing flux in star-forming galaxies lessens their ability to excite [Ne iii] as compared to [O iii].
We note that our approach does not address the issue of classifying galaxies with very low equivalent width emission lines, where some of the lines are too noisy for traditional line diagnostics to be used. See Cid Fernandes et al. (2010, 2011) for their discussion of the WHAN diagram—WHα versus [N ii]/Hα—and its ability to provide a more comprehensive emission-line classification of galaxies.
7.1. BPT-comp: AGN-dominated Sources
A critical difference between the Lamareille (2010) and CEx diagrams and our TBT diagnostic is the location of the BPT-comp (galaxies that fall between the Kauffmann et al. 2003 and Kewley et al. 2001 divisions in the BPT diagram). In the Lamareille (2010) diagram, ∼83% of BPT-comp lie within the SFG regime. In the combined Lamareille (2010) and Marocco et al. (2011) diagnostic, ∼60% of BPT-comp lie within the SFG+SFG/comp regimes. In the CEx diagram, ∼75% of BPT-comp lie within the CEx-SF regime. In our TBT diagnostic, on the other hand, 65% of the BPT-comp lie within the TBT-AGN regime, with only 35% in the TBT-SF regime. Similarly, in the MEx diagnostic (Juneau et al. 2011), only 17% of BPT-comp lie within the MEx-SF regime.
A number of optical emission-line studies have argued that the signal in BPT-comp is dominated by star formation activity, rather than AGN activity. The Kewley et al. (2001) upper boundary to the BPT-comp regime marks their theoretical prediction for galaxies whose contribution from AGN activity to the extreme-ultraviolet ionizing radiation field just begins to exceed 50%. According to this work, all sources to the lower left of this boundary have their signal dominated by star formation activity. Similarly, Stasińska et al. (2006) use spectral synthesis modeling to argue that the contribution from AGN activity to the emission-line signal in BPT-comp is 20% or less. Furthermore, Kewley et al. (2006) note that BPT-comp lie in the same parameter space as H ii regions in the [O iii]/[O ii] versus [O i]/Hα diagnostic (as well as within the SF-dominated regime of the [O iii]/Hβ versus [S ii]/Hα diagnostic). They argue that this provides further support for the idea that the ionizing radiation field and ionization parameter in BPT-comp are dominated by star formation activity.
Here, we argue that our TBT diagnostic's reliance on [Ne iii], with its higher ionization potential than [O iii], [N ii], or [S ii], leads to a more reliable identification of AGN-dominated sources. In Section 6, we tested whether the inclusion of the majority of BPT-comp in our TBT-AGN regime was justified. Of the individually X-ray-detected BPT-comp, 70% are X-ray hard with LX/LTIR ratios indicative of dominance by AGN activity (see Figure 6). The stacked signal from X-ray-undetected BPT-comp is also X-ray hard and exhibits an LX/LTIR ratio >3σ above the expected range for pure star-forming galaxies. This supports our TBT diagnostic inclusion of BPT-comp in the TBT-AGN regime and suggests that, on average, the X-ray and optical signal in BPT-comp is dominated by AGN activity.
8. SUMMARY
We have shown that the TBT diagnostic—rest-frame 0.0(g − z) color versus [Ne iii]/[O ii]—reliably separates SDSS SF-dominated sources from AGN-dominated sources, as classified according to the classic BPT diagram. Because both [Ne iii] and [O ii] are located in the blue end of the optical spectrum, we are able to classify galaxies using this diagnostic out to z = 1.4. The TBT diagnostic provides a significant extension in redshift compared to the BPT diagram (limited in its use with optical spectra to z < 0.5) and the more recent [O iii]/Hβ-based diagnostics (limited to z < 0.9—"blue diagram," Lamareille 2010, Marocco et al. 2011; CEx, Yan et al. 2011; MEx, Juneau et al. 2011).
We find that the TBT selection of AGNs matches well with an X-ray selection of AGNs, with 97% (100/103) of our OPTX X-ray-selected AGNs lying within the TBT-AGN regime. This suggests that the TBT diagnostic is more reliable than the BPT diagnostic in identifying X-ray-selected AGNs, since the BPT diagnostic misidentifies ∼20% of our OPTX X-ray-selected AGNs as BPT-SF, i.e., as star-forming galaxies. This may be a result of the higher ionization potential of the [Ne iii] line (40.96 eV) as compared with the [O iii] line (35.12 eV). The higher ionization potential appears to foster a more reliable selection of AGN-dominated galaxies, i.e., the weaker ionizing flux in star-forming galaxies lessens their ability to excite [Ne iii] as compared to [O iii].
We perform X-ray and IR stacking analyses of the GOODS-N sample of galaxies with accompanying deep Chandra imaging to verify the dominance of AGN activity in our TBT-AGN and star formation activity in our TBT-SF. We find that the TBT-AGN, on average, are X-ray hard with LX/LTIR > 3σ above the expected range for pure star-forming galaxies. Their X-ray hardness and excess X-ray signal are likely due to obscured or weak AGN activity. The TBT-SF, on the other hand, are X-ray soft with LX/LTIR consistent with pure star-forming galaxies.
We perform the same stacking analyses on the BPT categories in order to confirm the selection of the majority of BPT-comp as TBT-AGN. As expected, the BPT-SF are X-ray soft with LX/LTIR consistent with pure star-forming galaxies and the BPT-AGN are X-ray hard with LX/LTIR > 3σ above the expected range for pure star-forming galaxies. Of the individually X-ray-detected BPT-comp, 70% are X-ray hard with LX/LTIR ratios indicative of dominance by AGN activity. Our stacked BPT-comp is significantly detected in both the 0.5–2 keV and 2–8 keV bands and is X-ray hard, with 〈Γeff〉 = 1.0+0.4−0.4. Furthermore, the stacked BPT-comp LX/LTIR is >3σ above the expected range for pure star-forming galaxies. These findings support our TBT diagnostic inclusion of BPT-comp in the TBT-AGN regime.
The BPT-comp (individual and stacked) properties suggest that, on average, both their X-ray and optical signal is dominated by obscured or weak AGN activity. This is in contrast to claims by previous optical emission-line studies that the signal in BPT-comp is dominated by star formation activity. Therefore, we recommend that groups carefully consider the impact of excluding or including BPT-comp on the interpretation of their results. For example, for studies involving determining the bolometric contribution from AGN activity or the role of AGN activity in galaxy evolution, we advise maximal inclusiveness. Since BPT-comp comprise a significant percentage of the overall emission-line galaxy population (20% of the SDSS DR8 sample), inclusion of the BPT-comp would provide a more comprehensive picture of the true impact of AGN activity in these studies.
On the other hand, for metallicity studies of star-forming galaxies, we advise maximal conservativeness (e.g., Tremonti et al. 2004). Emission lines like [O iii] are boosted by AGN activity and can masquerade as indicators of low metallicity, leading to the misinterpretation of results. Therefore, in this case, it is optimal to use a diagnostic that reliably excludes all AGNs and AGN/SF composites.
The authors thank the referee for comments and suggestions which helped to improve this manuscript. We thank Ryan Hickox for helpful discussions and training in the use of his STACKFAST X-ray stacking code. We gratefully acknowledge support from NSF grant AST 0708793, the University of Wisconsin Research Committee with funds granted by the Wisconsin Alumni Research Foundation, and the David and Lucile Packard Foundation (A.J.B.). L.T. acknowledges support through a CIERA postdoctoral fellowship.
Funding for SDSS-III has been provided by the Alfred P. Sloan Foundation, the Participating Institutions, the National Science Foundation, and the U.S. Department of Energy Office of Science. The SDSS-III Web site is http://www.sdss3.org/.
SDSS-III is managed by the Astrophysical Research Consortium for the Participating Institutions of the SDSS-III Collaboration including the University of Arizona, the Brazilian Participation Group, Brookhaven National Laboratory, University of Cambridge, University of Florida, the French Participation Group, the German Participation Group, the Instituto de Astrofisica de Canarias, the Michigan State/Notre Dame/JINA Participation Group, Johns Hopkins University, Lawrence Berkeley National Laboratory, Max Planck Institute for Astrophysics, New Mexico State University, New York University, Ohio State University, Pennsylvania State University, University of Portsmouth, Princeton University, the Spanish Participation Group, University of Tokyo, University of Utah, Vanderbilt University, University of Virginia, University of Washington, and Yale University.
We wish to recognize and acknowledge the very significant cultural role and reverence that the summit of Mauna Kea has always had within the indigenous Hawaiian community. We are most fortunate to have the opportunity to conduct observations from this mountain.
Footnotes
- *
Some of the data presented herein were obtained at the W. M. Keck Observatory, which is operated as a scientific partnership among the California Institute of Technology, the University of California, and the National Aeronautics and Space Administration. The observatory was made possible by the generous financial support of the W. M. Keck Foundation.
- 5
Here we have restricted the SDSS DR8 sample to emission-line galaxies whose [N ii], Hα, [O iii], and Hβ fluxes have an S/N greater than five.
- 6
The WIYN observatory is a joint facility of the University of Wisconsin_Madison, Indiana University, Yale University, and the National Optical Astronomy Observatory (NOAO).
- 7
- 8
The right wing of the BPT diagram further subdivides into an upper and lower branch, with LINERs being the sources in the lower branch exhibiting lower [O iii] luminosities (Heckman 1980; Kauffmann et al. 2003). The nature of these sources (weak AGNs versus "retired" galaxies dominated by old stellar populations with relatively hard radiation fields) is still much debated (Kewley et al. 2006; Stasińska et al. 2008; Cid Fernandes et al. 2010, 2011).
- 9
If we remove the LINER regime from this analysis, we note that the Sy2 and SF/Sy2 regimes enclose 59% and 26% of the Seyferts, respectively. While <3% of sources in the Sy2 regime are BPT-SF, 74% of sources in the SF/Sy2 regime are BPT-SF.