


ABSTRACT
We present a catalog of 25 definite and 11 probable strong galaxy–galaxy gravitational lens systems with lens redshifts 0.4 ≲ z ≲ 0.7, discovered spectroscopically by the presence of higher-redshift emission lines within the Baryon Oscillation Spectroscopic Survey (BOSS) of luminous galaxies, and confirmed with high-resolution Hubble Space Telescope (HST) images of 44 candidates. Our survey extends the methodology of the Sloan Lens Advanced Camera for Surveys survey (SLACS) to higher redshift. We describe the details of the BOSS spectroscopic candidate detections, our HST ACS image processing and analysis methods, and our strong gravitational lens modeling procedure. We report BOSS spectroscopic parameters and ACS photometric parameters for all candidates, and mass-distribution parameters for the best-fit singular isothermal ellipsoid models of definite lenses. Our sample to date was selected using only the first six months of BOSS survey-quality spectroscopic data. The full five-year BOSS database should produce a sample of several hundred strong galaxy–galaxy lenses and in combination with SLACS lenses at lower redshift, strongly constrain the redshift evolution of the structure of elliptical, bulge-dominated galaxies as a function of luminosity, stellar mass, and rest-frame color, thereby providing a powerful test for competing theories of galaxy formation and evolution.
Export citation and abstract BibTeX RIS
1. INTRODUCTION
Strong galaxy–galaxy lensing produces unmistakably distorted, amplified, and multiplied images of a distant galaxy through the gravitational field of a foreground galaxy. This phenomenon provides a direct astrometric measurement of the total mass distribution within the interior of the lens galaxy, including luminous and dark components. Strong lensing on galactic scales was first suggested by Zwicky (1937) and first discovered by Walsh et al. (1979). Since then, a number of dedicated and serendipitous surveys have produced a combined sample of over 200 galaxy-scale lens systems (for a recent review, see Treu 2010). Of the various survey methods, the most prolific means of identifying strong galaxy–galaxy lens candidates is spectroscopic discovery, which provides evidence for two galaxies along one line of sight, along with precise measurements of the lens and source redshifts (Warren et al. 1996; Bolton et al. 2004). Images taken with the Hubble Space Telescope (HST) or other high-resolution facilities then provide a confirmation of the lensing hypothesis and make precise (milliarcsecond) measurements of the relative positions of the components. This method has been employed by the Sloan Lens Advanced Camera for Surveys (SLACS) survey (Bolton et al. 2006, 2008) to produce a sample of 85 grade-A confirmed strong lenses and an additional 13 grade-B probable lenses (Auger et al. 2009).
Strong lensing is the best probe of the distribution of mass in the transition region between the baryon-dominated central regions of galaxies and the dark matter halo (e.g., Kochanek 2005). By combining strong-lensing aperture masses with lens-galaxy luminosities, sizes, and velocity dispersions, the SLACS collaboration has arrived at the following results (Treu et al. 2006; Koopmans et al. 2006; Gavazzi et al. 2007; Bolton et al. 2008; Koopmans et al. 2009, see also Jiang & Kochanek 2007).
- 1.The average total mass-density profile of early-type galaxies is nearly isothermal, corresponding to nearly flat galaxy rotation curves within the Einstein radius.
- 2.Models for early-type galaxies in which light linearly traces mass are falsified at ≳ 99.9% confidence even within the optical half-light radius.
- 3.The average weak-lensing signal out to a few hundred kiloparsecs around the SLACS lenses is consistent with an isothermal extrapolation of the strong-lensing constraints from the inner few kiloparsecs.
- 4.The average density structure of elliptical galaxies is universal and does not vary systematically with mass and exhibits a small but significant intrinsic scatter that is not significantly correlated with any other observable quantity.
- 5.The relationship between the lensing mass and the dynamical mass of SLACS lenses has a logarithmic slope of 1.03 ± 0.04.
- 6.The variation in the dark matter fraction suggests a bulge–halo conspiracy, with the combined rotation curve of both components together being flatter than that of either component independently.
Many of these results were also found in earlier but smaller studies of lensed quasars (see e.g., Treu & Koopmans 2004, or Rusin & Kochanek 2005, and references therein).
In order to conduct the next generation of large-scale structure surveys, the Sloan Digital Sky Survey III (SDSS-III) collaboration upgraded the Sloan Digital Sky Survey I (SDSS-I) optical spectrographs (York et al. 2000) and initiated the Baryon Oscillation Spectroscopic Survey (BOSS; Eisenstein et al. 2011). The significant hardware changes relative to SDSS-I are (1) an increase in the number of fibers from 640 to 1000, (2) smaller fiber diameters that subtend 2'' rather than 3'' on the sky, (3) volume-phase holographic gratings with increased efficiency, and (4) larger and more sensitive CCDs that increase throughput and wavelength coverage relative to SDSS-I. With this new configuration, BOSS is obtaining spectra of approximately 1.5 million luminous galaxies out to redshift z ≃ 0.7 from mid-2009 to mid-2014. This sample complements the SDSS-I luminous red galaxy (LRG) data set that extends out to redshift z ≃ 0.35. LRGs are luminous, elliptical, bulge-dominated galaxies, with remarkably uniform spectral energy distributions that are characterized by a strong break at 4000 Å (Eisenstein et al. 2001, 2003). The BOSS luminous galaxy sample is composed of a low-redshift (LOZ) sample designed to select LRGs with 0.2 ≲ z ≲ 0.4 and a constant mass (CMASS) sample designed to select luminous galaxies with stellar masses in the range 1011 M☉ ≲ M⋆ ≲ 1012 M☉ with 0.4 ≲ z ≲ 0.7 (Eisenstein et al. 2011). Masters et al. (2011) performed visual inspection of 240 BOSS targets in the COSMic Origins Survey field and determined that ∼75% of BOSS galaxies are "early-type," with the remainder "late-type," and ∼20% of BOSS galaxies are multiple systems. The combined sample will enable a baryonacoustic feature measurement (Eisenstein & Hu 1998; Eisenstein et al. 2005) of the distance–redshift relation in several redshift bins.
As a consequence of this design and survey strategy, BOSS presents an opportunity to discover a sample of strong galaxy–galaxy lenses at significant cosmological look-back time that is of comparable size and homogeneity to the SLACS sample at lower redshift. The two samples in combination may allow a unique study of the evolution of the structure of mass density and its dependence on other parameters such as stellar mass and stellar velocity dispersion.
A complementary sample of higher-redshift lenses discovered in the Canada–France–Hawaii Telescope Strong Lens Legacy Survey (SL2S; Cabanac et al. 2007; Ruff et al. 2011) suggests evolution in the slope of the mean-density profile to shallower slopes at higher redshifts. The key complementarity between SL2S and BOSS strong-lens surveys is that the former is more uniformly sensitive to selecting lenses across a range of angular scales (and hence mass scales), whereas the latter guarantees the spectroscopic redshift completeness for both lensing and lensed galaxies that is necessary for an accurate conversion from observed angular scales to physical mass scales.
This paper (Paper I) is the first in a series presenting the initial catalog of 45 spectroscopically selected strong galaxy lens candidates discovered from the first partial year of BOSS data. We refer to this survey as the BOSS Emission-Line Lens Survey (BELLS). Of the initial 45 candidates, 44 were successfully observed with the Wide Field Camera (WFC) of the HST Advanced Camera for Surveys (ACS) under Program ID GO-12209 (PI: A. Bolton), resulting in 25 confirmed strong gravitational lenses, along with an additional 11 possible lenses with either very faint candidate lensed features or significant dust features complicating the analysis. The remaining target, SDSS J0212+0027, is scheduled for HST visit. We show that the BELLS and SLACS lenses trace a single evolving massive galaxy population in terms of stellar mass, thus confirming the suitability of the combined sample to constrain the structural and dynamical evolution of massive galaxies down to the present-day universe.
This paper is organized as follows. The spectroscopic discovery method is described in Section 2. The HST imaging data, reduction method, and the sample of 45 candidates are presented in Section 3, and the photometric analysis including the B-spline fits used for lens-galaxy subtraction and the de Vaucouleurs (1948) models used for measuring the magnitudes and half-light radii are presented in Section 4. We present our strong-lens modeling methods and results in Section 5, employing singular isothermal ellipsoid (SIE) mass models in combination with both parametric and pixelized-grid source-plane surface-brightness models. A summary of results is presented in Section 6. Throughout this paper, we assume a standard general-relativistic cosmology with parameters (h, ΩM, ΩΛ) = (0.7, 0.3, 0.7) (Larson et al. 2011).
2. SPECTROSCOPIC CANDIDATE SELECTION
The premise behind the spectroscopic strong-lens candidate selection of Bolton et al. (2004) was to search for multiple background emission lines within the 3'' diameter solid angle covered by the SDSS-I spectroscopic fiber in the residual spectra found after subtracting best-fit galaxy templates to the foreground-galaxy spectrum (also see Warren et al. 1996; Hewett et al. 2000; Willis et al. 2005, 2006). For our current search within the BOSS database, we apply much the same method, which is also described in Bolton et al. (2006, 2008), to the 2'' diameter solid angle covered by the SDSS-III spectroscopic fiber. As a result of the blurring effect of atmospheric seeing, spectroscopic lens selection is efficient even at Einstein radii of θE ≳ 2'' (R. Arneson et al. 2011, in preparation).
The full list of possible background emission lines for which we search is given in Table 1, along with the corresponding maximum redshift to which they can be detected with either the SDSS-I or the more red-sensitive BOSS spectrographs. The spectra are based on SDSS-III imaging (Gunn et al. 2006, 1998), available in the eighth SDSS public data release (DR8) (SDSS-III Collaboration: Aihara et al. 2011).
Table 1. Emission-line Wavelengths
| Emission | Rest-frame | SDSS-I | SDSS-III |
|---|---|---|---|
| Line | Wavelength (Å) | zmax | zmax |
| (1) | (2) | (3) | (4) |
| [O ii]λλ3727 | 3727.09 | 1.44 | 1.63 |
| 3729.88 | |||
| Hδ | 4102.89 | 1.22 | 1.39 |
| Hγ | 4341.68 | 1.10 | 1.26 |
| Hβ | 4862.68 | 0.87 | 1.02 |
| [O iii] 4959 | 4960.30 | 0.83 | 0.98 |
| [O iii] 5007 | 5008.24 | 0.82 | 0.96 |
| [N ii] 6548 | 6549.86 | 0.39 | 0.50 |
| Hα | 6564.61 | 0.39 | 0.49 |
| [N ii] 6583 | 6585.27 | 0.38 | 0.49 |
| [S ii] 6716 | 6718.29 | 0.35 | 0.46 |
| [S ii] 6730 | 6732.68 | 0.35 | 0.46 |
Notes. Column 1 lists the emission lines used in the spectroscopic discovery of background emission-line sources and Column 2 shows the rest-frame vacuum wavelength of the emission line. Columns 3 and 4 provide the maximum redshift of the emission line detectable with the SDSS-I and SDSS-III spectrographs, respectively.
Download table as: ASCIITypeset image
We summarize our selection procedure here for completeness and to reflect minor changes in the implementation relevant for BOSS.
- 1.Rescale the spectrum noise-vector estimates based upon the residual fluctuations in sky-subtracted sky-fiber spectra on the plate.
- 2.Select all objects both targeted and spectroscopically classified as galaxies, without any redshift warning flags. In the redshift analysis, only "galaxy" and "star" templates were allowed, since the inclusion of "qso" templates in the analysis of relatively low signal-to-noise ratio (S/N) BOSS galaxy spectra yields an unacceptable number of spurious classifications and redshifts. There were 133,852 galaxy spectra scanned in total.
- 3.Mask the positions of common emission lines in the spectra of the target galaxies, re-fit a model to the BOSS target-galaxy continuum using a basis of seven principal component analysis (PCA) eigenspectra generated as described in SDSS-III Collaboration: Aihara et al. (2011) (versus four PCA eigenspectra used in the redshift analysis), and subtract this continuum model from the data.
- 4.Scan the residual spectra automatically for at least two of the lines Hα, Hβ, [O iii] 5007, [O iii] 4959, or [O ii]λλ3727 detected at 4σ significance or higher at a common redshift greater than that of the BOSS target. We refer to these as "multi-line" detections. There were 2898 multi-line hits.
- 5.Scan the residual spectra automatically for a single line detected at 6σ significance or higher that would be at a higher redshift than the BOSS target if identified as [O ii]λλ3727. We refer to these as "single-line" detections. There were 8211 single-line hits.
- 6.Bin the single-line detections by observed-frame wavelength and prune those that are in highly overpopulated bins associated with night sky emission-line subtraction residuals.
- 7.Bin the single-line detections by target-galaxy rest-frame wavelength and prune those that are in highly overpopulated bins associated with imperfect foreground-galaxy feature masking and subtraction. There were 2137 single-line hits remaining after the cuts of Steps 6 and 7.
- 8.Veto any single-line [O ii]λλ3727 identification that is more plausibly explained as Hα, Hβ, or [O iii] 5007, based upon the appearance of secondary lines at 3σ significance or higher. There were 1624 single-line hits remaining.
- 9.Remove any single-line detections also found in the multi-line search. There were 1268 single-line hits remaining.
- 10.Remove any detections in which the background redshift is not greater than the foreground redshift by the margin, zL − zS ⩾ 0.05. There were 1303 multi-line hits and 741 single-line hits remaining.
- 11.Visually inspect the reduced spectra of all remaining selected systems at the position of the candidate background emission lines to remove obvious data-reduction/data-quality artifacts. There were 1226 multi-line hits and 507 single-line hits remaining after this step.
- 12.Inspect neighboring fiber spectra on each plate at the wavelength of the candidate background emission to rule out cross talk from bright emission lines in neighboring spectra and spatially localized auroral emission not subtracted by the global sky spectrum model.
- 13.Inspect the individual exposure spectra that were co-added to give the final detection spectrum to ensure that the candidate background emission-line feature is not present in only a single frame (as would be expected for, e.g., cosmic-ray hits).
- 14.Inspect the raw spectroscopic CCD data for all exposures at the position of [O ii]λλ3727 emission for single-line candidates to ensure that the detection is not related to cosmetic blemishes in the CCD.
- 15.Compute a total S/N for all detections as the quadrature sum of the individual S/N values (i.e., σ-values) of all lines in Table 1 detected at a significance of 3σ or higher—including those which we do not employ as primary detection triggers in Step 4—and rank candidates by this total S/N.
In addition to ranking candidates by total S/N, we also select candidates to maximize lensing probability. Bolton et al. (2008) show empirically that the lensing probability of a candidate system is a strongly increasing function of the predicted Einstein radius of the system using a simple singular isothermal sphere model based on the foreground-galaxy velocity dispersion and the redshifts of both foreground and background galaxies.
For BOSS lens candidates, we do not have precise velocity-dispersion measurements to use in this calculation nor do we want to introduce a selection bias by using luminosity as a proxy. Hence, we assume a fiducial velocity dispersion of 250 km s−1 for all candidates and calculate a predicted "Einstein radius" given the foreground and background redshifts. This fiducial value is taken from the median of all well-measured velocity dispersions in the subset of the Bolton et al. (2008) SLACS lens sample having early-type morphology. We then compute the physical radius subtended by this predicted Einstein radius at the redshift of the lens galaxy and require it to be greater than 4.5 kpc. Since no actual magnitude or velocity-dispersion information is used to make this cut, it can only bias the sample in terms of foreground- and background-redshift distributions. The cut corresponds to a predicted Einstein radius of 0 84 at zL = 0.4, and 063 at zL = 0.7. We verified that the sample selected by this cut does produce a reasonably uniform distribution of candidates over the available redshift range in the parent sample. The fiducial values of σv = 250 km s−1 and θE = 4.5 kpc are not especially significant and can be traded off against one another with no effect on the selected sample. Effectively, our cut serves to favor candidates with higher background redshifts at a given foreground redshift and pushes to slightly smaller angular Einstein radii for higher-redshift lens galaxies.
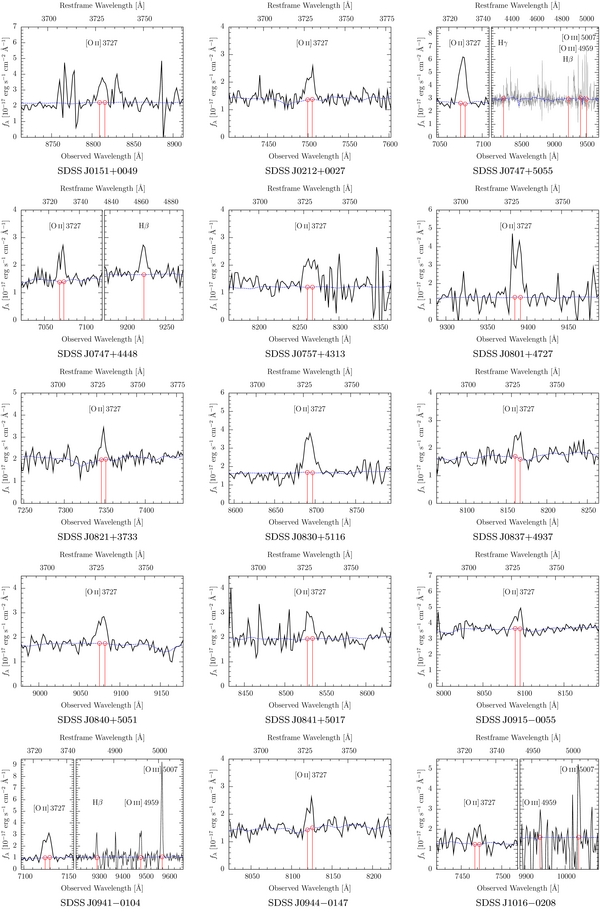
These steps were carried out for all BOSS survey plates available prior to 2010 June 21: 239 unique plates, with an average of approximately 500 successful galaxy redshifts per plate. The systems are listed in Table 2, including the BOSS pipeline redshift, the redshift of our candidate background emission-line source, and the BOSS photometry and velocity-dispersion measurements. The background emission-line spectra remaining after subtracting the best-fit foreground spectra are presented in Figure 1. The original detection of SDSS J1221−0220 was an artifact of the spectroscopic data-reduction version used at the time of the HST target selection.
Download figure:
Standard image High-resolution image
Download figure:
Standard image High-resolution image
Figure 1. Spectroscopically discovered background emission lines in BELLS target galaxies. The black solid line shows the BOSS observed flux density, fλ, as a function of observed (lower axis) and rest-frame (upper axis) wavelengths. The blue dashed line shows the BOSS template fitted to the continuum of the foreground galaxy, and the red vertical line shows the wavelength of the background emission lines discovered in the differences between the observed flux and the best-fit template.
Download figure:
Standard image High-resolution imageTable 2. BOSS Properties of BELLS Candidate Systems
| System Name | Plate-MJD-Fiber | zL | zS | i-band Magnitude | Reff ('') | σBOSS | Sample |
|---|---|---|---|---|---|---|---|
| (km s−1) | |||||||
| (1) | (2) | (3) | (4) | (5) | (6) | (7) | (8) |
| SDSS J015107.37+004909.0 | 3606-55182-0679 | 0.5171 | 1.3636 | 19.81 ± 0.05 | 0.89 ± 0.21 | 219 ± 39 | cmass |
| SDSS J021214.80+002719.1 | 4236-55479-0603 | 0.5372 | 1.0122 | 19.47 ± 0.03 | 1.17 ± 0.19 | 189 ± 39 | cmass |
| SDSS J074724.12+505537.5 | 3677-55205-0551 | 0.4384 | 0.8983 | 18.92 ± 0.03 | 1.24 ± 0.22 | 328 ± 60 | cmass |
| SDSS J074734.75+444859.3 | 3676-55186-0581 | 0.4366 | 0.8966 | 18.84 ± 0.03 | 2.87 ± 0.50 | 281 ± 52 | cmass |
| SDSS J075754.10+431353.8 | 3676-55186-0063 | 0.5146 | 1.2165 | 19.13 ± 0.04 | 2.51 ± 0.55 | ... | cmass |
| SDSS J080105.30+472749.6 | 3684-55246-0301 | 0.4831 | 1.5181 | 19.87 ± 0.05 | 0.57 ± 0.17 | 98 ± 24 | cmass |
| SDSS J082130.66+373330.7 | 3760-55268-0699 | 0.5056 | 0.9705 | 19.24 ± 0.02 | 0.93 ± 0.12 | 203 ± 23 | cmass |
| SDSS J083049.73+511631.8 | 3695-55212-0142 | 0.5301 | 1.3317 | 19.50 ± 0.04 | 1.10 ± 0.22 | 268 ± 36 | cmass |
| SDSS J083727.02+493703.7 | 3697-55290-0255 | 0.5513 | 1.1896 | 19.50 ± 0.03 | 1.24 ± 0.27 | 208 ± 34 | cmass |
| SDSS J084054.19+505153.1 | 3697-55290-0921 | 0.5534 | 1.4348 | 19.81 ± 0.03 | 0.65 ± 0.17 | 206 ± 32 | cmass |
| SDSS J084121.74+501720.4 | 3697-55290-0087 | 0.5542 | 1.2881 | 19.50 ± 0.03 | 0.79 ± 0.17 | 176 ± 25 | cmass |
| SDSS J091516.60−005500.6 | 3766-55213-0675 | 0.4022 | 1.1705 | 18.46 ± 0.02 | 1.98 ± 0.28 | 221 ± 16 | cmass |
| SDSS J094102.69−010402.5 | 3782-55244-0513 | 0.4610 | 0.9115 | 19.79 ± 0.04 | 0.94 ± 0.25 | 180 ± 50 | cmass |
| SDSS J094427.47−014742.4 | 3782-55244-0268 | 0.5390 | 1.1785 | 19.70 ± 0.04 | 1.35 ± 0.46 | 204 ± 34 | cmass |
| SDSS J101658.29−020833.3 | 3784-55269-0237 | 0.4699 | 1.0034 | 19.34 ± 0.04 | 1.71 ± 0.47 | 179 ± 26 | cmass |
| SDSS J103941.16−001424.5 | 3833-55290-0109 | 0.3849 | 0.9141 | 19.72 ± 0.04 | 0.71 ± 0.17 | 107 ± 21 | cmass |
| SDSS J111737.72−013308.9 | 3788-55246-0930 | 0.4670 | 1.2860 | 19.39 ± 0.07 | 2.54 ± 1.24 | 221 ± 59 | cmass |
| SDSS J115944.63−000728.2 | 3843-55278-0069 | 0.5793a | 1.3457 | 19.63 ± 0.03 | 0.99 ± 0.22 | 165 ± 41 | cmass |
| SDSS J121504.44+004726.0 | 3846-55327-0559 | 0.6423 | 1.2970 | 19.27 ± 0.03 | 1.42 ± 0.21 | 262 ± 45 | cmass |
| SDSS J122113.28−022037.8 | 3777-55210-0075 | 0.4061 | 1.0108 | 19.07 ± 0.02 | 0.64 ± 0.09 | 240 ± 24 | cmass |
| SDSS J122151.92+380610.5 | 3965-55302-0586 | 0.5348 | 1.2844 | 19.77 ± 0.04 | 0.93 ± 0.22 | 187 ± 48 | cmass |
| SDSS J123427.99−024129.6 | 3778-55213-0375 | 0.4900 | 1.0159 | 19.18 ± 0.04 | 1.61 ± 0.46 | 122 ± 31 | cmass |
| SDSS J131829.39−010421.6 | 4004-55321-0121 | 0.6591 | 1.3959 | 19.66 ± 0.04 | 1.06 ± 0.31 | 177 ± 27 | cmass |
| SDSS J133751.31+362018.1 | 3986-55329-0713 | 0.5643 | 1.1821 | 19.01 ± 0.03 | 1.60 ± 0.33 | 225 ± 35 | cmass |
| SDSS J134427.96+325824.6 | 3856-55269-0309 | 0.4750 | 0.9777 | 19.57 ± 0.03 | 0.78 ± 0.13 | 198 ± 22 | cmass |
| SDSS J134507.63−012939.8 | 4044-55359-0603 | 0.4884 | 1.2992 | 19.92 ± 0.04 | 0.57 ± 0.13 | 200 ± 25 | cmass |
| SDSS J134910.30+361239.7 | 3852-55243-0327 | 0.4396 | 0.8926 | 18.88 ± 0.02 | 2.03 ± 0.31 | 178 ± 18 | cmass |
| SDSS J135218.99+321651.8 | 3861-55274-0393 | 0.4634 | 1.0341 | 19.28 ± 0.03 | 1.35 ± 0.33 | 161 ± 21 | cmass |
| SDSS J145259.14+332349.4 | 3870-55273-0595 | 0.5602 | 1.1896 | 19.19 ± 0.04 | 1.53 ± 0.31 | 296 ± 42 | cmass |
| SDSS J150345.69+322542.1 | 3876-55245-0585 | 0.6059 | 1.4489 | 19.49 ± 0.06 | 3.65 ± 1.18 | 162 ± 68 | cmass |
| SDSS J152209.54+291021.9 | 3879-55244-0299 | 0.5553 | 1.3108 | 19.67 ± 0.03 | 1.08 ± 0.27 | 166 ± 27 | cmass |
| SDSS J153730.27+022036.9 | 4054-55358-0809 | 0.4825 | 1.0729 | 19.62 ± 0.04 | 0.57 ± 0.15 | 199 ± 25 | cmass |
| SDSS J154118.56+181235.1 | 3937-55352-0361 | 0.5603 | 1.1133 | 19.82 ± 0.03 | 0.59 ± 0.00 | 174 ± 24 | cmass |
| SDSS J154246.33+162951.8 | 3932-55337-0331 | 0.3521 | 1.0233 | 18.39 ± 0.02 | 1.45 ± 0.13 | 210 ± 16 | loz |
| SDSS J154503.57+274805.3 | 3952-55330-0927 | 0.5218 | 1.2886 | 18.90 ± 0.03 | 2.65 ± 0.47 | 250 ± 37 | cmass |
| SDSS J160113.27+213833.9 | 3935-55326-0093 | 0.5435 | 1.4461 | 19.75 ± 0.03 | 0.63 ± 0.12 | 207 ± 36 | cmass |
| SDSS J161109.80+170526.6 | 4072-55362-0847 | 0.4766 | 1.2109 | 19.66 ± 0.04 | 1.33 ± 0.38 | 109 ± 23 | cmass |
| SDSS J161523.55+205636.3 | 4057-55357-0610 | 0.5894 | 1.3103 | 18.42 ± 0.03 | 5.92 ± 1.03 | 210 ± 34 | cmass |
| SDSS J161846.74+193026.7 | 4057-55357-0201 | 0.4906 | 1.0164 | 19.93 ± 0.04 | 0.76 ± 0.22 | 275 ± 53 | cmass |
| SDSS J162754.57+191004.9 | 4060-55359-0075 | 0.5251 | 1.4892 | 19.59 ± 0.03 | 0.59 ± 0.11 | 236 ± 33 | cmass |
| SDSS J163150.33+185404.1 | 4064-55366-0790 | 0.4081 | 1.0863 | 17.70 ± 0.01 | 2.07 ± 0.10 | 272 ± 14 | loz |
| SDSS J163714.58+143930.1 | 4065-55368-0515 | 0.3910 | 0.8744 | 19.49 ± 0.03 | 0.89 ± 0.15 | 208 ± 30 | cmass |
| SDSS J212252.04+040935.5 | 4081-55365-0241 | 0.6261 | 1.4517 | 19.29 ± 0.03 | 1.76 ± 0.25 | 324 ± 56 | cmass |
| SDSS J212510.67+041131.6 | 4080-55471-0621 | 0.3632 | 0.9777 | 18.21 ± 0.01 | 1.47 ± 0.09 | 247 ± 17 | loz |
| SDSS J230335.17+003703.2 | 4207-55475-0933 | 0.4582 | 0.9363 | 18.96 ± 0.02 | 1.35 ± 0.23 | 274 ± 31 | cmass |
Notes. Column 1 provides the SDSS system name in terms of truncated J2000 R.A. and decl. in the format HHMMSS.ss±DDMMSS.s. Column 2 provides the plate-MJD-fiber of the primary spectrum for the BOSS target (Eisenstein et al. 2011) as of v5_4_45 of the BOSS pipeline. Columns 3 and 4 provide the foreground BOSS spectroscopic redshift and the spectroscopically detected background emission-line source redshift, respectively. Columns 5 and 6 provide the BOSS de Vaucouleurs model i-band magnitudes and intermediate axis effective radii, respectively (Fukugita et al. 1996; SDSS-III Collaboration: Aihara et al. 2011). Column 7 provides the velocity dispersion computed by the BOSS pipeline (v5_4_45), uncorrected for aperture effects, using redshift-error marginalization and restricted stellar template sets as described in Shu et al. (2011). Column 8 indicates whether the candidate was selected from the BOSS LOZ or CMASS sample. All the BELLS candidates in this table were observed (or will be observed in the case of SDSS J0212+0027) by HST cycle 18 program ID GO-12209. The HST-ACS I814-band properties are listed in Table 3, including our classification of morphology, multiplicity, and lens grade, with our justification of BELLS confirmed gravitational lenses in Table 4. aThe lens redshift quoted for SDSS J1159−0007 differs from the BOSS v5_4_45 galaxy redshift that will be reported in the ninth SDSS public data release (DR9) as z_noqso, due to the background emission-line flux.
Download table as: ASCIITypeset image
3. IMAGE PROCESSING
The 45 systems identified in Table 2 were submitted for observation under HST cycle 18 program ID GO-12209, with one single-orbit visit per target using the I-band F814W filter, with four sub-exposures of approximately 500 s each in the ACS-WFC-DITHER-BOX pattern.
After each complete (and successful) visit, the individual flat-fielded (FLT) sub-exposure files generated by the Space Telescope Science Institute (STScI) CALACS pipeline were downloaded and reduced using ACSPROC—a custom-built pipeline that was generalized from the SLACS version of the software described in Bolton et al. (2008). For each visit, the steps in the current version of ACSPROC, implemented in the IDL programming language, are as follows.
- 1.Extract a 1500 × 1500 pixel section of the FLT file for each sub-exposure, centered on the target, performing cosmic-ray rejection using L.A. COSMIC (van Dokkum 2001), and sky-level subtraction using the FLT MDRIZSKY FITS header, as determined by the STScI pipeline MULTIDRIZZLE reduction.
- 2.Obtain the approximate pixel-shift across sub-exposures through fast Fourier transform cross correlation and compute the centroid of the target galaxy for each sub-exposure by fitting an elliptical Moffat profile using the MPFIT2DPEAK nonlinear least-squares fitting function.
- 3.Rectify the sub-exposures onto a uniform 005 per pixel grid, with north up and east left, centered on the computed centroid. Rectify, with identical sampling, an appropriate model point-spread function (PSF) which was computed using the Tiny Tim HST PSF simulator (Krist 1993).
- 4.Combine the sub-exposures into a single stacked image, with additional cosmic-ray rejection. Similarly, combine the PSF model.
- 5.Within a 280 × 280 (14'' × 14'') section of the stacked image centered on the centroid of the target, separately mask potential lensed features, and probable non-lensed stars and galaxies.
- 6.Fit a set of elliptical radial B-spline models (Bolton et al. 2006, 2008) to the masked stacked image using the MPFIT nonlinear least-squares implementation of the Levenberg–Marquardt algorithm (Moré & Wright 1993), allowing for either none or combinations of higher-order multipole moments, including the dipole, quadrupole, and octopole moments. Each of the B-spline models are manually inspected, and the masks are iteratively refined by the appearance of strong-lensing features in the B-spline-subtracted residuals. The B-spline fit which leads to the lowest χ2 without introducing obviously spurious small-scale structure is selected as the model for lens-galaxy subtraction.
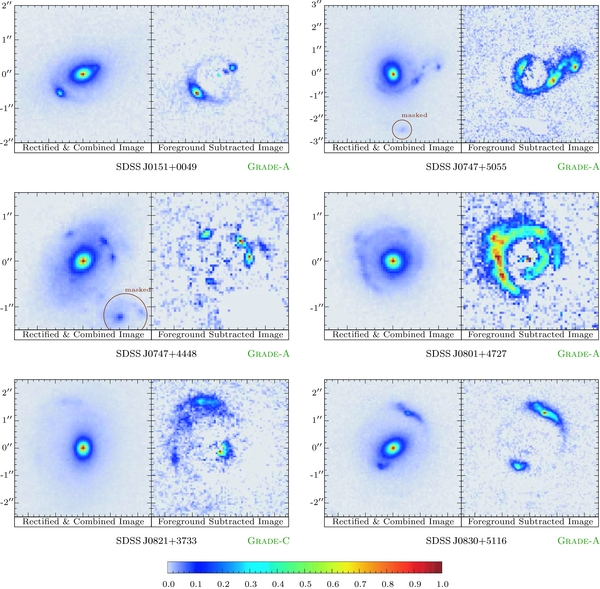
Step 4 leads to a combined and rectified image for all of the systems listed in Table 2. Step 5 leads to a grade-A foreground-subtracted image for systems with clear and convincing evidence of multiple imaging for a subset of those systems. Systems with lensed features that are too low in surface brightness or contaminated by significant bright star light are classified as grade-B systems and systems that are unsuitable for lens modeling due to the absence of clearly identifiable counterimages are classified as grade-C systems. The systems without any identifiable lensed features are classified as grade-X systems for which we do not complete Step 5.
The results of the ACSPROC image processing, including the combined and rectified stacked images and the foreground-subtracted images are shown in Figure 2 for all of the grade-A, -B, and -C systems. The combined and rectified stacked images for the grade-X systems are included in Figure 6 in the Appendix for completeness.
Download figure:
Standard image High-resolution image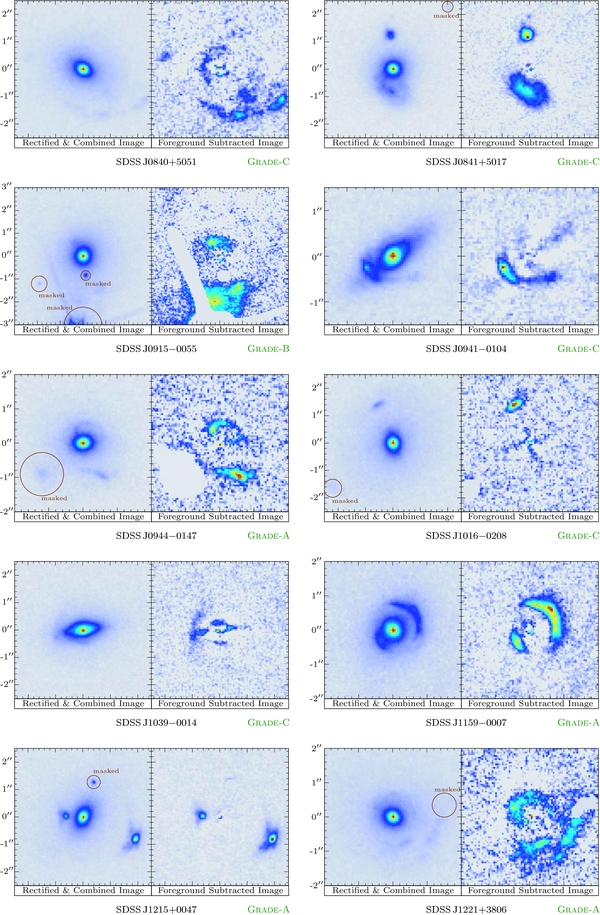
Download figure:
Standard image High-resolution image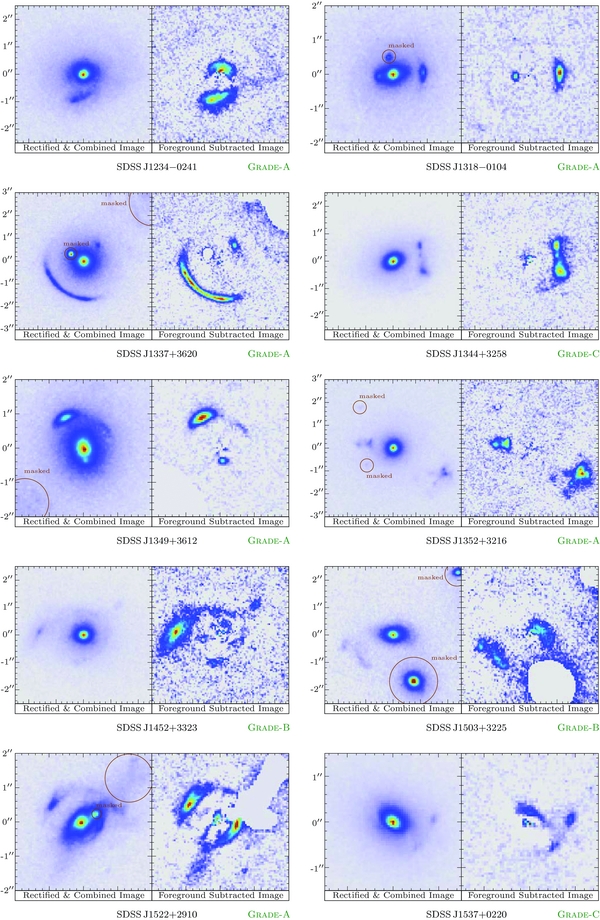
Download figure:
Standard image High-resolution image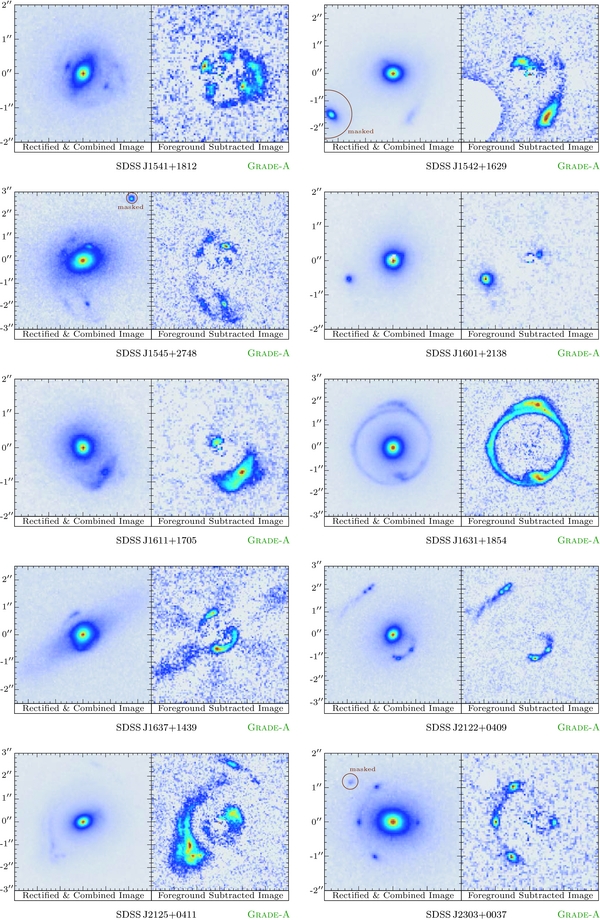
Figure 2. BELLS strong gravitational lens galaxies and foreground-subtracted images. The 36 grade-A, -B, and -C lenses discovered under HST cycle 18 program 12209. For each system, the left panel shows the HST ACS-WFC F814W rectified and combined images with north up and east to the left, and the right panel reveals the lensed features which remain after the foreground galaxy has been subtracted by the B-spline method described in Section 3. Probable non-lensed extraneous features that were masked are circled. System properties from the BOSS data are listed in Table 2, and those from the HST-ACS data are listed in Table 3. Comments justifying our lens grade are provided in Table 4.
Download figure:
Standard image High-resolution image4. PHOTOMETRIC ANALYSIS
To compute standardized model magnitudes, effective radii, projected axis ratios, and position angles for the BELLS targets, we fit the images to two-dimensional ellipsoidal de Vaucouleurs luminosity profiles. These fits are performed over a 51'' × 51'' square region centered on the target galaxies (approximately half the narrower dimension of the HST ACS-WFC CCD aperture in which the targets were roughly centered). The 14'' × 14'' masks created with our ACSPROC software described in Step 5 of Section 3 are applied in the central regions; stars and neighboring galaxies outside the manually masked area are masked with a single-step "clipping" of pixels that deviate by more than four standard deviations from the model. The fits are performed using the MPFIT2DFUN procedure in the IDL programming language, using a flat-weighted inverse variance, and include convolution with the appropriate rectified and stacked Tiny Tim PSF (Krist 1993). The initial optimization is done by sampling the model at one point per data pixel and repeated with a 5 × 5 sub-sampling per pixel.
The I814-band apparent magnitudes are computed from the full (not truncated) analytic integral of the best-fit de Vaucouleurs model and provided in Table 3. We also report the corrections for Galactic extinction from Schlegel et al. (1998). Photometric stellar masses are computed from the extinction corrected I814-band apparent magnitudes using the Maraston et al. (2009) LRG photometric stellar population model with a Salpeter initial mass function. We use the intermediate axis effective radius (the geometric mean of the major and minor axes).
Table 3. HST-ACS I814-band Properties of BELLS Systems
| System Name |  (Obs.) (Obs.) |
 (extin.) (extin.) |
Reff ('') | q | P.A. (°) | Classification |
|---|---|---|---|---|---|---|
| (1) | (2) | (3) | (4) | (5) | (6) | (7) |
| SDSS J0151+0049 | 19.816 | 0.049 | 0.665 ± 0.002 | 0.604 ± 0.001 | 109.0 ± 0.1 | E-S-A |
| SDSS J0747+5055 | 18.923 | 0.111 | 1.089 ± 0.002 | 0.737 ± 0.001 | 6.9 ± 0.1 | E-S-A |
| SDSS J0747+4448 | 19.417 | 0.066 | 0.924 ± 0.002 | 0.645 ± 0.001 | 140.2 ± 0.1 | E-S-A |
| SDSS J0757+4313 | 18.500 | 0.068 | 3.818 ± 0.009 | 0.572 ± 0.001 | 49.8 ± 0.1 | L-M-X |
| SDSS J0801+4727 | 19.911 | 0.103 | 0.499 ± 0.001 | 0.951 ± 0.002 | 70.8 ± 1.3 | E-S-A |
| SDSS J0821+3733 | 19.219 | 0.079 | 0.551 ± 0.001 | 0.743 ± 0.001 | 172.8 ± 0.1 | E-S-C |
| SDSS J0830+5116 | 19.332 | 0.087 | 0.969 ± 0.002 | 0.699 ± 0.001 | 121.6 ± 0.1 | E-S-A |
| SDSS J0837+4937 | 19.462 | 0.060 | 0.669 ± 0.001 | 0.473 ± 0.001 | 51.3 ± 0.1 | L-S-X |
| SDSS J0840+5051 | 19.984 | 0.043 | 0.357 ± 0.001 | 0.699 ± 0.001 | 63.7 ± 0.1 | E-S-C |
| SDSS J0841+5017 | 19.624 | 0.045 | 0.648 ± 0.001 | 0.939 ± 0.002 | 79.3 ± 0.8 | E-S-C |
| SDSS J0915−0055 | 18.518 | 0.070 | 1.219 ± 0.002 | 0.925 ± 0.001 | 173.2 ± 0.5 | E-S-B |
| SDSS J0941−0104 | 20.005 | 0.063 | 0.458 ± 0.001 | 0.568 ± 0.001 | 129.9 ± 0.1 | L-S-C |
| SDSS J0944−0147 | 19.965 | 0.067 | 0.478 ± 0.001 | 0.785 ± 0.002 | 91.7 ± 0.2 | E-S-A |
| SDSS J1016−0208 | 19.797 | 0.072 | 0.465 ± 0.001 | 0.816 ± 0.002 | 1.5 ± 0.3 | E-S-C |
| SDSS J1039−0014 | 19.345 | 0.094 | 0.812 ± 0.001 | 0.440 ± 0.001 | 97.9 ± 0.0 | L-S-C |
| SDSS J1117−0133 | 18.896 | 0.079 | 2.397 ± 0.006 | 0.938 ± 0.002 | 135.3 ± 1.0 | U-U-X |
| SDSS J1159−0007 | 19.463 | 0.049 | 0.958 ± 0.002 | 0.966 ± 0.002 | 23.5 ± 1.9 | E-S-A |
| SDSS J1215+0047 | 19.544 | 0.050 | 0.651 ± 0.001 | 0.684 ± 0.001 | 152.9 ± 0.1 | E-S-A |
| SDSS J1221−0220 | 18.942 | 0.055 | 0.710 ± 0.001 | 0.586 ± 0.001 | 54.9 ± 0.1 | E-S-X |
| SDSS J1221+3806 | 19.984 | 0.029 | 0.470 ± 0.001 | 0.838 ± 0.002 | 65.6 ± 0.3 | E-S-A |
| SDSS J1234−0241 | 19.269 | 0.064 | 1.054 ± 0.002 | 0.762 ± 0.002 | 93.7 ± 0.2 | E-S-A |
| SDSS J1318−0104 | 19.873 | 0.050 | 0.687 ± 0.002 | 0.761 ± 0.002 | 106.8 ± 0.3 | E-S-A |
| SDSS J1337+3620 | 18.603 | 0.023 | 2.034 ± 0.003 | 0.960 ± 0.001 | 111.4 ± 1.0 | E-S-A |
| SDSS J1344+3258 | 19.581 | 0.031 | 0.524 ± 0.001 | 0.746 ± 0.001 | 117.8 ± 0.1 | E-S-C |
| SDSS J1345−0129 | 21.877 | 0.071 | 1.000 ± 0.003 | 0.000 ± 0.001 | 0.0 ± 0.1 | E-S-X |
| SDSS J1349+3612 | 18.555 | 0.025 | 1.886 ± 0.003 | 0.743 ± 0.001 | 8.7 ± 0.1 | E-S-A |
| SDSS J1352+3216 | 19.514 | 0.024 | 0.579 ± 0.001 | 0.949 ± 0.001 | 127.2 ± 0.8 | E-S-A |
| SDSS J1452+3323 | 19.487 | 0.026 | 0.623 ± 0.001 | 0.836 ± 0.001 | 87.9 ± 0.2 | E-S-B |
| SDSS J1503+3225 | 20.118 | 0.032 | 0.769 ± 0.003 | 0.625 ± 0.002 | 82.4 ± 0.2 | E-M-B |
| SDSS J1522+2910 | 19.534 | 0.046 | 0.890 ± 0.002 | 0.579 ± 0.001 | 130.3 ± 0.1 | E-M-A |
| SDSS J1537+0220 | 19.682 | 0.111 | 0.386 ± 0.001 | 0.694 ± 0.001 | 52.9 ± 0.1 | E-S-C |
| SDSS J1541+1812 | 19.648 | 0.064 | 0.759 ± 0.002 | 0.755 ± 0.002 | 151.3 ± 0.2 | L-S-A |
| SDSS J1542+1629 | 18.580 | 0.054 | 0.726 ± 0.001 | 0.786 ± 0.001 | 89.5 ± 0.1 | E-S-A |
| SDSS J1545+2748 | 18.594 | 0.050 | 2.589 ± 0.005 | 0.661 ± 0.001 | 105.2 ± 0.1 | E-S-A |
| SDSS J1601+2138 | 19.712 | 0.127 | 0.436 ± 0.001 | 0.960 ± 0.001 | 110.5 ± 1.0 | E-S-A |
| SDSS J1611+1705 | 19.611 | 0.085 | 0.998 ± 0.002 | 0.926 ± 0.002 | 28.4 ± 0.9 | L-S-A |
| SDSS J1615+2056 | 18.193 | 0.146 | 5.399 ± 0.016 | 0.899 ± 0.002 | 145.8 ± 0.8 | E-S-X |
| SDSS J1618+1930 | 19.944 | 0.099 | 0.429 ± 0.001 | 0.513 ± 0.001 | 9.2 ± 0.1 | L-S-X |
| SDSS J1627+1910 | 19.477 | 0.089 | 0.360 ± 0.000 | 0.661 ± 0.001 | 101.6 ± 0.1 | E-S-X |
| SDSS J1631+1854 | 17.859 | 0.079 | 1.434 ± 0.001 | 0.929 ± 0.001 | 166.7 ± 0.3 | E-S-A |
| SDSS J1637+1439 | 19.147 | 0.093 | 1.037 ± 0.002 | 0.674 ± 0.001 | 122.9 ± 0.1 | L-S-A |
| SDSS J2122+0409 | 19.501 | 0.147 | 0.903 ± 0.002 | 0.819 ± 0.002 | 136.6 ± 0.3 | E-S-A |
| SDSS J2125+0411 | 18.271 | 0.150 | 0.901 ± 0.001 | 0.689 ± 0.001 | 111.0 ± 0.1 | E-S-A |
| SDSS J2303+0037 | 18.721 | 0.081 | 1.349 ± 0.002 | 0.760 ± 0.001 | 84.4 ± 0.1 | E-S-A |
Notes. Column 1 provides the SDSS system name in terms of truncated J2000 R.A. and decl. in the format HHMM±DDMM. Column 2 provides HST-ACS I814-band apparent magnitudes based on flat-weighted de Vaucouleurs models and are quoted in the AB system (Oke & Gunn 1983) without correction for Galactic extinction. Column 3 provides Schlegel et al. (1998) Galactic extinction values that should be subtracted from the apparent magnitudes of Column 2 to give dust-corrected magnitudes. Column 4 provides de Vaucouleurs model intermediate axis effective radii. Column 5 provides axis ratios of minor to major axes, B/A, for the de Vaucouleurs models. Column 6 provides the major axis position angles for the de Vaucouleurs models, measured east from north. Column 7 provides our classification denoting (1) foreground-galaxy morphology, (2) foreground-galaxy multiplicity, and (3) status of system as a lens based on available data. Morphology is coded by "E" for early-type (elliptical and S0), "L" for late-type (Sa and later), and "U" for unclassified (galaxies that cannot be unambiguously classed as early- or late-type based on the HST-ACS I814-band data). Multiplicity is coded by "S" for single and "M" for multiple. Lens grades, as justified in Table 4, are coded by "A" for systems with clear and convincing evidence of multiple imaging, "B" for systems with strong evidence of multiple imaging but insufficient S/N for definite conclusion and/or modeling, "C" for systems with evidence of imaging such as single arcs or likely background features, but without detected counterimages, and "X" for all other systems (non-lenses).
Download table as: ASCIITypeset image
Figure 3 shows that the distribution of grade-A lenses in HST I814-band magnitudes is similar to that of the SLACS sample, lying at higher redshifts, but within the same stellar mass range of 1011 M☉ ≲ M⋆ ≲ 1012 M☉. The distribution in the ratio θE/Reff of the Einstein radius to the lens effective radius as a function of the lens redshift is shown in Figure 4. The BELLS sample extends the SLACS sample to a wider range of θE/Reff while still providing substantial overlap with the range of ratios seen in the SLACS sample.

Figure 3. Distribution of confirmed SLACS and BELLS lens HST I814-band magnitudes, shown as a function of lens redshift. SLACS lenses are shown with red squares, and BELLS lenses are shown with blue diamonds. Stellar masses are indicated by the 1011 M☉ upper track and 1012 M☉ lower track with black dashed lines, based upon the stellar population model of Maraston et al. (2009).
Download figure:
Standard image High-resolution image
Figure 4. Distribution of the ratio between the Einstein radii and the effective radii, as a function of lens redshift. SLACS lenses are shown with red squares, and BELLS lenses are shown with blue diamonds.
Download figure:
Standard image High-resolution imageEach of the HST-ACS I814-band images was visually inspected to classify all targets for multiplicity and morphology. Systems with two or more foreground galaxies of comparable luminosity are classified as "multiple," while systems with only a single-dominant foreground galaxy are classified as "single." Morphological classification is limited to the categories of "early-type" (elliptical and S0), "late-type" (Sa and later spirals), and "unclassified" (generally ambiguous between S0 and Sa). The classification of observed candidates into lenses and non-lenses is made by visual examination of the direct and B-spline model-subtracted residuals, based on the appearance of arcs, rings, and multiple images centered on the position of the foreground galaxy. Our classification is provided in the Table 3, with our justifications for BELLS confirmed lenses provided in Table 4.
Table 4. BELLS Confirmed Gravitational Lenses
| System Name | Grade | Justification |
|---|---|---|
| (1) | (2) | (3) |
| SDSS J0151+0049 | A | Simple single component source, lensed into a well-modeled arc in the southeast and a counterimage. |
| SDSS J0747+5055 | A | Image and counterimage are connected in partial Einstein ring, with an additional blob to the west. |
| SDSS J0747+4448 | A | Well-modeled 3 + 1 quad with a faint but definite counterimage, and a compact single source component. |
| SDSS J0801+4727 | A | Complex source structure with multiple arcs and counterarcs. |
| SDSS J0830+5116 | A | Arc with a compact core to the northwest and with a clear counterimage. |
| SDSS J0944−0147 | A | Well-modeled arc and counterarc, with a matching tail feature. |
| SDSS J1159−0007 | A | Well-modeled arc and counterimage with detailed small-scale features. |
| SDSS J1215+0047 | A | Well-modeled double with detailed feature correspondence between the image and the counterimage. |
| SDSS J1221+3806 | A | Well-modeled arc and counterarc. The features are diffuse but significant. |
| SDSS J1234−0241 | A | Clear image and counterimage. Possible foreground subtraction artifacts affect the counterimage in the north due to proximity to the lens center. Fixing the mass axis ratio to the light axis ratio increases model θE by 003. |
| SDSS J1318−0104 | A | Well-modeled compact arc and counterimage. |
| SDSS J1337+3620 | A | Well-modeled extended arc with a compact counterimage. |
| SDSS J1349+3612 | A | Well-modeled arc and a compact counterimage. Lens galaxy has a slightly disturbed morphology in its core. |
| SDSS J1352+3216 | A | Double image lens with detailed feature correspondence reproduced by the pixelized source plane model. |
| SDSS J1522+2910 | A | Double image lens with feature correspondence. |
| SDSS J1541+1812 | A | Well-modeled compact double. Diffuse component to the west reproduced by the pixelized model. |
| SDSS J1542+1629 | A | Well-modeled arc and counterarc. |
| SDSS J1545+2748 | A | Complex quad/double transition. The detailed features are reproduced by the pixelized model. |
| SDSS J1601+2138 | A | Well-modeled compact image and counterimage. |
| SDSS J1611+1705 | A | Double image lens with feature correspondence. |
| SDSS J1631+1854 | A | Spectacular high surface-brightness Einstein ring with multiple source components. |
| SDSS J1637+1439 | A | Well-modeled arc and counterarc. |
| SDSS J2122+0409 | A | Well-modeled arc and counterarc with individual knots that are reproduced by the pixelized source model. |
| SDSS J2125+0411 | A | Extended arc and counterarc with detailed substructure reproduced by the pixelized source model. |
| SDSS J2303+0037 | A | Clear 3 + 1 quad morphology. There is a galaxy group 10'' to the east that may contribute shear at the lens position and account for the model shortcomings. |
| SDSS J0915−0055 | B | Plausibly modeled image and counterimage, including substructure reproduced by the pixelized source model. Classified grade-B because of the low surface brightness and the significant bright star light contamination in the south. |
| SDSS J1452+3323 | B | Very faint possible Einstein-ring features, but the surface brightness and S/N are too low for modeling. |
| SDSS J1503+3225 | B | Very plausible image–counterimage pair to the northwest and southeast, with detailed feature correspondence, but the group environment of the lens complicates modeling and interpretation. |
| SDSS J0821+3733 | C | Likely background features seen in the residual image, but no counterimages. |
| SDSS J0840+5051 | C | Likely background features seen in the residual image, but no counterimages. |
| SDSS J0841+5017 | C | Extended source to south inconsistent with the compact source to the north as image–counterimage pair. |
| SDSS J0941−0104 | C | Clear distorted arc, but no detected counterimage. |
| SDSS J1016−0208 | C | Tangentially elongated image to the northeast with no detected counterimage. |
| SDSS J1039−0014 | C | Disky late-type structure with lensed arc to the east, but no apparent counterimage. |
| SDSS J1344+3258 | C | Clear evidence of background galaxy to the west, but no evidence of a counterimage. |
| SDSS J1537+0220 | C | Pronounced asymmetry in the lens-galaxy brightness profile; plausible background-galaxy arc to the southwest, but no evidence of a counterimage. |
Notes. Column 1 provides the SDSS system name in terms of truncated J2000 R.A. and decl. in the format HHMM±DDMM. Column 2 provides our lens grade, coded by "A" for the 25 systems with clear and convincing evidence of multiple imaging, "B" for the three systems with strong evidence of multiple imaging but insufficient S/N for definite conclusion and/or modeling, and "C" for the eight systems with evidence of imaging such as single arcs or likely background features, but without detected counterimages. Column 3 provides our lens-grade justification. SIE model parameters for the grade-A lenses are listed in Table 5. The remainder of the observed sample, listed in Table 6, receives a grade of "X" (non-lenses).
Download table as: ASCIITypeset image
5. STRONG-LENSING ANALYSIS
Figure 2 shows the foreground-subtracted images of each BELLS target that completed the ACSPROC image reduction process described in Section 3. These are the lensed features which remain after the foreground galaxy has been subtracted. This image is passed forward to the lens modeling stage as the zeroth extension of a BIZZLE FITS file. In addition, the inverse variance of the foreground-subtracted image, the lensed features mask, the mask for extraneous unlensed features, and the HST ACS-WFC PSF are included in successive FITS extensions. The best-fit B-spline model parameters of the foreground galaxy are included in the FITS header so that the center of the lens model may be constrained by the luminous distribution, and so that the ellipticity of the visible galaxy may be used to initialize the lens model. These BELLS BIZZLE files are input into our ACSLENS software, implemented in the Python programming language, which accommodates the SIE lens model (Kassiola & Kovner 1993; Kormann et al. 1994; Keeton & Kochanek 1998) and both parametric or pixelized source models.
The SIE model is a two-dimensional potential of similar concentric and aligned elliptical isodensity contours, with axis ratio qSIE. The projected surface density of the SIE falls off as 1/R and the model provides flat galaxy rotation curves. The model is parameterized by its angular Einstein radius, θE, which is related to the physical mass model through
where σSIE is a velocity-dispersion parameter and DLS and DS are cosmological angular diameter distances from lens and observer to source, respectively. We adopt the intermediate axis normalization of Kormann et al. (1994), whereby the mass within a given isodensity contour remains constant at fixed θE for changing qSIE.
We attempt to model all candidate lenses with an SIE lens-mass model and a parametric source-plane surface-brightness model, where the source may be composed of either single or multiple Gaussian, de Vaucouleurs (1948) or Sérsic (1968) distributions, as necessary to obtain a good (χ2) fit. The model lensed image is generated by ray-tracing through the analytic SIE mass model and then convolved with the HST ACS-WFC PSF. After choosing reasonable initial parameter values, the SIE and source-plane model parameters are optimized nonlinearly with the leastsq Levenberg–Marquardt implementation in the scipy.optimize package. In the SIE mass-model optimization, the mass centroid is fixed to the centroid of the luminous distribution as determined from the B-spline lens-galaxy photometric analysis, while the SIE strength, axis ratio, and major axis position angle are all allowed to vary. The final outcome is a set of lens-model and source-component parameters, along with a model for the lensed images.
Our best-fit parametric source model is then complemented with a pixelized source plane model, which we compute through a matrix inversion including linear regularization, without re-optimizing the lens model (Warren & Dye 2003; Treu & Koopmans 2004; Wayth & Webster 2006; Koopmans et al. 2006).
If necessary to obtain a better correspondence between the parametric and pixelized model images, the apparent multiplicity and spatial orientation of the pixelized source distribution are used to place additional Sérsic sources, and then the parametric model is re-optimized together with the SIE mass-model parameters. Several iterations are pursued until the parametric and pixelized models are in reasonable agreement. Although we do not use the pixelized models in the lens model optimization, their ability to capture more detail in the lensed galaxies serves as an important confirmation of the lensing hypothesis in most cases.
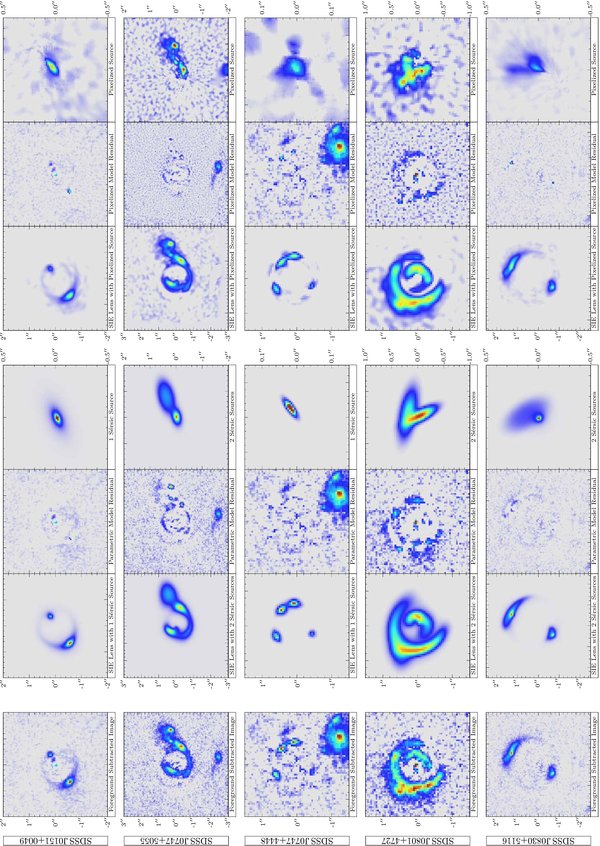
Our best-fit SIE lens models with Sérsic source models, along with our pixelized source models, are presented in Figure 5, and the best-fit model parameters are listed in Table 5. Our justifications for the BELLS confirmed lenses grading are provided in Table 4.
Download figure:
Standard image High-resolution image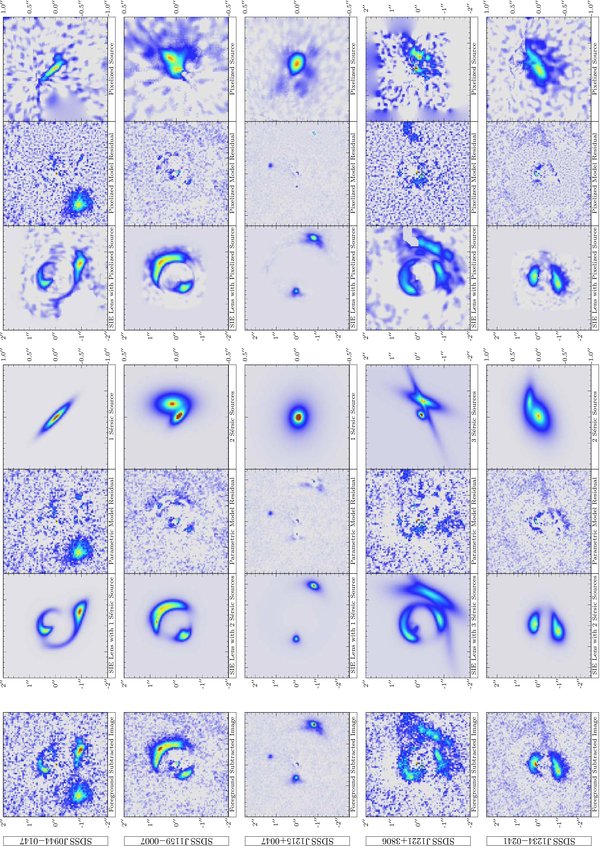
Download figure:
Standard image High-resolution image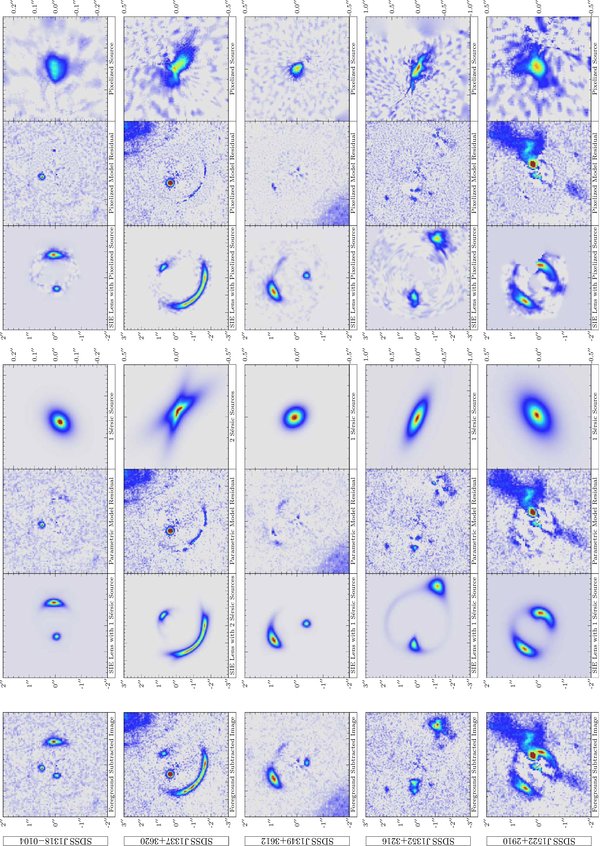
Download figure:
Standard image High-resolution image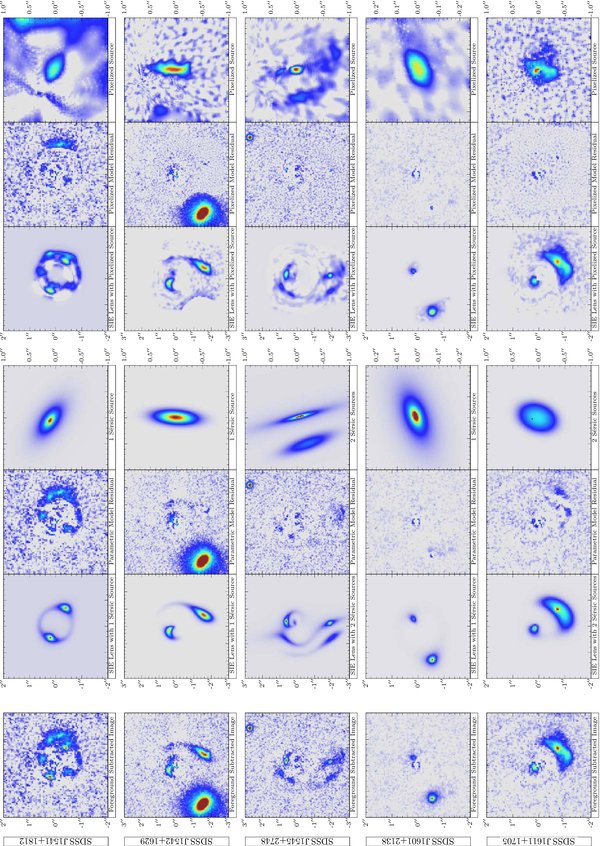
Download figure:
Standard image High-resolution image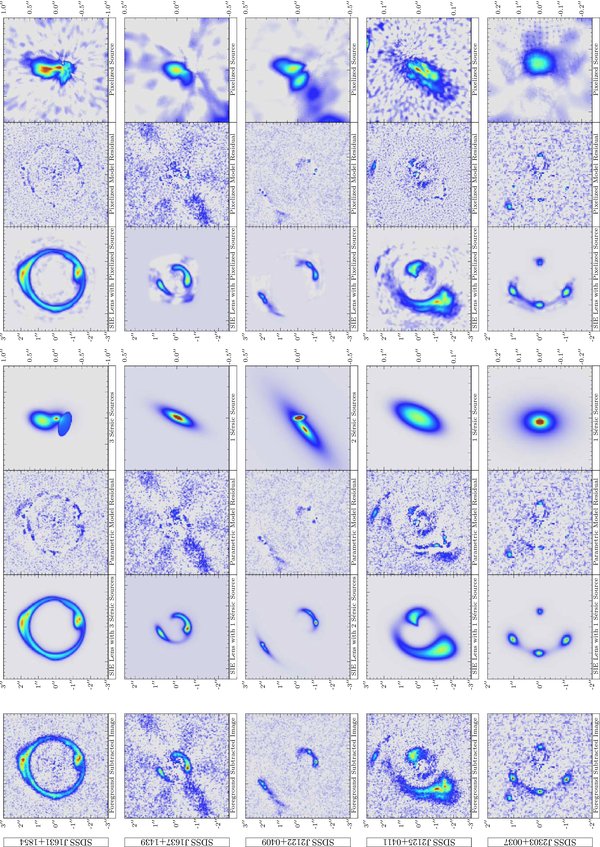
Figure 5. SIE lens models with Sérsic source models as compared to pixelized source models. SIE lens models are shown for each of the 25 confirmed-to-date grade-A lenses discovered under HST cycle 18 program ID GO-12209. For each system, the left panel shows the lensed features which remain after foreground-galaxy subtraction by the B-spline method described in Section 3, repeated from the rightmost panel of Figure 2. Best-fit SIE models with Sérsic sources are shown in the second panel from the left, including the residuals of the data minus the parametric model in the third panel, with the de-lensed Sérsic source model shown in the fourth panel, at a scale optimized for the source plane. Best-fit SIE model parameters are provided in Table 5. SIE models with pixelized sources are shown in the fifth panel from the left, including the residuals of the data minus the pizelized model in the sixth panel, with the de-lensed pixelized source model shown in the rightmost panel, at the same scale as used for the parametric source model. Comments justifying our lens grade are provided in Table 4. The color scale is provided in Figure 2.
Download figure:
Standard image High-resolution imageTable 5. BELLS Grade-A Strong-lens SIE Model Parameters
| System Name | θE ('') | qSIE | P.A. (°) | NS | m814 | μ |
|---|---|---|---|---|---|---|
| (1) | (2) | (3) | (4) | (5) | (6) | (7) |
| SDSS J0151+0049 | 0.676 | 0.752 | 111.0 | 1 | 22.51 | 8.71 |
| SDSS J0747+5055 | 0.754 | 0.641 | 4.9 | 2 | 21.46 | 2.95 |
| SDSS J0747+4448 | 0.610 | 0.723 | 147.1 | 1 | 23.77 | 39.72 |
| SDSS J0801+4727 | 0.491 | 0.891 | 41.1 | 2 | 22.07 | 3.82 |
| SDSS J0830+5116 | 1.142 | 0.887 | 137.0 | 2 | 21.89 | 7.43 |
| SDSS J0944−0147 | 0.725 | 0.922 | 108.4 | 1 | 23.29 | 5.09 |
| SDSS J1159−0007 | 0.683 | 0.815 | 125.3 | 2 | 21.92 | 9.46 |
| SDSS J1215+0047 | 1.368 | 0.742 | 123.2 | 1 | 21.25 | 3.69 |
| SDSS J1221+3806 | 0.699 | 0.745 | 91.4 | 3 | 22.50 | 3.43 |
| SDSS J1234−0241 | 0.533 | 0.279 | 77.7 | 2 | 21.92 | 2.56 |
| SDSS J1318−0104 | 0.679 | 0.836 | 105.2 | 1 | 22.87 | 6.13 |
| SDSS J1337+3620 | 1.386 | 0.682 | 137.4 | 2 | 21.71 | 11.55 |
| SDSS J1349+3612 | 0.750 | 0.711 | 177.5 | 1 | 22.06 | 4.79 |
| SDSS J1352+3216 | 1.823 | 0.859 | 115.2 | 1 | 21.97 | 5.65 |
| SDSS J1522+2910 | 0.736 | 0.741 | 143.7 | 1 | 22.24 | 5.55 |
| SDSS J1541+1812 | 0.640 | 0.927 | 142.4 | 1 | 23.80 | 9.76 |
| SDSS J1542+1629 | 1.042 | 0.806 | 105.6 | 1 | 22.32 | 3.28 |
| SDSS J1545+2748 | 1.210 | 0.418 | 99.0 | 2 | 22.58 | 4.35 |
| SDSS J1601+2138 | 0.858 | 0.906 | 164.6 | 1 | 22.84 | 3.50 |
| SDSS J1611+1705 | 0.580 | 0.740 | 4.3 | 2 | 22.13 | 2.27 |
| SDSS J1631+1854 | 1.634 | 0.878 | 35.3 | 3 | 20.41 | 19.15 |
| SDSS J1637+1439 | 0.650 | 0.750 | 122.5 | 1 | 22.99 | 10.65 |
| SDSS J2122+0409 | 1.580 | 0.634 | 119.7 | 2 | 22.31 | 5.73 |
| SDSS J2125+0411 | 1.204 | 0.821 | 83.0 | 1 | 21.11 | 4.32 |
| SDSS J2303+0037 | 1.016 | 0.391 | 88.8 | 1 | 23.10 | 8.06 |
Notes. The method used to compute the best-fit SIE model parameters is described in Section 5. Column 1 provides the SDSS system name in terms of truncated J2000 R.A. and decl. in the format HHMM±DDMM. Column 2 provides the best-fit SIE model Einstein radius. Column 3 provides the best-fit minor to major axis ratio for the SIE models. Column 4 provides the major axis position angle for the SIE models, measured east from north. Column 5 provides the number of Sérsic models added to the source plane to provide the best fit. Column 6 provides the I814-band magnitude of the lensed source. Column 7 provides the magnification of the lensed source.
Download table as: ASCIITypeset image
6. SUMMARY AND CONCLUSIONS
We present 44 of the 45 targets observed-to-date in the BELLS from the HST ACS-WFC cycle 18 program ID GO-12209 imaging program. The BELLS catalog presently includes 25 grade-A strong galaxy–galaxy lenses complete with lens and source redshifts, I814-band foreground-galaxy photometry, and SIE models. This represents a significant expansion of the SLACS survey, extending the lens redshifts to zL ≃ 0.66, and with source redshifts extended to zS ≃ 1.52. The combined SLACS and BELLS catalog provides a homogeneous sample of strong-lens galaxies at significant cosmological look-back times. Future papers in this series will apply the combined SLACS and BELLS samples to the analysis of the structure and evolution of massive elliptical galaxies.
We have described the use of our ACSPROC HST ACS-WFC image processing software to make luminosity measurements and to produce our BIZZLE data product. We then analyze the BIZZLE data using our ACSLENS lens-modeling software to make parameterized and pixelized lens models. Our analysis demonstrates that simple SIE lens models, combined with multiple Sérsic ellipsoid models of the lensed background galaxies, can reproduce the lensed image configurations in great detail, and our pixelized source models reproduce more detailed features in the lensed images and add finer structure to the de-lensed source model.
The high success rate of our HST imaging program demonstrates that the spectroscopic strong-lens selection methodology can be successfully applied to the BOSS spectroscopic database even though BOSS is targeting a more distant—and hence fainter—galaxy population than SDSS-I. The probability of finding a galaxy–galaxy lens using the spectroscopic discovery method was considered in Dobler et al. (2008) for the SLACS survey, including selection effects such as the finite size of the spectroscopic fiber (which selects against large separation lenses), and the effectiveness of spectral noise modeling (which selects against sources that have redshifted emission lines coincident with strong emission lines in the sky). The probability that a galaxy–galaxy lens would be spectroscopically discovered from either the SDSS-I or SDSS-III spectra, and lead to a confirmed lens, is under consideration in R. Arneson et al. (2011, in preparation) using a Monte Carlo simulation to measure the effects of variation in the lens mass, ellipticity, and morphology, source extent, and the logarithm slope of the lens luminosity profile.
The strong-lensing measurements presented in this work afford a unique opportunity to test the results of theoretical models and numerical simulations of galaxy formation, merging, and evolution. This is due to the fact that strong-lensing measures the projected mass inside the aperture defined by the Einstein radius, in a nearly model-independent sense, and without need for modeling of stellar populations and luminosity evolution.
In comparison with the SDSS-I spectra of the SLACS lens sample, the BOSS spectra for the BELLS sample have significantly lower signal to noise. Hence, the resulting velocity-dispersion measurements for the BELLS sample are correspondingly noisier and more care must be taken in interpreting these measurements in the context of dynamical galaxy modeling. Work in preparation will present a joint analysis of all BELLS lenses that marginalizes over the full velocity-dispersion likelihood function for individual spectra (see Shu et al. 2011). Deeper spectroscopy with large ground-based telescopes can provide more precise stellar velocity-dispersion measurements.
We note that the BOSS spectroscopic database as of summer 2011, which will constitute the ninth SDSS public data release (DR9), contains 819 unique BOSS plates with an average of approximately 600 successfully redshifted galaxies per plate. (The increase in the number of spectroscopically confirmed galaxies per plate was produced by a combination of improvements in targeting, hardware, operations, and analysis software during the BOSS commissioning phase and early operations.) Thus, DR9 is at least a fourfold increase over the sample we used here. The final BOSS sample, to be completed in mid-2014 and released at the end of that year, will be an order of magnitude increase over the sample used here. In addition, ongoing BOSS spectroscopic pipeline development (including implementation of the two-dimensional PSF-based extraction algorithm of Bolton & Schlegel 2010) continues to increase the quality of the reduced spectra and redshift/classification analysis for BOSS significantly. Hence, there will be at least several hundred strong lenses to be found in BOSS spectroscopy at the end of the survey, offering the possibility of measuring the cosmic evolution of the relationship between mass-density structure and stellar mass, luminosity, and rest-frame color, in great quantitative detail.
Support for program 12209 was provided by NASA through a grant from the Space Telescope Science Institute, which is operated by the Association of Universities for Research in Astronomy, Inc., under NASA contract NAS 5-26555. This work has made extensive use of the Baryon Oscillation Spectroscopic Survey, part of the Sloan Digital Sky Survey III (SDSS-III). Funding for SDSS-III has been provided by the Alfred P. Sloan Foundation, the Participating Institutions, the National Science Foundation, and the U.S. Department of Energy Office of Science. The SDSS-III Web site is http://www.sdss3.org/. SDSS-III is managed by the Astrophysical Research Consortium for the Participating Institutions of the SDSS-III Collaboration including the University of Arizona, the Brazilian Participation Group, Brookhaven National Laboratory, University of Cambridge, University of Florida, the French Participation Group, the German Participation Group, the Instituto de Astrofisica de Canarias, the Michigan State/Notre Dame/JINA Participation Group, Johns Hopkins University, Lawrence Berkeley National Laboratory, Max Planck Institute for Astrophysics, New Mexico State University, New York University, Ohio State University, Pennsylvania State University, University of Portsmouth, Princeton University, the Spanish Participation Group, University of Tokyo, University of Utah, Vanderbilt University, University of Virginia, University of Washington, and Yale University. J.R.B. and A.S.B. acknowledge the hospitality of the Max-Planck-Institut für Astronomie, where a portion of this work was completed. C.S.K. is supported by NSF grant AST-1004756.
APPENDIX
The combined and rectified stacked images for the grade-X systems are included in Figure 6 for completeness. Table 6 gives the comments justifying the lens grade of "X".
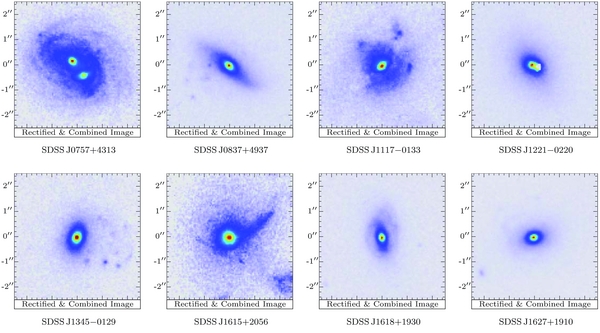
Figure 6. BELLS grade-X non-lens galaxies. The eight non-lenses, discovered to-date under HST cycle 18 program ID GO-12209, Table 2 presents their properties as derived from the BOSS data, and Table 3 presents those derived from the HST data. For each system, the panel shows the HST ACS-WFC F814W rectified and combined images with north up and east to the left. Comments justifying the lens grade of "X" are provided in Table 6. The color scale is provided in Figure 2.
Download figure:
Standard image High-resolution image
Table 6. BELLS Grade-X Non-lens Galaxies
| System Name | Justification |
|---|---|
| (1) | (2) |
| SDSS J0757+4313 | Two components with spiral structure; any lensing features are difficult to disentangle. |
| SDSS J0837+4937 | Late-type with faint candidate features, but with no evidence of multiple imaging. |
| SDSS J1117−0133 | Pronounced asymmetry in the foreground galaxy plus possible spiral and dust features. Possible lensed background sources cannot be unambiguously modeled given single-band imaging. |
| SDSS J1221−0220 | Double nucleus in the foreground galaxy, with no evidence of background-galaxy features. |
| SDSS J1345−0129 | Faint possible background-galaxy features to the west, but without plausible evidence of strong lensing. |
| SDSS J1615+2056 | Possible candidate arc extending to the northwest and to the east, but the system is difficult to interpret as a lens. |
| SDSS J1618+1930 | No obvious background features, but spiral structure and/or dust in the foreground galaxy complicates interpretation. |
| SDSS J1627+1910 | Possible faint background-galaxy features to the northeast, but without evidence of strong lensing. |
Notes. Column 1 provides the SDSS system name in terms of truncated J2000 R.A. and decl. in the format HHMM±DDMM. Column 2 provides our justification for the lens grade of "X" (non-lenses).
Download table as: ASCIITypeset image
Footnotes
- *
Based on observations made with the NASA/ESA Hubble Space Telescope, obtained at the Space Telescope Science Institute, which is operated by the Association of Universities for Research in Astronomy, Inc., under NASA contract NAS 5-26555. These observations are associated with program 12209. Based on spectroscopic data from the Baryon Oscillation Spectroscopic Survey of the Sloan Digital Sky Survey III.