


ABSTRACT
Tidal debris around galaxies can yield important clues on their evolution. We have identified tidal debris in 11 early-type galaxies (T ⩽ 0) from a sample of 65 early types drawn from the Spitzer Survey of Stellar Structure in Galaxies (S4G). The tidal debris includes features such as shells, ripples, and tidal tails. A variety of techniques, including two-dimensional decomposition of galactic structures, were used to quantify the residual tidal features. The tidal debris contributes ∼3%–10% to the total 3.6 μm luminosity of the host galaxy. Structural parameters of the galaxies were estimated using two-dimensional profile fitting. We investigate the locations of galaxies with tidal debris in the fundamental plane and Kormendy relation. We find that galaxies with tidal debris lie within the scatter of early-type galaxies without tidal features. Assuming that the tidal debris is indicative of recent gravitational interaction or merger, this suggests that these galaxies have either undergone minor merging events so that the overall structural properties of the galaxies are not significantly altered, or they have undergone a major merging events but already have experienced sufficient relaxation and phase mixing so that their structural properties become similar to those of the non-interacting early-type galaxies.
1. INTRODUCTION
Early-type galaxies (ETGs) used to be regarded as relatively simple, quiescent stellar systems undergoing passive evolution with little or no star formation. Various studies, however, indicate that the histories of ETGs may be more complex. Following the suggestion that most field elliptical galaxies may be the result of merging of disk galaxies (Toomre 1977), numerous observational studies have shown that many ETGs have faint features or disturbances around them that are suggestive of recent interactions. In particular, many ETGs show tidal features such as "shells" (Malin & Carter 1980), "ripples" (Schweizer 1980), or distinctive tidal tails (Arp 1966; Malin & Carter 1983; Fort et al. 1986; Schweizer & Seitzer 1992; Michard & Prugniel 2004; van Dokkum 2005; Canalizo et al. 2007; Bennert et al. 2008; Tal et al. 2009; Janowiecki et al. 2010). Although some shells are slightly bluer or redder than the underlying galaxies, most shell colors are found to be similar to those of their underlying galaxies (Fort et al. 1986; Forbes et al. 1995b; Turnbull et al. 1999; Sikkema et al. 2007). On the other hand, tidally disturbed ETGs are on average bluer than non-interacting ETGs and the more tidally disturbed, the bluer galaxies are (Schweizer & Seitzer 1992; Michard & Prugniel 2004; Tal et al. 2009).
There have been various studies on the formation of shells. Numerical simulations of galaxy mergers of unequal mass, mass ratio of 1/10–1/100 (i.e., minor mergers), produce shells (Quinn 1984; Dupraz & Combes 1986; Hernquist & Quinn 1987a, 1987b). In these simulations, shells are density waves from infalling stars of a low-mass and low-velocity dispersion companion galaxy during a merging event. Major merger models (mergers of comparable mass galaxies) can also form shells (Hernquist & Spergel 1992; Hibbard & Mihos 1995). In these cases, the outer disk material of the pre-merger spiral falls into the merged remnant late, long after the inner region of the remnant has relaxed in the merging event (Hernquist & Spergel 1992). A weak interaction model (Thomson & Wright 1990; Thomson 1991) is also able to produce long-lasting (∼10 Gyr), azimuthally distributed shell structures by the interference of density waves. In this scenario, the shell material does not originate from a companion galaxy, but comes from the thick disk population of dynamically cold stars of the galaxy. This is an unexpected result because galaxies that have a disk component should have been classified as S0s, rather than elliptical. Thus, it was difficult to explain the formation of shells in elliptical galaxies with a weak interaction model. But using two-dimensional stellar kinematics, SAURON (Bacon et al. 2001) and ATLAS3D (Cappellari et al. 2011a) studies have found that ETGs can be divided into two kinematically distinct families, slow and fast rotators (Emsellem et al. 2007, 2011). Fast rotators show large-scale rotation, while slow rotators show regular velocity field without large-scale rotation. These classifications are nearly insensitive to viewing angles. Emsellem et al. (2011) show that 66% (45/68) of elliptical galaxies are fast rotators, which implies that they might have a disk component even though they were classified as ellipticals. Thus, at least in this fraction of elliptical galaxies, shells might be formed via weak interaction as well as via major or minor mergers.
Van Dokkum (2005) reports that as many as 71% (61/86) of bulge-dominated ETGs in the NOAO Deep Wide-Field Survey at 〈z〉 ∼ 0.1 show morphological evidence of tidal interactions. A similar result was obtained by Tal et al. (2009), who found that 73% (40/55) of nearby (15–50 Mpc) elliptical galaxies show such features. With deep V-band imaging data, Janowiecki et al. (2010) investigated the five brightest elliptical galaxies in the Virgo Cluster and found that except for M84, all showed shells and diffuse tidal streams in their outer halos, in the range μV = 26–29 mag arcsec−2. At slightly higher redshifts, 〈z〉 ∼ 0.15–0.20, Bennert et al. (2008) studied the merger remnants of five early-type quasi-stellar object (QSO) host galaxies and found tidal tails and shells in four of them. These studies suggest that many elliptical galaxies have undergone recent mergers or interactions, consistent with Toomre's (1977) suggestion. What remains less well known is the amount of stellar mass in the tidal debris around ETGs. Prieur (1988) investigated a shell galaxy, NGC 3923, using B-band images and found that the B-band luminosity of the shell contributes about 5% of the galaxy luminosity. Bennert et al. (2008) also investigated the luminosity of shells in four early-type QSO host galaxies with Hubble Space Telescope (HST) V-band F606W images and estimated that shells comprise about 5%–10% of the total V-band luminosity of each galaxy. The current study aims to measure the stellar mass fraction of the tidal debris using mid-infrared data at 3.6 μm from the Spitzer Survey of Stellar Structure in Galaxies (S4G; Sheth et al. 2010).
A second aim of this paper is to understand whether the recent merger or interaction, as revealed by the presence of tidal debris, has affected the overall structural properties of the galaxy itself. Kormendy (1977) showed that elliptical galaxies and the bulges of S0 galaxies both have correlations between effective radius and surface brightness (Kormendy relation, hereafter KR). In addition, ETGs are known to follow empirical scaling relations between the effective radius, the surface brightness, and the central velocity dispersion, referred to as the fundamental plane (hereafter FP; Dressler et al. 1987; Djorgovski & Davis 1987) or the fundamental manifold (Zaritsky et al. 2006, 2008) if one extends FP formalism to lower or higher masses from dwarf spheroidal galaxies up to intracluster stellar populations of galaxy cluster. But not all ETGs lie on the FP; post-starburst galaxies (E+A's) are one example of galaxies that do not (Yang et al. 2008). Similar to ETGs, E+A galaxies have large bulge to total luminosity ratios, large Sérsic indices, high concentration indices and a lack of on-going star formation, but have significantly larger asymmetry indices. However, these galaxies do not lie on the same FP with ETGs and follow their own relation, a tilted FP (Yang et al. 2008). Yang et al. (2008) showed that 55% (11/21) of their E+A galaxies have dramatic tidal features, indicative of a recent merger/interaction. There might be two possible explanations for the offsets from the standard FP: changes in the structure, and/or changes in the underlying stellar populations. Through gas-poor ("dry") merging events, galaxies can increase their half-light radius (Nipoti et al. 2003; Boylan-Kolchin et al. 2006; Naab et al. 2009; van der Wel et al. 2009; Hopkins et al. 2009) and their structural properties change and they may lie off from the FP of normal ETGs. On the other hand, changes in the stellar populations due to star formation via gas-rich ("wet") merging events may cause galaxies to have smaller mass-to-light ratios (M/L) and thus deviate from the standard FP. For example, E+A galaxies are found to have 3.8 times smaller M/L (Yang et al. 2008) and stand apart from the standard FP. As tidal debris and shells around ETGs are indicative of recent merger or interaction, there might be changes in structure of those ETGs. Therefore, we also address whether the ETGs with shells and tidal debris lie off the FP and/or KR.
The paper is organized as follows. In Section 2, we describe the data and data analysis techniques. Then, we describe galaxies showing shells, tidal debris, and the fraction of tidally disturbed galaxies in ETGs in Section 3. The luminosities of the tidal debris are presented and discussed in Section 4, and structural properties, KR, and FP of tidally disturbed ETGs are explored in Section 5. Finally, we summarize our results and state our conclusions in Section 6. Throughout this paper, we adopt H0 = 73 km s−1 Mpc−1, Ωm = 0.27, and ΩΛ = 0.73 when estimating distances.
2. OBSERVATIONS AND DATA ANALYSIS
2.1. Data
S4G is one of the 10 large Exploratory Science programs underway in the Spitzer post-cryogenic mission. The overall goal of S4G is to image over 2300 nearby galaxies at 3.6 and 4.5 μm through new "Warm" observations obtained with the Infrared Array Camera (IRAC; Fazio et al. 2004) instrument on the Spitzer Space Telescope (Werner et al. 2004). These data will add to the existing data of galaxies from the Spitzer Heritage Archive. S4G sample galaxies have radial velocity Vradio < 3000 km s−1 corresponding to d < 40 Mpc, a total corrected blue magnitude, mBcorr < 15.5 mag, and blue light isophotal angular diameter D25 > 1', while |b| > 30°. The S4G data are probing down to stellar surface densities <1 M☉ pc−2. The azimuthally averaged surface brightness profiles typically trace isophotes down to μ3.6 μm > 27 (AB) mag arcsec−2. All of the images are processed using the S4G pipeline (see details in Sheth et al. 2010). The resulting pixel scale of S4G image is 0 75 pixel−1 and the typical FWHM of the point-spread function (PSF) is 17. Using the zero magnitude flux at 3.6 μm, 280.9 Jy, as indicated in the IRAC Instrumental Handbook, 3.6 μm AB magnitude can be converted from 3.6 μm Vega magnitude using the following equation:

To identify tidal features in ETGs, we first chose ETGs from S4G using their numerical Hubble type T (de Vaucouleurs et al. 1992), which was obtained from Hyperleda (Paturel et al. 2003). We selected ETGs with T less than or equal to 0, and thus our sample includes both ellipticals and S0s. Note that although S4G surveys volume-, magnitude-, and size-limited samples, there is a caveat especially on the completeness of ETG samples. Since S4G chose galaxies with radial velocity VHI < 3000 km s−1 for sample selection, S4G misses gas-poor faint and small ETGs. We draw and analyze an initial set of 65 ETGs that were available at the moment of this pilot study, of which 34 are from the cryogenic mission archival data and 31 are newly obtained during the post-cryogenic phase of Spitzer. The basic properties of the 65 ETGs are listed in Table 1. Our sample consists of 16 ellipticals (T < −3.5; criteria adopted from Paturel et al. 2003 and Emsellem et al. 2011) and 49 S0s (−3.5 ⩾ T ⩽ 0). There will be 180 ETGs in the complete sample of 2300 S4G galaxies. ETGs with tidal debris presented in this study are located at distance between 20 and 43 Mpc, so the typical PSF (17) corresponds to a linear scale of 170–350 pc.
Table 1. Catalog of Parent Sample of Early-type Galaxies
| Object | T-type | Morphology | D25 | BT | MB | vrad |
|---|---|---|---|---|---|---|
| Buta | (') | (Mag) | (Mag) | (km s−1) | ||
| (1) | (2) | (3) | (4) | (5) | (6) | (7) |
| ESO 357−025 | −2.8 | ... | 1.32 | 15.01 | −16.75 | 1737 |
| ESO 358−025 | −2.7 | ... | 1.74 | 13.83 | −18.09 | 2184 |
| ESO 419−013 | −1.0 | ... | 1.48 | 14.36 | −17.00 | 1490 |
| ESO 462−031 | −1.0 | ... | 1.62 | 14.62 | −18.62 | 2705 |
| ESO 482−013 | −1.0 | ... | 1.23 | 15.17 | −16.80 | 1846 |
| ESO 483−013 | −3.0 | dE4,N/SA0− | 1.70 | 14.21 | −16.04 | 895 |
| ESO 548−023 | −3.7 | ... | 1.15 | 14.86 | −17.25 | 1863 |
| IC 0051 | −2.0 | ... | 1.70 | 13.75 | −18.13 | 1714 |
| IC 2040 | −1.1 | ... | 1.35 | 13.74 | −17.38 | 1326 |
| IC 2085 | −1.5 | ... | 2.45 | 13.96 | −16.12 | 982 |
| NGC 0059 | −3.0 | ... | 2.40 | 13.14 | −15.17 | 364 |
| NGC 0148 | −2.0 | ... | 2.00 | 13.11 | −18.48 | 1516 |
| NGC 0216 | −2.0 | ... | 1.35 | 13.71 | −17.96 | 1576 |
| NGC 0244 | −2.0 | ... | 1.05 | 13.79 | −16.69 | 940 |
| NGC 0254 | −1.3 | ... | 2.75 | 12.59 | −19.11 | 1624 |
| NGC 0274 | −2.8 | (R)SA(l)0− | 1.26 | 13.40 | −18.73 | 1751 |
| NGC 0474 | −2.0 | (R)SAB0/a (shells) pec | 2.63 | 12.38 | −20.43 | 2372 |
| NGC 0584 | −4.6 | SB0− | 3.80 | 11.33 | −20.89 | 1796 |
| NGC 0680 | −4.0 | ... | 1.70 | 12.90 | −20.52 | 2779 |
| NGC 0855 | −4.9 | SA0− | 2.95 | 13.28 | −16.98 | 610 |
| NGC 0936 | −1.2 | ... | 4.47 | 11.20 | −20.27 | 1340 |
| NGC 1222 | −3.0 | ... | 1.58 | 13.15 | −19.80 | 2457 |
| NGC 1316C | −2.0 | ... | 1.48 | 14.29 | −17.61 | 1800 |
| NGC 1332 | −2.9 | ... | 5.37 | 11.20 | −20.46 | 1524 |
| NGC 1482 | −0.9 | Sa: sp | 2.45 | 13.10 | −19.02 | 1859 |
| NGC 1510 | −1.6 | SA0+: | 1.32 | 13.47 | −16.49 | 913 |
| NGC 1533 | −2.5 | ... | 3.24 | 11.79 | −17.60 | 789 |
| NGC 1596 | −2.0 | ... | 3.89 | 12.01 | −19.28 | 1510 |
| NGC 1705 | −2.9 | dE3,N | 1.86 | 12.79 | ... | 630 |
| NGC 2634 | −4.9 | SA(nl)0− (shells) | 1.70 | 12.91 | −20.02 | 2258a |
| NGC 2732 | −2.0 | ... | 1.82 | 12.85 | −19.77 | 1900 |
| NGC 2768 | −4.4 | ... | 5.62 | 10.82 | −21.22 | 1410 |
| NGC 2974 | −4.2 | SA(r)0/a | 3.47 | 11.88 | −20.49 | 1889 |
| NGC 3032 | −1.9 | ... | 1.41 | 13.07 | −18.90 | 1546 |
| NGC 3073 | −2.8 | S0− | 1.20 | 14.11 | −17.50 | 1217 |
| NGC 3384 | −2.7 | ... | 5.25 | 10.89 | −19.82 | 903 |
| NGC 3414 | −2.0 | ... | 2.69 | 12.06 | −19.80 | 1414 |
| NGC 3522 | −4.9 | ... | 1.17 | 14.08 | −17.41 | 1221 |
| NGC 3608 | −4.8 | E2 | 3.16 | 11.57 | −19.74 | 1108 |
| NGC 3773 | −2.0 | ... | 1.23 | 13.51 | −17.52 | 985 |
| NGC 3870 | −2.0 | SB(rs)0°? | 1.02 | 13.49 | −17.32 | 758 |
| NGC 4105 | −4.6 | ... | 4.37 | 11.57 | −20.72 | 1873 |
| NGC 4106 | −1.3 | ... | 4.17 | 12.28 | −20.34 | 2150 |
| NGC 4117 | −2.0 | S0− sp | 1.58 | 14.10 | −17.04 | 934 |
| NGC 4405 | −0.1 | ... | 1.70 | 12.96 | −19.35 | 1741 |
| NGC 4494 | −4.8 | ... | 4.37 | 10.68 | −21.02 | 1310 |
| NGC 4546 | −2.7 | ... | 3.16 | 11.35 | −19.73 | 1050 |
| NGC 4550 | −2.1 | S0− sp | 3.16 | 12.48 | −18.69 | 381 |
| NGC 4694 | −2.0 | ... | 2.00 | 12.29 | −19.19 | 1182 |
| NGC 5018 | −4.4 | SAB0− (shells) pec | 3.47 | 11.69 | −21.64 | 2850 |
| NGC 5122 | −1.0 | ... | 1.15 | 14.27 | −18.98 | 2859 |
| NGC 5173 | −4.9 | E+ | 1.10 | 13.38 | −19.68 | 2428 |
| NGC 5273 | −1.9 | ... | 2.29 | 12.53 | −18.86 | 1109 |
| NGC 5338 | −2.0 | ... | 1.95 | 14.05 | −16.61 | 816 |
| NGC 5481 | −3.9 | ... | 1.78 | 13.28 | −19.26 | 1883 |
| NGC 5574 | −2.8 | ... | 1.32 | 13.29 | −18.79 | 1657 |
| NGC 5576 | −4.8 | ... | 2.82 | 11.79 | −20.14 | 1482 |
| NGC 5846 | −4.7 | E+0/SA0− | 4.27 | 11.09 | −21.27 | 1824 |
| NGC 5854 | −1.1 | ... | 3.02 | 12.65 | −19.70 | 1750 |
| NGC 5864 | −1.7 | ... | 2.51 | 12.68 | −19.76 | 1850 |
| NGC 6014 | −1.9 | ... | 1.74 | 13.64 | −19.46 | 2491 |
| NGC 6278 | −1.9 | ... | 1.74 | 13.74 | −19.73 | 2776 |
| NGC 7465 | −1.9 | ... | 1.07 | 13.36 | −19.33 | 1962 |
| PGC 014037 | −1.0 | ... | 1.20 | 15.12 | −17.74 | 2546 |
| UGC 09348 | −1.6 | ... | 1.78 | 14.72 | −17.45 | 1672 |

Notes. Information on galaxies checked for tidal debris. All data were taken from Hyperleda, unless noted otherwise. Column 1: object; Column 2: numerical morphological type; Column 3: galaxy morphology at 3.6 μm (Buta et al. 2010); Column 4): projected major axis of a galaxy at the isophotal level of B = 25 mag arcsec−2; Column 5: apparent total B magnitude; Column 6: absolute B magnitude; Column 7: heliocentric radial velocity obtained from radio observations. aHeliocentric velocity from Smith et al. (2000). This galaxy does not have a value for vrad in the Hyperleda database at the time of writing, hence it is not included in the S4G sample. But as the nearby galaxy, NGC 2634A is in the S4G sample, NGC 2634 was imaged in the same frame.
Download table as: ASCIITypeset image
2.2. Data Analysis
The principal difficulty in identifying tidal debris is the very high contrast between the bright component of a galaxy and the faint, fine-scale tidal debris structures. To mitigate this contrast, we used the following methods: unsharp masking (Malin 1977), the building of a structure map (Pogge & Martini 2002) and color map, and the two-dimensional profile fitting of the light distribution of the galaxy. Applying unsharp masking is a fast and easy way to remove the light associated with the galaxy. It enhances the features of galaxies that exhibit sudden changes in their light distributions, which can be caused by spiral arms, shells, and ripples. To generate an unsharp masked image, we first convolved the image with a circular Gaussian kernel of σ = 15 pixels (corresponding to 1125), a size that was chosen iteratively to better reveal the tidal debris in the unsharp masked images. We then divided the original image by the convolved image, which allowed us to highlight the sharply varying features from the smoother background. This technique was sufficient for revealing shells, arc-like features (see Figure 6), and highly inclined disk components.
Making structure maps (Pogge & Martini 2002) is another method to enhance unresolved or marginally resolved features on the scale of the PSF. This technique involves removing the large-scale smoothed light of the galaxy using the image PSF as a kernel. The structure map therefore has the extra benefit of reducing the time spent in choosing the best kernel to reveal the tidal features of the galaxy. To derive the structure map, we first divide the original image by the PSF-convolved image, then convolve this resulting image with the transpose of the PSF image. This operation can be expressed as follows:

where I is the original image, P is the PSF image, Pt is the transpose of PSF image, and S is the image of the structure map (Pogge & Martini 2002). Smooth changes in the light distribution, such as faint tidal tails, are still not easily revealed with an unsharp masked image or structure map.
Modeling the light distribution of the galaxy using its known components such as a bulge and/or a disk component is another common method, used for detecting tidal features. The Ellipse task in iraf can be used for modeling the light distribution of the galaxy. This task creates series of concentric elliptical isophotes that are fit to the galaxy image. The resulting galaxy model is subtracted from the original image to reveal the tidal features. This technique is, however, not optimal to identify shells because concentric arc-like shell features can become incorporated in the Ellipse model. Another problem with the ellipse-fitting method is that it can produce spurious residuals when there are rapid changes in the ellipticity and position angle (P.A.). In such cases, the model subtraction leaves an imprint, which resembles shell-like debris (Janowiecki et al. 2010). We also found in our analysis that the residual images of the Ellipse model fit can show "butterfly" (quadrupole) patterns in the central region (also in Janowiecki et al. 2010). This occurs because the ellipse fitting cannot account for high-order deviations from an ellipses (e.g., boxy bulges), which may be present near galactic centers.
A better technique for identifying tidal features is to use a multi-component, two-dimensional fitting algorithm like GALFIT (version 3.0; Peng et al. 2002, 2010). In order to find tidal debris, we examine the residual image, which were obtained by subtracting the best-fit model from the image. To find the best-fit model for each galaxy, we run GALFIT with four different functions; two different one-component fits that fit the bulge only and two different two-component fits that fit the bulge and the disk. These four functions are de Vaucouleurs, Sérsic, Sérsic+exponential, and Sérsic+Sérsic profile. These fits will be discussed in more detail in Section 5.1. Although it has been shown that most of the ETGs do not follow an R1/4 law (Caon et al. 1993; Graham et al. 1996), i.e., the Sérsic index of the bulge is rarely 4, we modeled the ETGs with an n = 4, de Vaucouleurs' profile to compare our results with previous studies on the KR and FP. Since some elliptical galaxies are mistaken S0s, we include a disk component for modeling those galaxies to increase our chances of diagnosing such cases. If we choose an unrealistic Sérsic index to model galaxies, spurious features can also be produced in the residual image, therefore careful decomposition is needed.
The Sérsic profile (Sérsic 1963) is defined as

where reff is the effective radius, Ieff is the intensity at r = reff, n is the Sérsic index, and bn is chosen to satisfy

When n = 4, it is called the de Vaucouleurs profile, and if n = 1, it describes the exponential disk profile. The scale length hr of the disk is given as

GALFIT gives the effective semimajor axis in the output, whereas other studies often use, the circularized effective radius, defined as

We also derive Reff for comparison with other studies. Mean surface brightnesses within r = reff are calculated with

where mbulge is the bulge magnitude within the effective radius, (b/a) is the axis ratio of the bulge component, and reff is effective radius of the bulge.
We constrained GALFIT to use the same central position of the galaxy for both the bulge and disk components. GALFIT (version 3.0 or higher) allows us to fit asymmetric features with Fourier modes and coordinate rotations. Unlike Ellipse in iraf, GALFIT does not build models using isophotal fits, but instead fits the given image with a suitable model all at once. Thus, it does not allow radial variations of P.A. and ellipticity but returns one global value of P.A. and ellipticity for each component of the model. We estimated the sky background by selecting 10 different regions outside the galaxy, avoiding any obvious faint tidal features in the background. We fixed the sky value while running GALFIT. All of the components were convolved with the PSF for IRAC 3.6 μm band, which was created from the sub-sampled IRAC point response function (PRF) provided by the Spitzer Science Center.19 Because images of the S4G are mosaicked by drizzling, and have a pixel scale of 075, we re-sampled the PRF 61 times (=0.75/1.22×100) to match the pixel scale of the S4G data. We also rotated each PSF to the average angle at which a galaxy was observed. For the Galactic extinction correction, we use the result of Schlegel et al. (1998). Because the difference of the Galactic extinction between 3.6 and 3.8 μm is not significant, we adopted the value of L' (3.8 μm) for each object, taken from the NASA/IPAC Extragalactic Database (NED).20
To find the best-fit model unaffected by bright foreground stars or faint background galaxies, we mask out those objects before running GALFIT. To generate mask images, we run Source Extractor (Bertin & Arnouts 1996) with a 3σ detection threshold and choose "check-image" to return "segmentation image" and make use of those as mask images. However, the "segmentation image" does not generate adequate masks, especially in the central parts of some galaxies. So for sources lying within 0.5× D25 from the center of galaxies, we create circular masks with the size proportional to the magnitude of the source. Then, we perform a preliminary GALFIT run to identify tidal features. Based on this first analysis, we improve the mask images manually by adding shells or diffuse tidal features to the masks, which do not originally include those features in the "segmentation image." Then, we run GALFIT again on this star-free, background galaxy-free, and tidal feature-free image to find the best fit. In some cases, around the edge of masks, light from stars appears to be leaking out as can be seen in Figures 1–5. However, these images are displayed with a histogram equalized stretch that emphasizes faint structures and the leaks do not affect our results.

Figure 1. Residual images of NGC 474 (left) and NGC 2634 (right). The model fit of two Sérsic components, one for the bulge and one for the disk, is subtracted from each image. Left: shells and tidal features of NGC 474. The "comma-like" feature is marked with "a" at r ∼ 3 5. Right: shells are marked with "a" (r ∼ 45''), "b," "c" (r ∼ 75''), "d" (r ∼ 100''), and a possible lens is marked with "e" (r ∼ 25''). North is up and east is to the left for all of the images shown in this paper.
Download figure:
Standard image High-resolution image
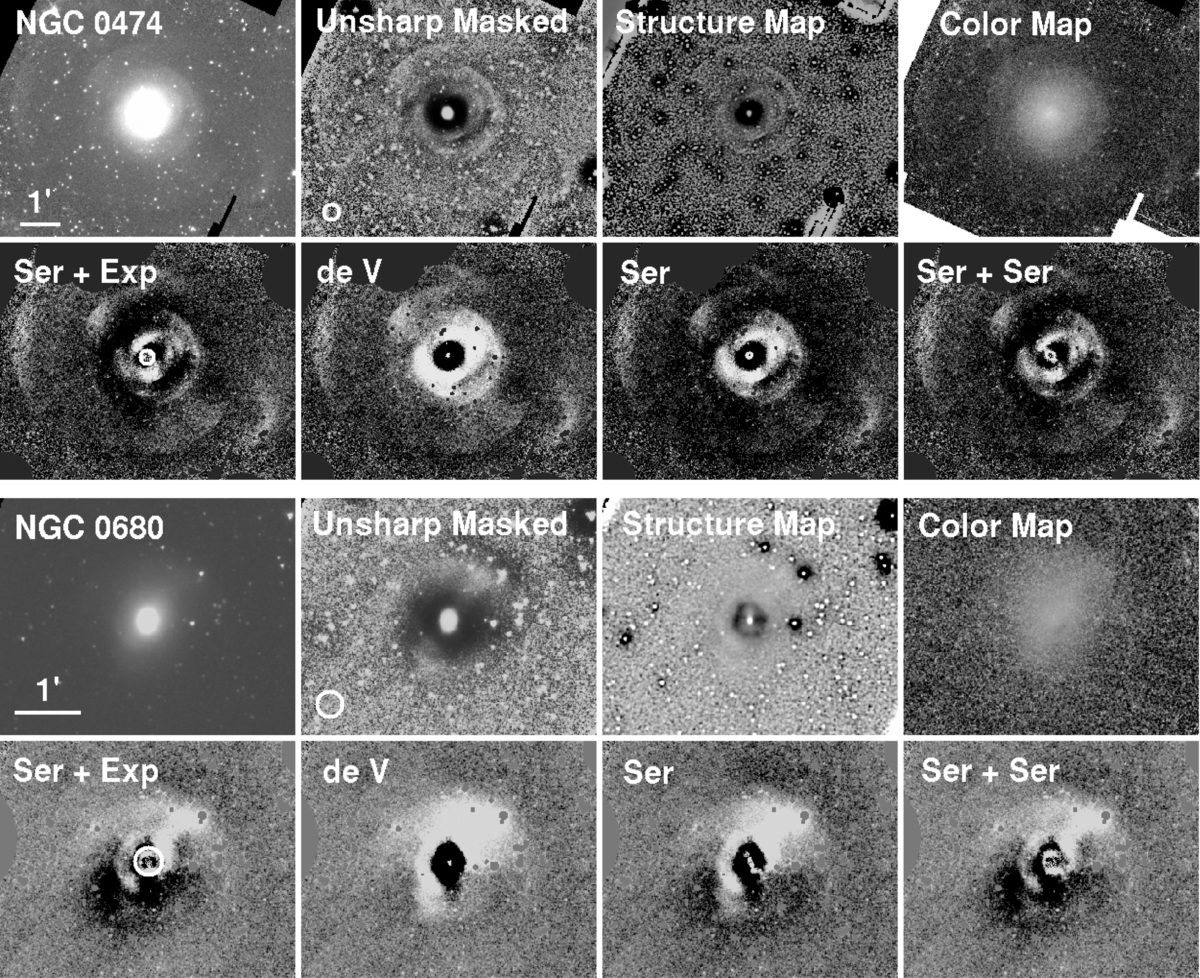
Figure 2. Image analysis of NGC 474 and NGC 680. Top (left to right): 3.6 μm image; unsharp masked image; structure map; and color image of 3.6–4.5 μm in histogram equalized stretch. Bottom (left to right): GALFIT residual images for a bulge (n = free) and an exponential disk (n = 1) fit; de Vaucouleurs law (n = 4) fit; bulge-only (n = free) fit, and bulge (n = free) with disk (n = free) fit, respectively. The white circle on the bottom left of the unsharp masked image indicates the size of the Gaussian kernel, which was used to generate the unsharp masked image. The white circle in the residual image of the "Ser+Exp" model presents the adopted inner boundary for estimating the fractional luminosity of tidal debris, which is also listed in Table 4.
Download figure:
Standard image High-resolution image
Figure 3. Image analysis of NGC 1222, NGC 2634, and NGC 4694, same as Figure 2.
Download figure:
Standard image High-resolution image
Figure 4. Image analysis of NGC 5018 and NGC 5576, same as Figure 2.
Download figure:
Standard image High-resolution image
Figure 5. Upper left panel shows the 3.6 μm S4G image of NGC 5576 (upper left galaxy) and NGC 5574 (lower right galaxy). The upper right panel shows the GALFIT residual image of the model fit with Sérsic+exponential, displayed in histogram equalized stretch. A long tidal tail extends out to 7' and tidal disturbances of NGC 5576 are also present. The companion galaxy, NGC 5574, and stars were masked out to enhance faint structures. The lower left panel presents the regions that were chosen to estimate the sky brightness value in the NGC 5576 field at 3.6 μm, displayed in a histogram equalized stretch with foreground stars masked out. The lower right panel shows the regions that were adopted to compare the brightness of the tidal tail with that of the sky.
Download figure:
Standard image High-resolution image3. GALAXIES EXHIBITING TIDAL FEATURES
Of the 65 ETGs in our sample, 11 galaxies show evidence of tidal interactions, such as shells, ripples, or tails in the GALFIT residual image. We also check the unsharp masked image, structure map. Especially for the diffuse features, we visually cross-check those features in the 3.6 μm image using the histogram stretch and in the GALFIT residual images. The basic properties of each galaxy are summarized in Table 2. We describe properties of galaxies showing shells and tidal debris in Sections 3.1 and 3.2, respectively. All 11 galaxies were previously classified as galaxies with shells or tidal features; therefore, we briefly summarize published studies on them. Then we present the fraction of ETGs with shells and tidal disturbances and we compare them with literatures in Section 3.3. We also discuss the ring-like feature in NGC 2974, which may not be tidal debris.
Table 2. Basic Information of the Galaxies Showing Tidal Features
| Object | Morphology | Morphology | Kinematic class | Ψ | Distance | BTotal | Velocity Dispersion |
|---|---|---|---|---|---|---|---|
| (RC3) | (Buta) | (ATLAS3D) | (deg) | (Mpc) | (Mag) | (km s−1) | |
| (1) | (2) | (3) | (4) | (5) | (6) | (7) | (8) |
| NGC 0474 | SA(s)0° | (R)SAB0/a (shells) pec | Fast rotator | 31.3 | 27.7 | 12.38 | 163 ± 5a |
| NGC 0680 | E+ pec: | ... | Fast rotator | 22.7 | 34.8 | 12.90 | 214 ± 6a |
| NGC 1222 | S0− pec: | ... | Slow rotator | 72.7 | 31.2 | 13.15 | 119 ± 13b |
| NGC 1482 | SA0+ pec sp | Sa: sp | ... | ... | 25.0 | 13.10 | ... |
| NGC 2634 | E1: | SA(nl)0− (shells) | ... | ... | 31.7 | 12.91 | 191 ± 6a |
| NGC 3032 | SAB(r)00 | ... | Fast rotator | 0.8 | 25.0 | 13.07 | 82 ± 16c |
| NGC 4106 | SB(s)0+ | ... | ... | ... | 34.3 | 12.28 | 176 ± 17d |
| NGC 4694 | SB0 pec | ... | Fast rotator | 2.0 | 20.4 | 12.29 | 61 ± 5b |
| NGC 5018 | E3: | SAB0− (shells) pec | ... | ... | 43.3 | 11.69 | 211 ± 17b |
| NGC 5574 | SB0−: ? sp | ... | Fast rotator | 4.8 | 26.3 | 13.29 | 77 ± 3e |
| NGC 5576 | E3 | ... | Slow rotator | 7.4 | 23.9 | 11.79 | 164 ± 13b |
Notes. Column 1: object; Column 2: galaxy morphology in the optical blue band from RC3 catalog; Column 3: galaxy morphology at 3.6 μm (Buta et al. 2010); Column 4: kinematic class of galaxies from ATLAS3D study (Emsellem et al. 2011); Column 5: kinematic misalignment angle in degrees from ATLAS3D study (Krajnović et al. 2011), where sin Ψ = ∣sin (P.A.phot − P.A.kin)∣; Column 6: luminosity distances which were corrected to the reference frame defined by the 3K microwave background radiation, from the NASA/IPAC Extragalactic database (NED); Column 7: total B magnitude, from Hyperleda; Column 8: central velocity dispersion, from (a) Simien & Prugniel (2000); (b) Table 4 of Wegner et al. (2003); (c) Dalle Ore et al. (1991); (d) Dressler et al. (1991); (f) Simien & Prugniel (2002).
Download table as: ASCIITypeset image
3.1. Shell Galaxies
- 1.NGC 474. This galaxy is also known as Arp 227 (Arp 1966), and is interacting with NGC 470, which is 55 (∼50 kpc) to the west. An HI gas bridge connects NGC 474 and NGC 470 (Rampazzo et al. 2006). NGC 474 is famous for its shell structures (Malin & Carter 1983; Turnbull et al. 1999) and the misalignment between the kinematic and photometric major axis (Hau et al. 1996). About 35 to the southwest of the galaxy center, there is a "comma-like" structure (Rampazzo et al. 2006), which is denoted with a letter "a" in Figure 1.In the S4G data, shells in NGC 474 are clearly visible in the unsharp masked image and in the residual image (Figure 2) from the GALFIT model. There is also a possible bar feature (P.A. 33° from north to east), which shows up in the residual image after a Sérsic plus the exponential disk model has been subtracted (Figure 1). This is consistent with the findings of Laurikainen et al. (2010), who also noted that this galaxy has a weak oval bar surrounded by a lens. A lens is defined as a oval-shaped structure in the disk and its surface brightness is slowly decreasing with a sharp outer edge (Kormendy 1979; Athanassoula 1983; Bosma 1983; Kormendy & Kennicutt 2004). We also find that shells and tidal features in the residual images at 3.6 μm are similar to those in R-band images obtained by Turnbull et al. (1999). The P.A. and ellipticity of NGC 474 are in agreement with what Turnbull et al. (1999) have found. The 3.6–4.5 μm color map is shown in Figure 2. Morphological features of NGC 474 seen in the 3.6–4.5 μm color map are similar to those in the 3.6 μm image, and this is same as for other galaxies showing tidal features in this study.
- 2.NGC 2634. This galaxy presents multiple shells at r ∼ 45'', 75'', and 100'', which correspond to projected distances of r ∼ 7 kpc (marked with "a" in Figure 1), 11 kpc ("b" and "c"), and 15 kpc ("d"). In the residual images (Figure 3), a relatively bright ring-like feature is present at r ∼ 25'' as marked with "e" It is difficult to decide whether this is a shell or not because it does not show a sharp edge on the surface brightness profile and it encircles the central part of the galaxy. Therefore, it is more probable that the ring-like feature is a lens, as Buta et al. (2010) classified this galaxy has a nuclear lens. There are only a few previous studies that have noted these shells. While the galaxy was originally classified as "E1": in the RC3, it was recently classified by Buta et al. (2010) as an SA(nl)0− (shells) from the S4G data. In a conference abstract, Statler et al. (2001) report that they found shells in NGC 2634 using optical image.
- 3.NGC 3032. This galaxy has shell at r ∼ 30'' and it is marked with arrows in Figure 7. In the residual image, we see some features in the central region. We check the F606W HST and Sloan Digital Sky Survey (SDSS) image and found that NGC 3032 has central dusty spiral features within 11''. Schweizer & Seitzer (1988) also showed that this galaxies have three interleaving ripples in Figure 2 of their paper. Laurikainen et al. (2010) noted that this galaxy has two nearly circular lenses extending out to r ∼ 7 and 16'', respectively.
- 4.NGC 5018. NGC 5018 shows multiple shells (Malin & Carter 1983) and broad fans of stellar light (Figure 4). One of the inner shells is in the shape of an hourglass, which is also evident in the V-band image in Figure 2 of Fort et al. (1986). Dust lanes and patches in the galaxy have been noted (Fort et al. 1986; Sandage & Bedke 1994) and with a UV F336W HST image, Rampazzo et al. (2007) find dust lanes also in the nuclear region (10'' × 10'') of the galaxy. A filament of HI gas stretches across the stellar body of NGC 5018 and connects two neighbors (Serra & Oosterloo 2010). A faint dispersed tidal tail lies toward the northwest. The shells are not detected in a near-ultraviolet image taken from the Galaxy Evolution Explorer archive (Rampazzo et al. 2007), indicating that there is no strong recent star formation in shells. The unsharp masked image, structure map, and residual images (Figure 4) suggest that there is an inner disk inclined at a P.A. of 97° in the central region of the galaxy, extending out to 25'' from the galactic center.
3.2. Galaxies Showing Tidal Features
- 1.NGC 680. This galaxy is classified as an "E+ pec:" (RC3), and it belongs to the NGC 691 group (van Moorsel 1988; Crook et al. 2007) with NGC 678 (at a projected distance of 54, 60 kpc), NGC 694 (166, 190 kpc), NGC 691 (179, 200 kpc, also known as NGC 674), and IC 167 (191, 220 kpc). In our analysis of the S4G data, we clearly see tidal disturbances, shells, and an asymmetric envelope in the residual maps from GALFIT shown in Figure 2. As an exercise, we have also run the ellipse task in iraf with a varying center to check if we can confirm the presence of the asymmetry in NGC 680. With this fit we can reproduce the asymmetric envelope. However, the model image produced from the ellipse fit shows artificial structures caused by the pile up of ellipses. Using this model to produce residual image similarly as with our GALFIT models, we still find the same tidal features, although their shape might vary. The dark feature at the southeast side of NGC 680 in Figure 2 becomes smaller in size—and part of it becomes bright—but the bright feature at the northwest, which we describe as a shell, still remains. NGC 680 has also been described to have possible patchy dust (Ebneter et al. 1988). Duc et al. (2011) showed that NGC 680 exhibits two diffuse plumes in the optical image and these are connected to an extended HI tail.
- 2.NGC 1222. There is a tidal disturbance toward the north as can be seen in Figure 3. Also known as Markarian 604, NGC 1222 has a starburst nucleus, which has a compact radio and infrared source (Beck et al. 2007). Petrosian & Burenkov (1993) claimed that this galaxy has appearance of a triple system in Figure 1 of their paper, and argued that two other galaxies are dwarf galaxies with high surface brightness interacting with the main galaxy. They also mentioned that there is a continuous twist in the isophotes. To check if we can confirm this isophotal twist, we have run the ellipse task in iraf, and we also find the twist in the isophotes of the galaxy. Also NGC 1222 have a large kinematic misalignment between the photometric and kinematic major axes (Ψ = 72
 7, where sin Ψ = |sin (P.A.phot − P.A.kin)|). Despite the complex morphology, NGC 1222 is classified as a slow rotator (Emsellem et al. 2011).
 - 3.NGC 1482. Toward the northeast, the galaxy has a tidal feature, and it is marked with an arrow in Figure 7. Hameed & Devereux (1999) note that this galaxy has "filaments and/or chimneys of ionized gas extending perpendicular to the disk" (see Figure 5 of their paper). Large-scale hourglass-shaped outflows has been detected with excitation maps of [N ii] λ6583 and Hα also by Veilleux & Rupke (2002). They claimed this galactic wind is extending along the minor axis of the galaxy at least 1.5 kpc above and below the galactic plane in both directions with a velocity of ∼250 km s−1.
- 4.NGC 4105/4106 pair. These galaxies are interacting and NGC 4106 (left one in Figure 7) shows tidal disturbances. One of the tidal tails extends toward the elliptical galaxy, NGC 4105 (right one in Figure 7). These galaxies are separated by a projected distance of 7.7 kpc and the difference in radial velocities is ∼260 km s−1. NGC 4106 shows a disky central structure and NGC 4105 has dusty features in the central region and disky outer structure (Grützbauch et al. 2007). Reduzzi & Rampazzo (1996) obtained a nearly constant color profile of (B − V) ∼ 0.9 for both NGC 4105 and NGC 4106, while Longhetti et al. (1999) claimed that these galaxies experienced recent star formation episodes from their study of line indices. While NGC 4106 is perturbed, NGC 4105 does not show clear perturbation (Grützbauch et al. 2007). Thus, we exclude the elliptical galaxy, NGC 4105, from our selection of galaxies with tidal disturbances.
- 5.NGC 4694. This galaxy is described as "amorphous" (Sandage & Tammann 1981), and classified as an SB0(pec) in RC3 (de Vaucouleurs et al. 1991). However, as can be seen in Figure 3, it is not easy to tell whether NGC 4694 exhibits any bar feature in the 3.6 μm image. Using multi-component galaxy decomposition, Laurikainen et al. (2010) note that it has a bright oval-like component and a peculiar nuclear bar or an inner disk. Duc et al. (2007) presented a Very Large Array HI map of NGC 4694 and its nearby dwarf galaxy, VCC 2062, in their Figure 1. They show that the two galaxies are connected by an HI bridge. The faint spiral arm-like tidal feature of NGC 4694 in the bottom panel of Figure 3 likely follows HI arm. Therefore, this tidal feature may originate from an interaction with VCC 2062.
- 6.NGC 5576. NGC 5576 is reported to have boxy isophotes (Ebneter et al. 1988), and it shows peculiar tidal features, tidal disturbances to the north, and a very long tidal stream to the south. The tidal disturbance in this galaxy can be seen in the right panel of Figure 5. At an angular separation of about 276 (∼16 kpc) to the southwest from NGC 5576 (Vrad = 1482 km s−1) there is a barred S0-type galaxy, NGC 5574 (Vrad = 1657 km s−1). There is a long tidal tail extending out to 60 kpc, which suggests that NGC 5576 and NGC 5574 are an interacting pair. To check how bright this tidal tail is compared to the sky, we chose square regions outside the galaxy, as shown in the bottom left panel of Figure 5. We then estimated the surface brightness of the tidal tail in these selected boxes. The signal-to-noise ratio (S/N) of the tidal tail region is low (S/N ∼ 1.5), which indicates that the tidal tail is only marginally brighter than the sky. Tal et al. (2009) also see this faint tidal tail in their deep V-band image out to 75 kpc.Despite the faintness of the tidal tail, NGC 5576 and NGC 5574 are likely interacting. The nucleus of NGC 5574 has an iron-overabundant stellar system (Sil'chenko et al. 2002), which is a rare phenomenon for ellipticals, because most ellipticals are magnesium-overabundant. Sil'chenko et al. (2002) mention that this iron overabundance can be observed in some irregular galaxies and is usually interpreted as a result of multiple starbursts. Interestingly, the nucleus of the companion galaxy, NGC 5576, also shows this rare iron overabundance. The luminosity-weighted stellar ages of both galaxies are 3 Gyr (Sil'chenko 1997), which implies that these two galaxies have experienced similar recent episodes of star formation. NGC 5576 is classified as a slow rotator (Emsellem et al. 2011) without any specific kinematic feature, such as kinematically distinct core or kinematic twist in the central part of the galaxy. This result implies that this galaxy experienced a significant merging event without being able to rebuild a fast rotating stellar component through dissipation (Emsellem et al. 2011). Although the long tidal tail seems to be related to the interaction of NGC 5576 and NGC 5574, and even if NGC 5576 shows tidal disturbances in the 3.6 μm imaging data alone, we cannot be sure from which galaxy the tidal tail originated. As cataloged in the isolated triplets of galaxies (Karachentseva et al. 1979; KTG 55), NGC 5576 has another companion galaxy, NGC 5577, located to the north, which has a redshift similar to NGC 5576. Since we only cover the southern part of this galaxy pair at 3.6 μm, we checked the northern part in the accompanying 4.5 μm data, but could not identify a tidal bridge between NGC 5576 and NGC 5577. Therefore, the tidal disturbance of NGC 5576 might be related to the interaction with NGC 5574, although NGC 5574 has a larger recession velocity or it may be that NGC 5574 has a high peculiar velocity due to its interaction with NGC 5576.
- 7.NGC 2974. This object is classified as an elliptical galaxy, E4 (de Vaucouleurs et al. 1991), isolated elliptical (Sandage & Bedke 1994), and an SA(r)0/a galaxy by Buta et al. (2010) using the S4G data. Tal et al. (2009) identified multiple shells in this system. NGC 2974, however, shows an HI velocity field consistent with a rotating disk and the rotation axis of the galaxy is well aligned with the optical minor axis of the galaxy (Kim et al. 1988). Additionally, according to Emsellem et al. (2003), this galaxy has a gaseous spiral structure and a possible inner bar within a radius of 200 pc. From the near- and far-ultraviolet study (Jeong et al. 2007), NGC 2974 hosts an outer ring at a radius of 60'' with a young stellar population (⩽1 Gyr), and we confirm the arc-like ring features at a radius of 55'' (corresponds to 7 kpc) in the unsharp masked image of 3.6 μm (Figure 6). A bright star near NGC 2974 makes it difficult to determine whether this feature is a ring or a shell, but the arc-like feature encompasses almost 180°, which can be seen in Figure 1 of Jeong et al. (2007). It also hosts a regular HI ring aligned with the stellar component of galaxy (Serra & Oosterloo 2010). Therefore, this arc-like feature may not be a shell as previously claimed (Tal et al. 2009). For these reasons, we excluded NGC 2974 from our sample of ETGs with tidal features.

Figure 6. Left: NGC 2974 at 3.6 μm. Right: unsharp masked image of NGC 2974.
Download figure:
Standard image High-resolution image
Figure 7. Image analysis of NGC 1482, NGC 3032, and NGC 4106, which were identified to have tidal features. Note that these galaxies were not carried on for the further analysis because of the muxbleed (marked with "a" in the upper panel) and column pull-down (marked with "b") due to saturation (NGC 1482 and NGC 3032) or close companion (NGC 4105 and NGC 4106). Left to right: 3.6 μm image in log-scale stretch; 3.6 μm image in histogram equalized stretch; structure map; GALFIT residual images from a bulge (n = free) and an exponential disk (n = 1) fit. Tidal features are marked with arrows.
Download figure:
Standard image High-resolution image3.3. Fraction of Tidally Disturbed ETGs
We have identified 11 tidally disturbed galaxies from 65 ETGs. Note that our sample of this pilot study does not include the whole statistically complete sample of ETGs in S4G. We found fewer ETGs with tidal features than van Dokkum (2005) and Tal et al. (2009), who found fine structures in 70% of their ETGs. Tidal features can be relatively faint, as shown by Janowiecki et al. (2010), the peak surface brightness of tidal features range from μV = 26–29 mag arcsec−2. Therefore, the ability to identify tidal features depends strongly on the data, especially on the depth of the image. We summarize the fraction of tidally disturbed galaxies from the literature in Table 3 along with the depth of images analyzed in each study. As studies in the literature were performed in different bands, we convert the magnitude of depth of images to B-band AB magnitude system in Table 3 to directly compare the fraction of tidally disturbed ETGs. As we can see in Table 3, the deeper studies can find more tidally disturbed ETGs. Depending on the project, the Spitzer archival images have different depths and we could find tidal features down to μ3.6, AB ⩽ 26.5 mag arcsec−2, while in the newly obtained "Warm" data from the S4G project, we found tidal features down to μ3.6, AB ⩽ 25.2 mag arcsec−2 (∼μB, AB ⩽ 26.9 mag arcsec−2).
Table 3. Fraction of ETGs Showing Tidal Features
| Study | Fraction | Object | Band | Depth | Equivalent Depth in B |
|---|---|---|---|---|---|
| (%) | (mag) | (AB mag) | |||
| (1) | (2) | (3) | (4) | (5) | (6) |
| Malin & Carter (1983) | 17a (shell) | Ellipticals | B | 26.5 (Vega) | 26.3 |
| van Dokkum (2005) | 70 | ETGs | BVRb | 29.5b (AB) → 28.0c | 29.5b → 28.0c |
| BVI b | 29.0b (AB) → 28.0c | 29.0b → 28.0c | |||
| Tal et al. (2009) | 73 | ETGs | V | 29.0 (Vega) → 27.7c | 30.0 → 28.7c |
| Krajnović et al. (2011) | 8 | ETGs | r | 26.0 (AB) | 27.3 |
| This study | 17±3 | ETGs | 3.6 μm | 27.0 (AB) → (25.2)d | 28.7 → (26.9)d |
| 13a±1 (shell) | Ellipticals | ||||
| 6e ± 2 (shell) | ETGs |
Notes. Column 1: author of the study; Column 2: fraction of tidally disturbed galaxies; Column 3: morphology of parent sample; Column 4: filter; Column 5: typical 1σ surface brightness limit presented in the literature; Column 6: typical 1σ surface brightness limit converted to B-band AB magnitude. We made use of the Table 13 of Eisenhardt et al. (2007) to convert magnitudes, and we took colors (B − V) = 1.0, (B − R) = 1.5 at H=13 mag. To convert r to R, we used the equation listed in SDSS Web site http://www.sdss.org/dr5/algorithms/sdssUBVRITransform.html#Lupton2005. We took the value (g − r) = 0.7 for ETGs and we used (R − r) = −0.2 for conversion. We adopt (3.6 μm − B) ∼1.7 as used in Sheth et al. (2010). aFraction of shell galaxies in ellipticals galaxies. bCo-added. cDepth that van Dokkum (2005) and Tal et al. (2009) can confidently identify features, mentioned in their paper. dThe surface brightness of the tidal features in the shallowest image of our sample. With deeper images from the Spitzer Heritage Archive, we could identify tidal features down to μ3.6, AB = 26.5 (∼μB, AB = 28.2), see the text for details. eFraction of shell galaxies in ETGs, including elliptical and S0 galaxies.
Download table as: ASCIITypeset image
S4G maps each galaxy to 1.5× D25. However, for one of our sample galaxies, NGC 5846, which is identified to have shells by Tal et al. (2009), we could not identify those shells because they lie outside of our field. As discussed in Section 3.2, we exclude NGC 2974 when we count ETGs showing shells or tidal disturbances. IC 51 (Malin & Carter 1983) and NGC 3608 (Forbes & Thomson 1992) are found to have shells from the literature.21 But, we did not find clear evidence for tidal features. With magnitude and field-of-view limit, we find 17% ± 3% (11/65) of ETGs are tidally disturbed and 6% ± 2% (4/65) have shell. If we restrict our sample to ellipticals using the morphology information of RC3, we find that 13% ± 1% (2/19) of ellipticals have shells to our limiting surface brightness and field of view. We make use of Poisson statistics to present an uncertainty estimate of our fraction, using σ = [f(1 − f/N)]1/2, where N is the sample size and f is the number of galaxies showing tidal debris or shells following the method of Laine et al. (2002).
4. LUMINOSITY OF TIDAL FEATURES
To estimate the luminosity of the tidal features, we first mask out all the foreground stars and background galaxies, and after checking the residual image of each galaxy, we also mask out known features such as lens components or an inner bar, mentioned in literature. The masked out inner and outer boundaries are listed in Table 4. Because now we focus on the tidal features, this time we do not mask out tidal features but leave them in the GALFIT residual image. Then, we estimate the ratio of the total counts from the tidal debris in the residual image to the total counts in the model image. We calculated the luminosity fraction of the tidal features as a percentage (Fresidual/Fmodel) × 100 and list these in Table 4. The luminosity fractions of tidal features are estimated both in a circular region and in an elliptical region that is chosen to have the same P.A. and ellipticity as the bulge component of the model. The ratios using the circular regions are labeled as Ratiocirc, and those using the elliptical region are labeled as Ratioell. In the cases of the Sérsic+exponential fit and the Sérsic+Sérsic fit, the fractional luminosity is estimated using the total model, which is the sum of both the bulge and the disk. For simplicity, we present these ratios in the first row of S+E and S+S in Table 4.
Table 4. Results of Modeling Galaxies
| Object | Model | n | Type | reff | reff | hr | hr | P.A. | b/a | mag3.6, AB | Mag3.6, AB | Ratiocirc | Ratioell | B/T | χν2 |
|---|---|---|---|---|---|---|---|---|---|---|---|---|---|---|---|
| (Inner, Outer) | ('') | (kpc) | ('') | (kpc) | (°) | (mag) | (mag) | (Circular) | (Elliptical) | ||||||
| (1) | (2) | (3) | (4) | (5) | (6) | (7) | (8) | (9) | (10) | (11) | (12) | (13) | (14) | (15) | (16) |
| NGC 0474 | S | 6.65 | free | 31.78 | 4.86 | ... | ... | 11.3 | 0.91 | 10.88 | −21.65 | 6.2 | 6.3 | ... | 1.14 |
| [45.0, 217.5] | S+E (B) | 2.44 | free | 4.46 | 0.68 | ... | ... | 8.3 | 0.90 | 12.14 | −20.39 | 11.0 | 11.1 | 0.39 | 0.82 |
| ... | S+E (D) | 1.00 | fix | 40.30 | 6.16 | 24.02 | 3.67 | −15.2 | 0.94 | 11.67 | −20.85 | ... | ... | ... | ... |
| ... | DeV | 4.00 | fix | 14.29 | 2.19 | ... | ... | 12.7 | 0.93 | 11.23 | −21.30 | 19.1 | 18.5 | ... | 1.90 |
| ... | S+S (B) | 2.34 | free | 4.18 | 0.64 | ... | ... | 7.7 | 0.90 | 12.20 | −20.33 | 10.4 | 10.5 | 0.37 | 0.81 |
| ... | S+S (D) | 1.12 | free | 39.81 | 6.09 | ... | ... | −10.6 | 0.94 | 11.62 | −20.91 | ... | ... | ... | ... |
| NGC 0680 | S | 5.76 | free | 15.93 | 2.93 | ... | ... | −10.5 | 0.78 | 11.06 | −21.87 | 5.5 | 5.4 | ... | 2.44 |
| [12.8, 127.5] | S+E (B) | 3.38 | free | 4.91 | 0.90 | ... | ... | −4.3 | 0.78 | 11.84 | −21.09 | 6.7 | 7.2 | 0.55 | 2.06 |
| ... | S+E (D) | 1.00 | fix | 32.17 | 5.91 | 19.17 | 3.52 | −23.7 | 0.75 | 12.07 | −20.86 | ... | ... | ... | ... |
| ... | DeV | 4.00 | fix | 10.55 | 1.94 | ... | ... | −9.0 | 0.78 | 11.23 | −21.71 | 12.2 | 12.5 | ... | 3.75 |
| ... | S+S (B) | 2.57 | free | 2.98 | 0.55 | ... | ... | 0.2 | 0.77 | 12.28 | −20.65 | 5.7 | 6.1 | 0.36 | 2.01 |
| ... | S+S (D) | 1.63 | free | 26.47 | 4.87 | ... | ... | −21.0 | 0.76 | 11.66 | −21.27 | ... | ... | ... | ... |
| NGC 1222 | S | 3.25 | free | 5.82 | 0.94 | ... | ... | −73.5 | 0.68 | 12.05 | −20.59 | 14.6 | 15.5 | ... | 3.84 |
| [24.6, 120.0] | S+E (B) | 2.01 | free | 3.73 | 0.60 | ... | ... | −78.1 | 0.59 | 12.42 | −20.22 | 7.3 | 8.8 | 0.66 | 2.58 |
| ... | S+E (D) | 1.00 | fix | 28.01 | 4.51 | 16.69 | 2.69 | −15.6 | 0.61 | 13.16 | −19.48 | ... | ... | ... | ... |
| ... | DeV | 4.00 | fix | 6.70 | 1.08 | ... | ... | −72.4 | 0.69 | 11.99 | −20.65 | 11.5 | 12.5 | ... | 4.06 |
| ... | S+S (B) | 2.82 | free | 21.37 | 3.44 | ... | ... | −19.4 | 0.68 | 12.63 | −20.01 | 5.1 | 6.2 | 0.51 | 2.41 |
| ... | S+S (D) | 1.89 | free | 3.43 | 0.55 | ... | ... | −80.6 | 0.50 | 12.69 | −19.95 | ... | ... | ... | ... |
| NGC 2634 | S | 6.41 | free | 29.59 | 4.40 | ... | ... | 32.7 | 0.91 | 11.22 | −21.25 | 3.9 | 4.3 | ... | 1.23 |
| [12.8, 142.5] | S+E (B) | 4.06 | free | 9.25 | 1.38 | ... | ... | 29.1 | 0.88 | 11.96 | −20.50 | 5.0 | 6.1 | 0.61 | 1.17 |
| ... | S+E (D) | 1.00 | fix | 47.61 | 7.08 | 28.38 | 4.22 | 74.7 | 0.95 | 12.47 | −20.00 | ... | ... | ... | ... |
| ... | DeV | 4.00 | fix | 15.23 | 2.26 | ... | ... | 33.1 | 0.91 | 11.49 | −20.97 | 13.7 | 14.5 | ... | 1.92 |
| ... | S+S (B)a | 2.97 | free | 32.41 | 4.82 | ... | ... | 34.5 | 0.92 | 11.55 | −20.91 | 3.9 | 4.4 | 0.83 | 1.12 |
| ... | S+S (D)a | 1.90 | free | 2.38 | 0.35 | ... | ... | 29.4 | 0.88 | 13.31 | −19.16 | ... | ... | ... | ... |
| NGC 4694 | S | 3.53 | free | 32.92 | 2.52 | ... | ... | −34.9 | 0.46 | 11.23 | −19.78 | 2.6 | 3.6 | ... | 1.20 |
| [69.8, 187.5] | S+E (B) | 3.23 | free | 25.84 | 1.98 | ... | ... | −34.3 | 0.42 | 11.49 | −19.52 | 2.8 | 4.3 | 0.82 | 1.06 |
| ... | S+E (D) | 1.00 | fix | 51.23 | 3.93 | 30.53 | 2.34 | −62.5 | 0.79 | 13.12 | −17.89 | ... | ... | ... | ... |
| ... | DeV | 4.00 | fix | 37.93 | 2.91 | ... | ... | −34.9 | 0.46 | 11.17 | −19.84 | 1.7 | 1.6 | ... | 1.29 |
| ... | S+S (B) | 3.25 | free | 27.12 | 2.08 | ... | ... | −34.5 | 0.43 | 11.42 | −19.59 | 3.1 | 4.4 | 0.87 | 1.05 |
| ... | S+S (D) | 0.61 | free | 52.81 | 4.05 | ... | ... | −82.6 | 0.79 | 13.51 | −17.50 | ... | ... | ... | ... |
| NGC 5018 | S | 5.39 | free | 23.83 | 4.41 | ... | ... | −83.4 | 0.71 | 9.99 | −22.96 | 2.6 | 2.6 | ... | 1.26 |
| [19.6, 247.5] | S+E (B) | 5.29 | free | 19.08 | 3.53 | ... | ... | −84.4 | 0.67 | 10.22 | −22.73 | 4.3 | 4.1 | 0.87 | 1.08 |
| ... | S+E (D) | 1.00 | fix | 30.73 | 5.69 | 18.31 | 3.39 | −30.8 | 0.90 | 12.26 | −20.68 | ... | ... | ... | ... |
| ... | DeV | 4.00 | fix | 16.93 | 3.13 | ... | ... | −84.1 | 0.72 | 10.12 | −22.83 | 8.9 | 8.2 | ... | 2.20 |
| ... | S+S (B) | 5.13 | free | 11.23 | 2.08 | ... | ... | −86.6 | 0.64 | 10.82 | −22.13 | 4.7 | 4.5 | 0.51 | 1.06 |
| ... | S+S (D) | 2.45 | free | 31.55 | 5.83 | ... | ... | −75.8 | 0.78 | 10.86 | −22.09 | ... | ... | ... | ... |
| NGC 5576 | S | 6.11 | free | 31.07 | 3.05 | ... | ... | 87.7 | 0.70 | 10.10 | −21.45 | 4.9 | 4.9 | ... | 1.48 |
| [11.8, 247.5] | S+E (B) | 3.93 | free | 11.82 | 1.16 | ... | ... | 89.2 | 0.69 | 10.68 | −20.88 | 4.7 | 5.1 | 0.65 | 1.05 |
| ... | S+E (D) | 1.00 | fix | 78.84 | 7.74 | 46.98 | 4.61 | 79.9 | 0.72 | 11.33 | −20.22 | ... | ... | ... | ... |
| ... | DeV | 4.00 | fix | 17.44 | 1.71 | ... | ... | 87.9 | 0.72 | 10.33 | −21.23 | 17.1 | 17.0 | ... | 3.61 |
| ... | S+S (B) | 3.45 | free | 8.89 | 0.87 | ... | ... | 89.6 | 0.69 | 10.90 | −20.66 | 4.4 | 4.7 | 0.52 | 1.04 |
| ... | S+S (D) | 1.48 | free | 71.10 | 6.98 | ... | ... | 82.2 | 0.72 | 10.98 | −20.57 | ... | ... | ... | ... |
Notes. Column 1: object name followed by inner and outer boundaries in arcsecs within square brackets, used to estimate the luminosity of the tidal features; Column 2: the models used to fit galaxies with GALFIT. S represents the Sérsic, E represents the exponential, and DeV is the de Vaucouleurs profile. B and D in parentheses denote the bulge and disk component, respectively; Column 3: Sérsic index; Column 4: type of the fit while running GALFIT for each component. The exponential and de Vaucouleurs profile are fixed to have n = 1 and 4, respectively, and denoted as "fix"; Column 5: effective radius measured along the semimajor axis in arcsecs for bulge and also for disk. Note that for exponential disks, the scale length can be obtained by dividing this effective radius by 1.678; Column 6: effective radius measured along the semimajor axis in kpc, estimated with the heliocentric redshift listed in NED; Column 7: disk scale length in arcsecs for disk component; Column 8: disk scale length in kpc for disk component; Column 9: position angle, east of north (north = 0, east = 90); Column 10: minor axis to major axis ratio; Column 11: apparent AB magnitude at 3.6 μm; Column 12: absolute AB magnitude at 3.6 μm; Column 13: the ratio of the residual to the galaxy model in the circular region between inner and outer boundary. Note that in the case of Sérsic with exponential fit, we estimate the ratio with the total model of bulge and disk, but we put the value just in the first row in the S+E section; Column 14: the ratio of the residual to the galaxy model in an elliptical boundary using P.A., b/a, inner and outer boundary; Column 15: bulge to total ratio; Column 16: the reduced χ2, which is an indicator of goodness of fit. aFrom the Sérsic+Sérsic, two-component fit, we took the larger Sérsic index component as a bulge component. But in this case (NGC 2634), the effective radius of the larger Sérsic index component (bulge) is larger than that of smaller Sérsic index component (disk), hence this model fit may not be realistic.
Download table as: ASCIITypeset image
Some of our sample galaxies (NGC 1482 and NGC 3032) are severely saturated and have the "muxbleed" and "column pull-down" artifacts which result from a bright source—see the IRAC Instrumental Handbook, Section 7.2, for more details. The "muxbleed" is a trail of bright pixels along a row in the readout direction that repeats with an increased signal every fourth column. This is denoted as "a" in NGC 1482 of Figure 7. The "column pull-down" artifact has a decreased signal above and below the bright source along a column. This is denoted as "b" in Figure 7. Note that we excluded galaxies which were severely contaminated by these effects in our analysis. Close companions (NGC 4105/ 4106 pair) that lie within 1/4 of D25 were also excluded.
If we include all the pixel values in the residual images to estimate total counts of tidal features, then we measure the luminosity fraction of the tidal feature to be 0.5%–7% of the total model galaxy luminosity. But as described in Bennert et al. (2008), to avoid adding negative values from the regions that were oversubtracted by GALFIT in the residual image, now we only sum values of all pixels brighter than −1σ of the sky background to get total counts, and list luminosity fractions in Table 4. If we only sum values of pixels that are brighter than −3σ of the sky background, then we obtain the luminosity of 1%–8% of the total galaxy luminosity. For galaxies with shells, this result is consistent with those of Prieur (1988), Canalizo et al. (2007), and Bennert et al. (2008), who found that the shells constitute 5% of B-band, ∼6% of F606W-band, and 5%–10% of F606W-band luminosity of the galaxy, respectively. We also estimate the tidal parameter, which were used in van Dokkum (2005) and Tal et al. (2009). The tidal parameter is defined as

where Ix, y and Mx, y are pixel values at the position x, y of the object and model, respectively. The tidal parameters of our sample galaxies range from 0.09 to 0.23. These values are comparable to what van Dokkum (2005) and Tal et al. (2009) found for galaxies that have tidal features.
In Section 3.2, for the galaxies which show isophotal twist or asymmetric envelope, we have run the Ellipse task in iraf to confirm the presence of those features. We also estimate the luminosity of tidal features using the fit from Ellipse. The luminosity of the tidal features does not change significantly in the case of NGC 680, but is higher in the case of NGC 1222 with ellipse fits. Because of the artificial features shown in the models derived from Ellipse fits, and for the sake of consistency, we will only consider here the results derived from the GALFIT models.
By assuming the same stellar M/L in shells and galaxies, we estimate that 3%–10% of the galaxy stellar mass is contained in the shells or tidal features. The amount of mass in shells can be used to infer the type of merger that led to its creation. Canalizo et al. (2007) discuss that with their own numerical simulations and those of Hernquist & Spergel (1992), if shell features were formed through major mergers, the stars in the resulting shells constitute one-fourth or less of the total mass of the companion galaxy. Following the argument of Canalizo et al. (2007), shells with 5% of the mass are likely to result from a merger with a 3:1 mass ratio, whereas shells with 10% of the mass are more likely to come from a merger where the galaxies have comparable masses.
The luminosity of the long tidal stream of the NGC 5576/5574 pair is estimated in the same manner. We find that the long tidal stream constitutes 4% of the galaxy model luminosity of NGC 5576. The estimated luminosity of the tidal features here might change slightly due to foreground stars or background galaxies that might not be fully masked. We increase the size of the mask by three pixels for every foreground stars and background galaxies, and we find that the amount that long tidal stream constitutes decreased to 3% of the galaxy model luminosity of NGC 5576.
5. STRUCTURAL PROPERTIES
5.1. Modeling Light Distribution of Galaxies with Different Functions
The structural properties such as Sérsic index, effective radius, disk scale length, P.A., minor to major axis ratio, and bulge to total of ETGs having tidal features are presented in Table 4. As noted in Section 2.2, we perform GALFIT twice. The preliminary GALFIT run is on the image where foreground stars and background galaxies were masked out and the second GALFIT run is on the image where tidal features were also masked out. The results in Table 4 are obtained with the images where tidal features were also masked out. The differences between two different runs show that the Sérsic indices, effective radii of bulges, and scale lengths of disks decrease by less than 10%, except for NGC 474, where the effective radius of the bulge component that was obtained from the Sérsic only model fit decreases by ∼20% from the first preliminary GALFIT run to the second GALFIT run.
We exclude galaxies that have muxbleeds and close companions from our final sample as discussed in the previous section and present the results for seven ETGs. Because not all ETGs follow the R1/4 law, we need to test several model profiles to see which one best describes the two-dimensional light distribution of these galaxies. Even though galaxies were once classified as ellipticals, some of those ellipticals might actually be misclassified S0s. By including a disk component in the model, we increase our chance of diagnosing such cases. Some of those examples are NGC 2634 and NGC 5018. They were first classified as ellipticals in the RC3 using the optical band, but recently they were reclassified as S0s (Buta et al. 2010) from 3.6 μm data. In fact, except for NGC 680 and NGC 5576, all galaxies are classified as S0s, and, therefore, we also present disk scale lengths of these galaxies in Table 4. We see that parameters such as the Sérsic index, the effective radius, or the disk scale length change with chosen model. We compare the differences in the effective radii in Figure 8. The left panel shows differences in the effective radii obtained from the Sérsic model fit and the de Vaucouleurs R1/4 model fit. For most galaxies, the effective radii obtained from the de Vaucouleurs R1/4 model fit are smaller than those from the Sérsic model fit and they cluster between 2 and 3 kpc. The middle panel of Figure 8 compares the effective radii of the bulge components, estimated from a fit of Sérsic (for bulge, n = free) + exponential disk model fit and Sérsic (for bulge, n = free)+Sérsic (for disk, n = free) model. For the Sérsic (n = free)+Sérsic (n = free) model, we adopt the component with a larger Sérsic index as a bulge and the one with smaller Sérsic index as a disk. For NGC 1222 and NGC 2634, the effective radius of the larger Sérsic index component (bulge) is larger than that of the smaller Sérsic index component (disk). Therefore, for those two galaxies, this model profile fit may not be realistic, but for reference we keep those data in Figures 8–10. If we introduce a disk component to our model galaxies, the effective radius of the bulge component becomes smaller. We see this in the distribution of effective radius in the left and middle panel. Therefore, we must be careful not to blindly classify all galaxies as ETGs and treat them as a group, but we must model the lenticular galaxies including a disk component.

Figure 8. Comparison of structural parameters among different choices of models. The numbers next to each point are the NGC numbers of the sample galaxies investigated in this study. The left panel shows differences in the effective radii of the bulge obtained from Sérsic (n = free) and de Vaucouleurs R1/4 model fit. The middle panel compares the effective radii of the bulge estimated from the fit of Sérsic+exponential disk and Sérsic+Sérsic model fit. The right panel compares the effective radii of the disk component obtained from the fit of Sérsic+exponential model fit and Sérsic+Sérsic model. Dashed lines guide one-to-one correspondence. Note that the Sérsic+Sérsic model fit of NGC 1222 and NGC 2634 may not be realistic, as denoted in Table 4.
Download figure:
Standard image High-resolution image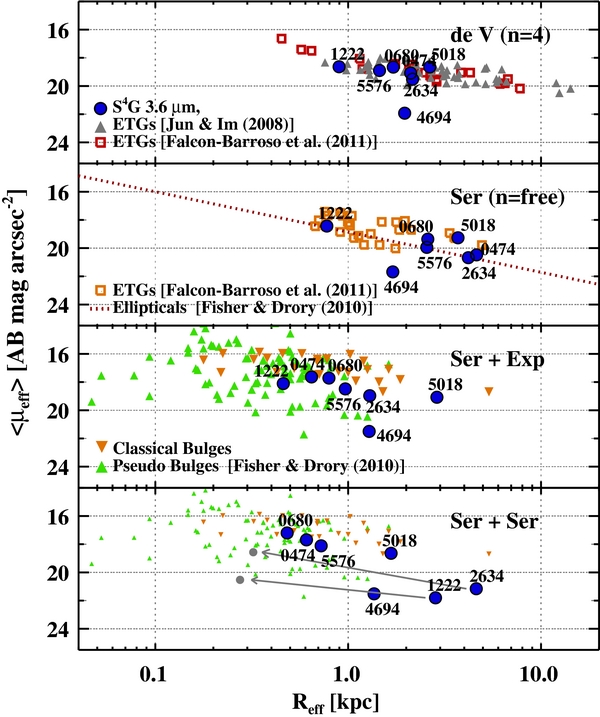
Figure 9. Kormendy relation of ETGs showing tidal features. The effective radii were converted to the circularized effective radii, Reff. The uppermost panel shows the result of de Vaucouleurs fit. Gray triangles indicate normal ETGs from Jun & Im (2008) and red squares indicate ETGs modeled with Sérsic index n = 4 from Falcón-Barroso et al. (2011). The upper middle panel shows the result from n = free Sérsic fit. The red dotted line represents ellipticals of the Virgo Cluster from Kormendy et al. (2009). The orange squares indicate ETGs that were modeled with free Sérsic index from Falcón-Barroso et al. (2011). The lower middle panel shows the result of Sérsic (for the bulge component) plus exponential fit (for the disk component). The orange and green triangles represent the galaxies with classical and pseudo bulge, respectively, from Fisher & Drory (2010). The lowermost panel shows the result of the fit with two Sérsic functions. Gray arrows from NGC 1222 and NGC 2634 connect to the points if we exchange the bulge and disk component (see the text for detail).
Download figure:
Standard image High-resolution image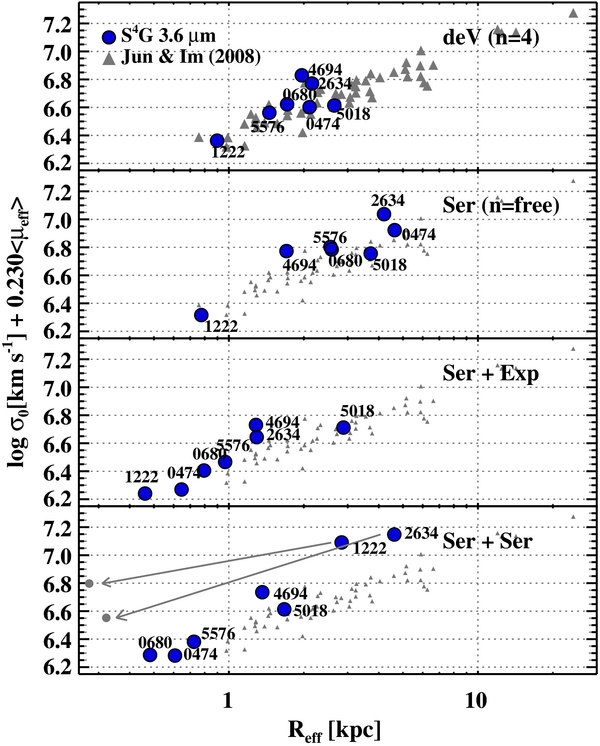
Figure 10. Fundamental plane of ETGs with tidal features. The effective radii, which are presented here were converted to the circularized effective radii, Reff. The blue circles represent the result from this study and results from four different model fit were plotted in each panel. In the uppermost panel, blue circles represent the result of de Vaucouleurs fit. ETGs of Jun & Im (2008) were plotted in gray triangles for comparison. The upper middle panel shows the result of Sérsic fit and the lower middle panel shows the result of Sérsic (for bulge) plus exponential (for disk) fit. Reff and μeff are those of the bulge component alone. The fit with Sérsic+Sérsic profile is plotted in the lowermost panel. Note that gray triangles of Jun & Im (2008) represent the result obtained with the R1/4 profile, hence only the uppermost panel shows a direct comparison, but we plot them together in the other panels for comparison. The gray arrows from NGC 1222 and NGC 2634 connect to the points if we exchange the bulge and disk component (see the text for detail).
Download figure:
Standard image High-resolution image
If we let GALFIT model a disk component with a free Sérsic index, we find that the Sérsic index of the disk is never equal to 1, as would be expected for a conventional exponential disk. This may be because disks of galaxies cannot be characterized by a single Sérsic index (Freeman 1970). In spiral galaxies, the outer disks show truncations (down-bending) or anti-truncations (up-bending) profiles (e.g., Pohlen et al. 2002; Erwin et al. 2005; Muñoz-Mateos et al. 2009, J. C. Muñoz-Mateos et al. 2012, in preparation). Even though the Sérsic index deviates from n = 1, the effective radius of the exponential disk from the Sérsic+exponential model fit and Sérsic+Sérsic model fit is quite similar, as seen in the right panel of Figure 8.
We tabulate kinematic class (Emsellem et al. 2011) and kinematic misalignment angle (Krajnović et al. 2011) in Table 2. If galaxies show tidal features, there should be imprints on the kinematics of those galaxies, and we check the result of our sample galaxies against those of the ATLAS3D study. NGC 474, NGC 680, and NGC 1222 show a rather large kinematic misalignment (Ψ > 20°) between the photometric and kinematic major axes. Only 10% (25/260) of ATLAS3D galaxies have Ψ > 20° and these are extreme cases. We find that one of our shell galaxies (NGC 474) and the galaxies with tidal disturbances (NGC 680 and NGC 4694) are better fitted with a disk component—these galaxies were classified as fast rotators (Emsellem et al. 2011). This result is consistent with the finding of Cappellari et al. (2011b) that fast rotators are generally lenticular galaxies. One exception is NGC 5576. We find that this galaxy is better described with disk component, but it is classified as a slow rotator (Emsellem et al. 2011) and, according to Krajnović et al. (2011), it is classified as a non-regular rotator, which does not show any specific feature on the velocity map, such as kinematically distinct core or kinematic twist or counterrotating core. But Krajnović et al. (2011) also note that it is possible that in lower noise velocity map, the galaxy would be classified as a regular rotator, which implies it might have a disk component. Thus, our results from model fits are in agreement with the kinematic study from ATLAS3D.
We find that the total magnitudes that were obtained assuming a specific model fit can vary among the different fits. For example, the total magnitude of NGC 474 varies up to 0.3 mag between n = 4, de Vaucouleurs' fit and n = free Sérsic fit. If a galaxy is better described by an n < 4 fit, but modeled with n = 4, then we obtain a brighter total magnitude. On the other hand, if a galaxy is better described by a n > 4 fit, but modeled with n = 4, then we obtain a fainter total magnitude. For NGC 1222 and NGC 4694, Sérsic indices of one-component Sérsic fits are smaller than 4, and the total magnitudes obtained with those Sérsic models are larger than those from de Vaucouleurs' fits. For other galaxies that have n > 4, the opposite holds. Studies of ETGs often estimate total magnitudes assuming their light profiles as de Vaucouleurs' law. But, as shown here, it is important to consider the differences due to the fitting model to obtain reliable estimates.
5.2. Scaling Relations
Surface brightnesses and effective radii are determined by the choice of the adopted model profile, as evident in Figures 8–10. Therefore, we need to be careful when we compare our results with those from other studies, especially when we compare with galaxies that were modeled with different types of fit. We present the KR, a relation between the effective radius and the mean surface brightness at that radius for ETGs showing tidal features in Figure 9. To make comparisons with other studies, we also plot KRs from the literature, which were obtained from the same 3.6 μm band. Each panel shows the KR obtained with a specific model fit. We show the KR derived from the n = 4 profile fit in the uppermost panel together with the results of ETGs from Jun & Im (2008) in gray triangles and Falcón-Barroso et al. (2011) in red squares. Note that structural parameters (reff and 〈μeff〉) of these two studies were obtained with one-dimensional R1/4 profile fittings, while our data were obtained with two-dimensional model fits. ETGs presented in Falcón-Barroso et al. (2011) can be divided into two groups that have Sérsic index n = 4 and n = free. We only plot ETGs that have n = 4 in this panel. In the second panel of Figure 9, we plot the result from a Sérsic (n = free) fit. To compare with normal elliptical galaxies, we draw a red dotted line adopted from Figure 8 of Fisher & Drory (2010), which represents elliptical galaxies of the Virgo Cluster from (Kormendy et al. 2009). Since these galaxies were originally studied in the optical band, Fisher & Drory (2010) shifted the surface brightness measurement to the L' band. We also plot ETGs from Falcón-Barroso et al. (2011) that were fit with Sérsic index n = free in orange squares. In the third panel, we show the result of a Sérsic (for the bulge) plus exponential fit (for the disk). In the Sérsic+exponential fit, the values of reff and μeff are those of the bulge component. We also plot the classical bulge (in orange triangle) and pseudo bulge (in green triangle) of Fisher & Drory (2010). Their structural parameters were determined by fitting the surface brightness profiles with a one-dimensional Sérsic function plus an exponential outer disk. The last panel shows the result of the fit with a Sérsic plus Sérsic function. The classical and pseudo bulges are the same as above, and they were plotted just for comparison. However, because a different fitting model is used, we cannot apply direct comparison in the lowermost panel. NGC 4694 is a galaxy with a nuclear H ii region (Véron-Cetty & Véron 2006) and the velocity dispersion of this galaxy is 61 km s−1. Therefore it falls below the main KR of ETGs, similar to dwarf galaxies showing nuclear star formation. Except for NGC 4694, ETGs with tidal features do not stand out in the KR from the non-interacting normal ETGs of Jun & Im (2008) and Falcón-Barroso et al. (2011).
We present the FP, which is an empirical scaling relation between the effective radius, the mean surface brightness, and the central velocity dispersion of tidally disturbed ETGs in Figure 10, where the axes are projected in the direction of the smallest scatter at 3.6 μm as provided by Jun & Im (2008). As in Figure 9, we show FPs derived with four different surface brightness profile models. In this figure, we compare the FPs of our sample galaxies only with those of Jun & Im (2008). The triangles of Jun & Im (2008) represent the results obtained with the R1/4 profile, and hence only the uppermost panel shows a direct comparison, but we plot them together in the other panels for comparison. Velocity dispersions were adopted from Hyperleda. As discussed in the previous section, the Sérsic+Sérsic model fit of NGC 1222 and NGC 2634 may not be ideal because the effective radii of the bulge component are larger than those of the disk component. We draw gray arrows in the lowermost panel of Figures 9 and 10 representing an exchange of the values of reff and μeff of the bulge and disk components. We find that tidally disturbed ETGs lie on the same plane as do normal ETGs (Jun & Im 2008) and Virgo ellipticals (Kormendy et al. 2009). Because galaxies exhibiting tidal features do not occupy a distinct region in the KR or FP, this implies that the structural properties of the spheroidal components of tidally disturbed galaxies are not significantly different from those of the other ellipticals or the spheroids of galaxies with no signs of tidal interaction.
Our result is consistent with the findings of numerical simulations of mergers that show that the FP is preserved during gas-poor, dissipationless major merging events (Capelato et al. 1995; González-García & van Albada 2003; Nipoti et al. 2003; Boylan-Kolchin et al. 2005, 2006). Rothberg & Joseph (2006) also find observationally that most of the single-nuclei merger remnants, including shell galaxies, appear to lie on the K-band FP or within the scatter of the ellipticals taken from Pahre (1999).
On the other hand, simulations show that projections of the FP, such as the KR and the Faber–Jackson relation (FJR; Faber & Jackson 1976), are not preserved via dry mergings (Nipoti et al. 2003; Boylan-Kolchin et al. 2006). Boylan-Kolchin et al. (2006) showed that the location of merger remnants in the FJR and KR is sensitive to the amount of the energy transferred from the bulge to the dark matter halos during the merger. They claimed that mergers on orbit with large angular momentum would experience more dynamical friction. This results in galaxies with larger velocity dispersion (smaller β in Reff∝Lσβeff) and smaller reff (smaller α in Reff∝Mα*). Therefore, such galaxies form a less steep KR and FJR. While the end product of mergers on orbits with less angular momentum will form steeper KR and FJR, i.e., have higher α and β. But in Figure 5 (KR) of Rothberg & Joseph (2006), shell galaxies and other merger remnants, except for luminous and ultra-luminous infrared galaxy mergers, also lie within the scatter (Pahre 1999), consistent with our result in the KR.
Our results do not mean that the properties of the galaxies showing tidal debris have not changed as a result of the merging events. It is more likely that tidal features induced in minor mergers or interactions do not affect bulge properties. Alternatively, if those tidal features were caused by major mergers, then enough time has passed for their bulges to relax and become similar to those of ETGs that do not show tidal disturbances. By checking Hβ0 line indices, Falcón-Barroso et al. (2011) show that outliers from the FP tend to have young stellar populations in common. Having young stellar populations might be a more efficient way to push galaxies off the FP than dry merging as also suggested by the E+A findings (Yang et al. 2008). We infer that the dynamical scattering of the FP due to a merging event last only for a relatively short timescale. This is also in agreement with the finding that ETGs show a tight relation in the FP. Thus, through dry merging events between galaxies that do not have enough gas to trigger star formation, galaxies appear to slide along the FP in the direction of larger effective radii, rather than lie off the FP.
6. SUMMARY AND CONCLUSIONS
In a sample of ETGs drawn from S4G that have T ⩽ 0, we perform unsharp masking, two-dimensional fitting, and derive structure maps to search for tidally disturbed ETGs. We identify shells, ripples, tidal tails, or broad fans of stars in 17% ± 3% (11/65) of ETGs with the imaging data that have average depth of 〈μ3.6, AB,〉(1σ) ∼ 27 mag arcsec−2 at 3.6 μm.
We estimate that the tidal disturbances contain 3%–10% of the total 3.6 μm galaxy luminosity, which can be directly translated to the stellar mass contained in the debris.
To investigate the structural properties of tidally disturbed galaxies, we modeled the galaxies with four different functions: de Vaucouleurs, Sérsic, Sérsic+exponential, and Sérsic+Sérsic profile. We find that the precise measurement of structural parameters depends on the adopted decomposition model. We also find that the total magnitudes of galaxies vary among different model fits.
We explored the position of these galaxies in the KR and FP and find that ETGs with tidal debris occupy the same area as those galaxies without tidal debris or bulges of early-type systems. This implies that the bulge properties of tidally disturbed galaxies are not significantly different from those of normal ETGs. We infer that dry merging cause galaxies to slide along the FP and minor merging or weak interactions that cause tidal disturbances in our sample either affect only outer part of the galaxy, or enough time has elapsed that the bulges of the tidally disturbed galaxies are well relaxed. Thus, having young stellar populations might be a more efficient way to make galaxies deviate from the FP than going through dry merging events.
The S4G will survey over 2300 nearby galaxies by the end of 2012, and this study will be extended to include a complete set of 180 ETGs.
T.K. is grateful to the entire S4G team for their efforts in this project. We thank Hyunsung David Jun for kindly sharing the data of the Jun & Im (2008) paper. We also thank Jesus Falcon-Barroso for providing us with updated data from Falcón-Barroso et al. (2011). We are grateful to the anonymous referee for helpful comments and suggestions that have improved this paper.
T.K., K.S., J.-C.M.-M., and T.M. acknowledge support from the National Radio Astronomy Observatory. The National Radio Astronomy Observatory is a facility of the National Science Foundation operated under cooperative agreement by Associated Universities, Inc. M.G.L. was supported in part by Mid-career Research Program through the NRF grant funded by the MEST (No. 2010-0013875). This work was co-funded under the Marie Curie Actions of the European Commission (FP7-COFUND). E.A. and A.B. thank the Centre National d'Etudes for support.
This research is based on observations and archival data made with the Spitzer Space Telescope, and made use of the NASA/IPAC Extragalactic Database (NED) which are operated by the Jet Propulsion Laboratory, California Institute of Technology under a contract with National Aeronautics and Space Administration (NASA). We acknowledge the usage of the HyperLeda database (http://leda.univ-lyon1.fr).
Facility: Spitzer - Spitzer Space Telescope satellite
Footnotes
- 19
- 20
- 21