


 t 17, B-4000 Liège, Belgium; valerie.vangrootel@ulg.ac.be
ABSTRACT
In light of the exciting discovery of g-mode pulsations in extremely low-mass, He-core DA white dwarfs, we report on the results of a detailed stability survey aimed at explaining the existence of these new pulsators as well as their location in the spectroscopic Hertzsprung–Russell diagram. To this aim, we calculated some 28 evolutionary sequences of DA models with various masses and chemical layering. These models are characterized by the so-called ML2/α = 1.0 convective efficiency and take into account the important feedback effect of convection on the atmospheric structure. We pulsated the models with the nonadiabatic code MAD, which incorporates a detailed treatment of time-dependent convection. On the other hand, given the failure of all nonadiabatic codes, including MAD, to account properly for the red edge of the strip, we resurrect the idea that the red edge is due to energy leakage through the atmosphere. We thus estimated the location of that edge by requiring that the thermal timescale in the driving region—located at the base of the H convection zone—be equal to the critical period beyond which ℓ = 1 g-modes cease to exist. Using this approach, we find that our theoretical ZZ Ceti instability strip accounts remarkably well for the boundaries of the empirical strip, including the low-gravity, low-temperature regime where the three new pulsators are found. We also account for the relatively long periods observed in these stars, and thus conclude that they are true ZZ Ceti stars, but with low masses.
Export citation and abstract BibTeX RIS
1. INTRODUCTION
White dwarfs with masses less than about 0.45 M☉ are expected to harbor He cores. They are understood to be the products of stars experiencing strong mass loss on the red giant branch before the onset of He burning in their cores. The mass loss can be related to strong stellar winds in high-metallicity environments (D'Cruz et al. 1996) or mass transfer via binary evolution, leading, in particular, to double-degenerate systems (Ergma et al. 1998; Sarna et al. 2000; Bassa et al. 2003). And indeed, many low-mass white dwarfs are found in binary systems, and in particular are the usual companions of millisecond pulsars (Marsh et al. 1995; van Kerkwijk et al. 2005).
In this context, the search for pulsations in low-mass, He-core DA white dwarfs was spearheaded by Steinfadt et al. (2010), who made a strong case for the importance and significance of finding such objects. These authors built several representative sequences of He-core DA stars with masses ranging from 0.15 M☉ to 0.20 M☉ and analyzed their pulsation characteristics, particularly the question of mode propagation. They provided a first view of the basic adiabatic pulsation properties of such stars.
In terms of mode stability, in the absence of full nonadiabatic calculations, Steinfadt et al. (2010) estimated the location of the blue edge of a possible instability strip for low-mass DA white dwarfs using the semi-analytic criterion discussed by Brickhill (1991b) as applied to their stellar models. This criterion proposes a comparison of a "representative" period P—chosen as the one corresponding to the g-mode with ℓ = 1 and k = 1 in the models considered by Steinfadt et al.—with the thermal timescale τth at the base of the H convection zone of a given model according to the formula P ≃ 8πτth. This is based on the so-called convective driving mechanism originally proposed by Brickhill (1983, 1990, 1991a, 1991b) in his series of seminal papers to account for g-mode instabilities in ZZ Ceti white dwarfs. Steinfadt et al. (2010) thus obtained a blue edge representing an extension of the ZZ Ceti instability strip into the low-mass regime in the log g–Teff plane (the circles in their Figure 3). Although the authors did not specify what convective efficiency they actually used in their calculations, it is likely that they employed the standard version of the mixing-length theory (denoted as ML1/α = 1.0 in white dwarf jargon) because they imported MESA subroutines (Paxton et al. 2011), where this is the default option.
In a follow-up effort on the observational side, Steinfadt et al. (2012) searched for luminosity variations in a handful of low-mass He-core DA white dwarfs, concentrating in particular on a few targets lying just to the right of their estimated blue edge in the spectroscopic Hertzsprung–Russell (HR) diagram. According to the theoretical estimates of Steinfadt et al. (2010), it was hoped that some of these objects would show g-mode pulsational instabilities. Unfortunately, none were detected, but given the rarity of confirmed low-mass white dwarfs, the uncertainties on the atmospheric parameters of the known ones, the limitations on the available photometric observations, and the lack of full nonadiabatic calculations, Steinfadt et al. (2012) still concluded that it would be worthwhile to pursue the search, especially in view of new samples of He-core white dwarfs becoming available.
The most significant effort on this front in the last few years has been the so-called ELM (as in "extremely low mass") white dwarf survey which has led to the first results published in a series of papers by Brown et al. (2010, 2012) and Kilic et al. (2011, 2012). Table 4 of Kilic et al. (2012), for example, provides basic data for 40 low-mass white dwarfs that have been observed so far for radial velocity variations within the ELM project. This sample has provided a growing list of potential candidates for variability, and an observing program was set up at the McDonald Observatory to monitor the most promising targets. This new program has led to the recent discovery of the first pulsating extremely low-mass white dwarf, SDSS J1840+6423, as reported by Hermes et al. (2012). It is a DA star with Teff ≃ 9140 ± 170 K and log g ≃ 6.16 ± 0.06, according to Brown et al. (2012). It is part of a compact binary system with an invisible companion orbiting about their barycenter with a period of 4.59 hr (Kilic et al. 2012). Due to its most probable formation channel, common envelope evolution, SDSS J1840+6423 most likely possesses an He core. It shows multiperiodic modulations with a dominant period of about 4698 s, quite large by ZZ Ceti standards, but not unexpected given its very low surface gravity.
Even more recently, the McDonald Observatory program has revealed the existence of two additional pulsating extremely low-mass DA white dwarfs (Hermes et al. 2013), thus opening up a new and exciting avenue of research in the field of asteroseismology. SDSS J1112+1117 is characterized by Teff ≃ 9400 ± 490 K and log g ≃ 5.99 ± 0.12 (Brown et al. 2012), and shows at least five independent periodicities in its light curve, ranging from 1793 s up to 2856 s. For its part, SDSS J1518+0658 is characterized as having Teff ≃ 9810 ± 320 K and log g ≃ 6.66 ± 0.06 (Brown et al. 2012), and its light curve shows 6 independent periodicities ranging from 1339 s to 3680 s. As pointed out by Hermes et al. (2012) and J. J. Hermes et al. (2012, in preparation), there is no doubt that the detected light modulations are caused by g-mode pulsational instabilities.
As is always the case when a new type of pulsating star is discovered, a few obvious questions arise: (1) What is the driving mechanism in these objects? (2) Can the observed periods be accounted for? (3) Are these variables part of an instability domain in the spectroscopic HR diagram and, if so, can that domain be mapped properly? A detailed stability survey must be carried out to answer these questions, and this is the precise aim of this paper. We are particularly well equipped to address this problem, since we have recently reinvestigated the question of the ZZ Ceti instability strip with the help of improved evolutionary models that take into account the feedback effect of convection on the atmospheric structure (as opposed to standard gray atmospheres). Our group used the nonradial, nonadiabatic pulsation code MAD, which is the only code that has practically implemented a full time-dependent treatment of convection for both p- and g-mode pulsations (Dupret 2002; Grigahcène et al. 2005). This is in contrast with the standard frozen convection (FC) approximation approach used in most nonadiabatic codes employed in white dwarf studies. The first results of this project have been published in Van Grootel et al. (2012), and we refer to that paper for technical details that are of importance in the present work.
2. EVOLUTIONARY SEQUENCES
It should be pointed out at the outset that in order to map the ZZ Ceti instability strip and its possible extension into the low-mass regime (assuming for the time being that the observed instabilities are indeed due to the same partial ionization mechanism at work in ZZ Ceti stars), only a detailed treatment of the H envelope is required, since this is where the excitation physics resides. Of course, the nature of the core composition as well as the precise envelope layering leaves distinct signatures on the distribution of excited periods (this is the realm of adiabatic seismology), but they do not affect the location of an unstable model in the log g–Teff plane. In fact, a perfectly suitable mapping of the theoretical ZZ Ceti strip could be derived with the help of simple pure H envelope models.
This simplifying circumstance has allowed us to attack the problem with the help of simple white dwarf cooling sequences, with no a priori knowledge of their past history. We thus computed a first series of white dwarf sequences to connect with the work of Van Grootel et al. (2012) on the "normal" ZZ Ceti stars. These models are quite similar in the sense that they are made of a pure C core, surrounded by an He mantle containing a mass fraction log q(He) = −2.0, which is itself surrounded by a H envelope of mass fraction log q(H) = −4.0. Likewise, all of these sequences have been calculated under the assumption that convection in the H partial ionization zone could be modeled in terms of the so-called ML2/α = 1.0 version of the mixing-length theory, which is defined by a more potent efficiency than the one characterizing the standard ML1/α = 1.0 version (see Arcoragi & Fontaine 1980 for details). In addition, and of prime importance in the present mapping exercise, all of these sequences incorporate a treatment of the atmosphere that mimics the use of a non-gray atmosphere on the superficial H convection zone, namely, the feedback reaction of convection on the atmospheric structure, an effect neglected when using standard gray atmospheres in evolutionary calculations (see Van Grootel et al. 2012 for a recent discussion of this point, their Figure 5 in particular). The first series of C-core evolutionary models thus contains structures that differ only in their masses: 0.45, 0.40, 0.35, 0.30, 0.25, 0.20, 0.15, and 0.125 M☉. We are fully aware that C-core white dwarfs with masses equal to or less than about 0.45 M☉ are unlikely to exist in nature, but, again, this has no consequence on our mapping exercise, and these low-mass models allow us to connect with the more massive models (0.5, 0.6, 0.7, 0.8, 0.9, 1.0, 1.1, and 1.2 M☉) of Van Grootel et al. (2012).
In order to demonstrate explicitly that the instability region in the log g–Teff plane is insensitive to the details of the interior structure of the equilibrium models used in the exercise, we computed a second family of evolutionary sequences for low-mass white dwarfs, but, this time, assuming a pure He core. These models all have an assumed pure H "thick" envelope containing log q(H) = −2.0 sitting on top of the He core, the rest being the same as before. They have masses given by 0.45, 0.40, 0.35, 0.30, 0.25, 0.20, 0.19, 0.18, 0.17, 0.16, and 0.15 M☉. In addition, and for comparison purposes, we also calculated yet another similar sequence of mass 0.17 M☉, but with a "thin" H envelope, with log q(H) = −3.7. We are aware that detailed modeling of low-mass He-core DA white dwarfs leads to a rather complicated situation as described by Driebe et al. (1998), Althaus et al. (2001), and, more recently, by Panei et al. (2007). Roughly speaking, He-core white dwarfs with masses less than about 0.2 M☉ are expected to have a thick H envelope with residual stable burning at its base. Such H burning contributes significantly to the luminosity, even at relatively low effective temperatures, and leads to very long cooling timescales. In contrast, more massive He-core white dwarfs are expected to have reduced their H layer to the point where residual H burning is no longer a factor, and these objects are then expected to cool much faster than their less massive counterparts. We did not take into account residual H burning in our family of simple cooling models with a thick H envelope, so our cooling rates are certainly inadequate. However, as mentioned above, this does not affect our stability survey. We must point out, in this context, that residual H burning could lead, in principle, to pulsational instabilities through the  -mechanism (as already noted by Steinfadt et al. 2010 and Hermes et al. 2012). However, this mechanism cannot explain the periods observed in the newly discovered low-mass pulsating DA white dwarfs. Indeed, only periods comparable to the local thermal timescale in the driving region can be generally excited in stars. In the present case, the potential driving region for the -mechanism, the base of the H envelope, is located quite deep in the star, where the local thermal timescale is very large (orders of magnitude larger) compared to the observed periods.
3. STABILITY SURVEY
3.1. The Blue and Red Edge of the Theoretical ZZ Ceti Instability Strip
The physics of the ZZ Ceti instability strip has a long and interesting history, which has been summarized in the review of Fontaine & Brassard (2008, see their Section 5 in particular). Other views have been presented in Winget & Kepler (2008) and Althaus et al. (2010). In the absence of a better description for treating the interactions between convection and pulsation (which are intimately connected in ZZ Ceti stars), the early efforts concentrated on the blue edge with the help of nonadiabatic pulsation codes that treated convection in the simplest possible way, i.e., by ignoring the perturbations of the convective flux. This is usually referred to as the FC approximation.
In this connection, Brickhill (1983) pointed out that a better approach would be to assume that the convective flux responds instantaneously to pulsations—the exact opposite of the FC approximation—because, in fact, the turnover timescale in the convection zone of a ZZ Ceti model is usually much smaller than the pulsation periods of interest. He went on to develop a semi-analytic model of the ZZ Ceti instability strip based on this notion of instantaneous reaction (Brickhill 1990, 1991a, 1991b). Among other results, Brickhill proposed a criterion for estimating the location of the blue edge, P ≃ 8πτth, as briefly discussed in the Introduction. This formula has proven its worth as an order-of-magnitude estimator and, indeed, has been used many times by various researchers for approximating the location of the blue edge of white dwarf instability strips (DAVs, DBVs, hot DQVs, and ELM DAVs) without doing any pulsation calculations. However, it should be pointed out that an important drawback of the method is that it suffers from a certain degree of "fuzziness," in the sense that it is not clear a priori what the appropriate value of the representative period P should be in a given situation. Furthermore, the criterion represents a necessary, but not a sufficient, condition for driving. It ultimately needs to be validated by detailed nonadiabatic stability calculations.
To our knowledge, Brassard & Fontaine (1997, 1999) were the first and only ones to implement this notion of instantaneous convection (IC) reaction into a complete nonadiabatic pulsation code in a white dwarf context. They found that IC predicts a hotter blue edge than FC does, by 200 to 500 degrees for ZZ Ceti models, depending on the surface gravity and the convective efficiency assumed in the models. More recently, the nonradial, nonadiabatic code MAD developed at the Université de Liège (Dupret 2002), incorporating a time-dependent convection (TDC) treatment in the framework of the mixing-length theory (Grigahcène et al. 2005), was adapted to study how g-mode pulsations develop in V777 Her (DBV) white dwarfs (Dupret et al. 2008; Quirion et al. 2008) and in the more difficult case of ZZ Ceti stars (Van Grootel et al. 2012), where the ratio of the convective to total flux is significantly larger. Among other results, Van Grootel et al. (2012) found that the blue edge for 0.6 M☉ DA models computed with ML2/α = 1.0 convection is about 240 K hotter with TDC than with FC. We note here that TDC should reduce to IC, as long as the convective turnover timescale remains much smaller than the pulsation periods of interest, which is quite generally the case at the ZZ Ceti blue edge.
Whether they treat convection in FC, IC, or TDC, all of the nonadiabatic pulsation codes that have been used so far in a white dwarf context suffer from a common problem: they all predict a red edge much cooler than the empirical value, typically by thousands of degrees. This is a well-known shortcoming that is most often encountered when carrying out nonadiabatic calculations on convective stars. So, while the physics at the blue edge is deemed to be well understood, it is generally acknowledged that there could be some important missing ingredients in the codes to properly describe the red edge (see Van Grootel et al. 2012 for a very brief discussion of this). Alternatively, the red edge could be caused by other effects, such as nonlinearities, for example.
In this context, we would like to propose yet another possibility to account for the existence of the red edge. This is based on the original idea of Hansen et al. (1985), who were mainly interested in estimating the lower and upper bounds of periods in pulsating white dwarfs. Surprisingly, and to our knowledge, their powerful physical argument has not yet been put to the test as an estimator of the red edge. It goes as follows: the red edge of the g-mode instability band along a cooling sequence is reached when the thermal timescale, τth, at the base of the convection zone (where the driving region is located) overtakes the critical period, Pcrit, beyond which such modes cease to exist. The critical period defines the limit beyond which outgoing g-waves will no longer be reflected back by the atmospheric layers and will lose their energy in space. Hansen et al. (1985) have provided a useful prescription for estimating Pcrit, and we have implemented it to run with a given model. It is a function of the degree of the g-mode, with Pcrit∝(ℓ(ℓ + 1))−0.5. Our proposed criterion for the red edge is then τth ≃ Pcrit for a given value of ℓ. It has the merit, compared to the blue edge criterion proposed by Brickhill, of having no "fuzziness" in the sense that the two quantities of interest can readily be computed for a given stellar model. We have applied that criterion to estimate the location of the ℓ = 1 red edge for the ZZ Ceti instability strip, and the results are rather remarkable, as discussed below.
3.2. Universality of the Instability Domain
In the course of our survey, we first explicitly verified our assertion that the structural properties do not affect the question of mode stability, given DA models with the same values of log g and Teff. This is shown in Figure 1, where our evolutionary tracks are plotted in the relevant domain of the spectroscopic HR diagram. For each track, we pulsated a number of models in order to find a blue edge (and a red edge) of a possible instability strip with modes excited by the convective driving mechanism associated with the H partial ionization zone. This was done, as a first step, with the nonadiabatic code MAD in its FC option. Only dipole modes were considered in this search.
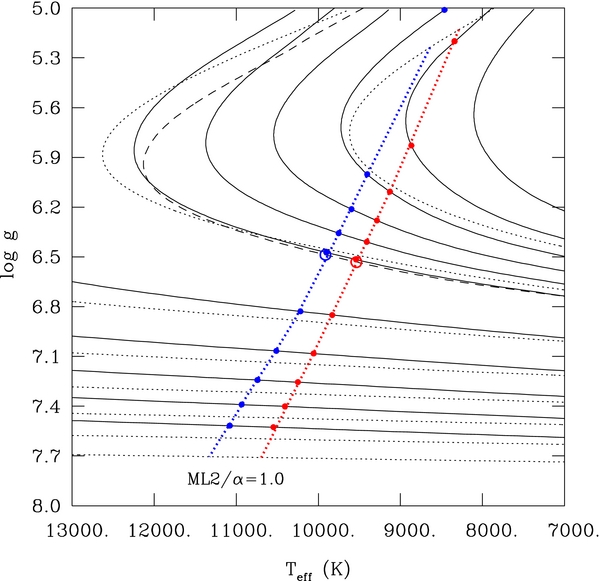
Figure 1. Universality of the theoretical instability strip with respect to a plethora of evolutionary tracks which include C-core models with "thick" H–He layering (log q(He) = −2.0, log q(H) = −4.0) with masses of 0.45, 0.40, 0.35, 0.30, 0.25, 0.20, 0.15, and 0.125 M☉ (dotted curves, from bottom to top), He-core models with a "thick" H envelope (log q(H) = −2.0) with masses of 0.45, 0.40, 0.35, 0.30, 0.25, 0.20, 0.19, 0.18, 0.17, 0.16, and 0.15 M☉ (solid curves, from bottom to top), and a single track corresponding to a 0.17 M☉ He-core model with a "thin" H envelope (log q(He) = −3.7) depicted by the dashed curve. The points defining the blue and red edges along the C-core model tracks are joined together by dotted straight lines. By comparison, the corresponding models along the He-core tracks are located by small filled circles (large open circles in the single case of the He-core track with models with a thin H envelope).
Download figure:
Standard image High-resolution imageA blue edge corresponding to the straight extension of the blue side of the known theoretical ZZ Ceti instability strip into the low-mass regime was found. This is illustrated by the blue features in Figure 1. The dotted blue curve on the left and superposed on the evolutionary tracks connects the blue edges of each of the C-core tracks (dotted black curves). The locations of the latter were found by interpolation in log g and Teff between the last stable model on a sequence and the first unstable model.
As a comparison, the blue dots on the left define the corresponding blue edges for each of the He-core tracks with log q(He) = −2.0. Likewise, the open blue circle on the left defines the blue edge of the He-core sequence with a thin H envelope (the appropriate track is plotted as a dashed curve). Clearly, in view of the finite resolution of the evolutionary sequences, the blue edge is indeed independent of total mass, core composition, or envelope layering for models with the same values of log g and Teff. That is not to say that the spectra of excited periods are the same. On the contrary, these spectra bear the specific signature of the overall structure of the various models.
To the right of the blue edge depicted in Figure 1, all models are unstable according to our nonadiabatic calculations, including those belonging to the 0.15 M☉ He-core sequence in the right upper corner of the diagram. As described in the previous subsection, this is a well-known shortcoming of nonadiabatic calculations on convective stars in general: the red edge is predicted to be much cooler than the empirical value. In our present approach with FC convection (and this is also true in TDC), the nonadiabatic red edge along these various sequences is found to be well below 7000 K, the limiting value considered in Figure 1.
However, if we are correct in our suggestion that the red edge is really due to energy leakage through the atmosphere, then the application of the criterion τth ≃ Pcrit readily leads to the red features in Figure 1 for an assumed value of ℓ = 1. We thus find a red edge that is only a few to several hundred degrees cooler than the blue edge in this part of the HR diagram. Furthermore, and of immediate interest, Figure 1 also demonstrates that, as in the case of the blue edge, the location of the proposed red edge in the log g–Teff plane is insensitive to mass, core composition, or envelope layering.
3.3. Main Results
The main results of our mapping exercise are presented in Figure 2. We find that the "normal" ZZ Ceti instability strip (associated with convective driving) extends well into the low-mass regime, covering some four orders of magnitude in surface gravity. Our best estimate of the blue edge of the strip is provided by the blue solid curve obtained in TDC. It is systematically hotter than the prediction based on the FC approximation (the blue dashed curve). Likewise, our best estimate of the red edge (based on the criterion τth ≃ Pcrit) is illustrated by the red solid curve on the right. We thus find a relatively narrow theoretical instability strip, which gets narrower with decreasing surface gravity as the predicted red edge shows a larger slope than the blue edge in this log g–Teff diagram. The illustrated theoretical strip specifically refers to the ML2/α = 1.0 convection and to g-modes with ℓ = 1. A slight shift of the boundaries of the strip to higher effective temperatures is found for ℓ = 2 modes (ΔTeff ≃ 110 K at the blue edge and ΔTeff ≃ 90 K at the red edge for M = 0.6 M☉, log g ≃ 8.0 models).
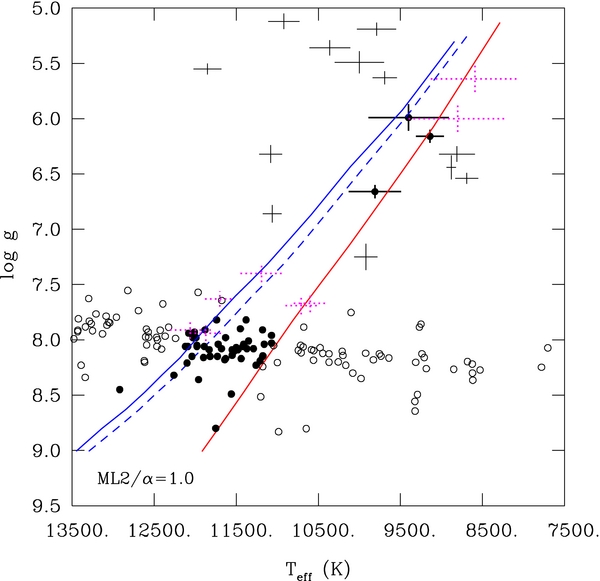
Figure 2. Comparison of the empirical with the theoretical instability domain in the log g–Teff diagram for the pulsating DA white dwarfs. The positions of the pulsators in the bright DA sample discussed by Fontaine & Brassard (2008) are indicated by the filled circles, while those of the nonvariable stars are given by the open circles. For their part, the positions of the three newly discovered low-mass pulsators are shown by filled circles with associated error bars, while the low-mass white dwarfs recently observed and found not to vary are indicated by solid crosses (from Steinfadt et al. 2012; Hermes et al. 2012; J. J. Hermes et al. 2012, in preparation). The dotted crosses show candidates for potential variability, with positions taken from the ELM survey summarized in Brown et al. (2012). Our theoretical instability strip refers specifically to models computed with the so-called ML2/α = 1.0 version of the mixing-length theory. With this convective efficiency, our predicted ℓ = 1 blue edge is given by the blue solid curve in TDC, while it is given by the blue dashed curve in FC. Our predicted ℓ = 1 red edge is shown by the red solid curve on the right.
Download figure:
Standard image High-resolution imageA comparison of our predicted instability strip with the empirical data is particularly encouraging, as can be seen in Figure 2. On the first account, we plotted the positions of 48 ZZ Ceti stars (the filled circles) as well as those of 84 DA white dwarfs that were observed not to vary (the open circles). These objects belong to the bright spectroscopic sample of DA white dwarfs that have been analyzed over the years at the Université de Montréal with the rigorous and homogeneous method developed by Bergeron et al. (1995), and followed subsequently by Fontaine et al. (2001, 2003), Bergeron et al. (2004), and Gianninas et al. (2005, 2006, 2007). This sample provides the best available view of the standard empirical ZZ Ceti instability strip.
On the second account, we also plotted the positions of the three ELM pulsators (the filled circles with error crosses) reported by Hermes et al. (2012) and J. J. Hermes et al. (2012, in preparation), as well as those of 12 low-mass DA white dwarfs observed not to vary (the solid crosses). In the latter case, nine of these objects come from the McDonald Observatory survey as reported in Hermes et al. (2012) and J. J. Hermes et al. (2012, in preparation), four come from Steinfadt et al. (2012), with one object in common. Those are stars with detection limits less than 10 mmag in white light. In all cases, the atmospheric parameters have been inferred in a homogeneous way within the ELM project (see Brown et al. 2012 and references therein), using model atmospheres provided by D. Koester, equivalent in principle to those of P. Bergeron. In addition, the Koester models are based on the same parameterization of the mixing-length theory as that calibrated initially by Bergeron et al. (1995), the ML2/α = 0.6 version. This implies that the relative positions of the circles (solid and open) and of the crosses in Figure 2 should be secure, unless there are some systematic effects between the two sets of models or in the reduction and fitting procedure between the two groups of modelers. We are not aware of such effects, and we consider the actual locations of the stars plotted in Figure 2 at face value.
The comparison between our theoretical instability strip and the empirical data shown in Figure 2 is most noteworthy. Our results are perfectly consistent with the idea that the ZZ Ceti instability strip is pure, including its extension into the low-mass regime (see, e.g., Section 4 of Fontaine & Brassard 2008 for a further discussion of this issue). All of the pulsators considered in the figure, including the three newly found ELM stars, fall within the predicted strip or close to one of its edges, while all of the objects found not to vary fall outside the strip.
We also point out that our TDC blue edge is hotter than our FC blue edge by about 200 K on average. This is a significant difference, given that the width of the predicted instability strip ranges from about 1000 K at log g ∼ 8 down to about 650 K at log g ∼ 6.5. The TDC blue edge obtained in this paper provides a qualitatively superior fit to the observational data than the FC blue edge does, particularly in the domain of normal ZZ Ceti stars. Still, the differences between the predictions of TDC and those of FC are not dramatically different (see Van Grootel et al. 2012 for further details on this). Given that the FC approximation is unjustified in white dwarfs, this result may seem surprising. Saio (2012) has recently provided an explanation for this state of affairs.
In the list of 40 DA white dwarfs in the ELM sample (Table 1 of Brown et al. 2012), we have searched and identified eight objects that fall close to one or the other of the boundaries of our theoretical instability strip. These stars are identified by dotted crosses in Figure 2, and their atmospheric parameters are listed in Table 1. To our knowledge, they have yet to be monitored for variability, and we suggest that they are worthwhile candidates for future searches.
Table 1. Candidates for Variability
| Object | g | log g | Teff | Reference |
|---|---|---|---|---|
| (mag) | (cm s−2) | (K) | ||
| SDSS J0016−0043 | 19.70 | 7.40 ± 0.08 | 11190 ± 260 | Brown et al. (2012) |
| SDSS J0117+2513 | 19.30 | 7.69 ± 0.08 | 10710 ± 190 | Brown et al. (2012) |
| SDSS J0421+8302 | 19.79 | 7.94 ± 0.07 | 11870 ± 200 | Brown et al. (2012) |
| SDSS J0702+1110 | 16.06 | 6.00 ± 0.12 | 8800 ± 600 | Brown et al. (2012) |
| SDSS J0918+3753 | 18.61 | 7.91 ± 0.08 | 12060 ± 250 | Brown et al. (2012) |
| SDSS J1235+4750 | 19.29 | 7.67 ± 0.08 | 10600 ± 200 | Brown et al. (2012) |
| SDSS J1614+1912 | 16.19 | 5.64 ± 0.12 | 8590 ± 540 | Brown et al. (2012) |
| SDSS J2337+1533 | 19.68 | 7.63 ± 0.07 | 11700 ± 180 | Brown et al. (2012) |
Download table as: ASCIITypeset image
3.4. Discussion
The convective efficiency used in the spectroscopic work, namely, the ML2/α = 0.6 version (Bergeron et al. 1995), is not the same as that assumed in the present modeling, namely, the more efficient ML2/α = 1.0 version. This phenomenon has been interpreted as evidence in favor of the idea that the convective efficiency increases with depth in a white dwarf, consistent with the findings of the hydrodynamic simulations carried out by Ludwig et al. (1994). The choice of ML2/α = 0.6 comes from the detailed calibration presented in Bergeron et al. (1995) and refers specifically to the atmospheric layers. In contrast, the location of the blue edge in the log g–Teff plane is a direct measure of the depth of the H convection zone, which depends sensitively on the assumed convective efficiency in the stellar models used in the nonadiabatic pulsation calculations (e.g., Winget et al. 1982). Fontaine et al. (1984) were the first to propose that this sensitivity could be exploited to calibrate the mixing-length theory in white dwarfs entering the instability strip for the layers associated with the base of the convection zone. Our proposed model for the red edge is also sensitive to the depth of the convection zone, but, this time, for pulsators exiting the instability strip. In other words, the convective efficiency in a white dwarf can be calibrated in the atmospheric layers through considerations based on spectroscopic and photometric modeling (Bergeron et al. 1995), while it can also be probed at the base of the subphotospheric convection zone through pulsation modeling such as that carried out here.
In the present work, taking at face value the ML2/α = 0.6 atmospheric parameters of the stars reported in Figure 2, we find that the ML2/α = 1.0 version used in our nonadiabatic survey provides a very good representation of the empirical evidence. A slight increase of the assumed convective efficiency would be necessary to displace the instability strip to the left in order for the blue edge to match the data slightly better, but this would just be fine tuning. In that case, both edges would be displaced, but not by the same amount, as the blue side is more sensitive. Given that both the blue and red edges of our theoretical instability strip are sensitive to the assumed convective efficiency, we again find that the locations as well as the slopes of the boundaries of the empirical strip are rather well modeled with the ML2/α = 1.0 flavor.4 This "calibration" is the sensible choice for parameterizing convection in evolutionary and pulsation calculations for DA white dwarfs, since the convective efficiency in the atmospheric layers has a lot less impact on such computations than that defining the base of the H convection zone.
It should be pointed out that the ultimate choice of the proper convective efficiency to use in evolutionary and pulsation calculations of DA white dwarfs depends directly on the reliability of the atmospheric parameters of the stars defining the empirical sample in Figure 2 (or its equivalent). For many years, the ML2/α = 0.6 calibration of Bergeron et al. (1995) has remained the standard reference for model atmospheres. However, significant progress has been made on that front in recent years, thanks to the efforts of Tremblay & Bergeron (2009) who introduced improved Stark broadening profiles for H lines, including nonideal effects. This naturally led to a revision of the derived atmospheric parameters of the various available spectroscopic samples of DA stars. In order to keep the internal consistency between various atmospheric properties of DA white dwarfs as discussed by Bergeron et al. (1995), it was then necessary to recalibrate the atmospheric convective efficiency. This led to the ML2/α = 0.8 version, as introduced by Tremblay et al. (2010). An updated empirical view of the ZZ Ceti instability strip was next presented on that basis by Gianninas et al. (2011). In principle, therefore, we should have considered the revised empirical data set on ZZ Ceti stars and surrounding constant stars. However, we were recently warned by P. Bergeron (2012, private communication) that the ML2/α = 0.8 atmospheric calibration is under review and should not be used further until the verification phase is completed. In view of this, and for our immediate purposes, we therefore decided to use the "old" empirical data. We fully expect to be able to reproduce the eventual revised data as well as we did here.
A last word on the empirical data set used here is in order. The sample of 48 ZZ Ceti pulsators and of 84 DA stars that were not observed to vary, shown in Figure 2, has been assembled using very stringent criteria, as outlined in Section 3 of Fontaine & Brassard (2008). It provides the cleanest view of the empirical instability strip to date. For example, it clearly shows a slope of the blue edge—and the same is true of the red edge—such that lower gravity pulsators at that edge are found at lower effective temperatures in the spectroscopic HR diagram. It also suggests a red edge that has a larger slope than the blue edge, exactly as theoretically predicted. It has been fashionable in recent years to add to the empirical sample the numerous new ZZ Ceti pulsators that have been discovered within the Sloan Digital Sky Survey (SDSS; the number of known pulsators of the type has more than tripled, thanks to that survey). Unfortunately, the poorly constrained atmospheric parameters of the faint pulsating stars uncovered within the SDSS survey have totally blurred the empirical view of the ZZ Ceti strip to the point where there is no structure left. An example of this is provided in Figure 3 of Hermes et al. (2012), where the distribution of "normal" ZZ Ceti stars in the log g–Teff plane shows ill-defined boundaries. We suggest that, for modeling purposes at least, one should use the bright "clean" empirical sample until a better equivalent is obtained.
4. DETAILS OF REPRESENTATIVE MODELS
We found it quite instructive to examine the convection and pulsation properties of models along evolutionary sequences. As a representative case, we focus here on the He-core sequence with M = 0.2 M☉ and a thick H envelope with log q(H) = −2.0. In particular, we show in Figure 3 the spectrum of excited dipole g-modes as it develops with cooling along that sequence. These results have been obtained with the nonadiabatic code MAD in TDC. The general pattern is qualitatively similar to that obtained in more massive ZZ Ceti star models (see, e.g., Figure 7 of Van Grootel et al. 2012). It is characterized by a relatively important broadening of the band of unstable modes immediately below the blue edge, followed by a subsequent reduction in width as the effective temperature decreases. The predicted pulsational instabilities persist well into the regime of very low effective temperatures compared to the empirical evidence. This is the typical "failure" of detailed nonadiabatic calculations in the presence of convection as discussed above. It is possible that the situation might improve on this front by introducing additional physics into our calculations, such as turbulent pressure, for example. On the other hand, if we are correct about the question of energy leakage, then the red edge would be located in effective temperature close to the value indicated by the dotted vertical line. We also note that the lowest order excited mode first appears in the model with Teff = 8461 K and has a value of k = 4. We also point out that low-order p-modes are excited in our models, exactly as in the case of normal mass ZZ Ceti stars (e.g., Saio et al. 1983), but such modes have never been observed. Since the g-modes with the lowest possible values of k (1, 2, ...) are not excited in our low-mass DA models, there is a gap of stability between the excited p-modes and the band of excited g-modes.

Figure 3. Evolution of the spectrum of excited dipole g-modes along our 0.2 M☉ He-core DA white dwarf sequence with models characterized by a thick H layer with log q(H) = −2.0 and a convective efficiency given by the ML2/α = 1.0 flavor. Each dot gives the period of a mode, and its size represents a logarithmic measure of the modulus of the imaginary part of the complex eigenfrequency. The bigger the dot, the more unstable the mode. The lowest radial-order-excited g-mode in this diagram has k = 4, and it first appears in the model with an effective temperature just below 8500 K. The stability of these models has been studied with the MAD code in its TDC option. The vertical dotted line defines the true red edge of the sequence according to our semi-analytic criterion.
Download figure:
Standard image High-resolution imageThe series of Figures 4(a)–(c) reveals some interesting properties of the structure of the outer H convection zone that develops with cooling in the reference sequence of interest. The focus is on the part of the sequence that is relevant for pulsations. The tiny dots in Figure 4(a) show isocontours of the opacity in units of log κ. It can be seen that recombination of H leads to a huge opacity peak culminating above a value of log κ = 5.5 in the coolest models depicted in the figure. As a consequence of increasing opacity with cooling, the material becomes convective, and the boundaries (top and bottom) of the convection zone are indicated in the plot by the small filled circles. It is important to realize that the top of the H convection zone always resides very near the photosphere, which moves inward with cooling on the fractional mass depth scale used here as the ordinate. At the same time, the base of the convection zone, which resides in the unobservable optically thick layers, sinks into the star with cooling, at least in the illustrated range of effective temperature. Our TDC blue edge for that sequence, as well as our estimate of the red edge based on the energy leakage argument, is indicated by the dashed vertical lines. All of the action in terms of pulsations is confined between these boundaries.
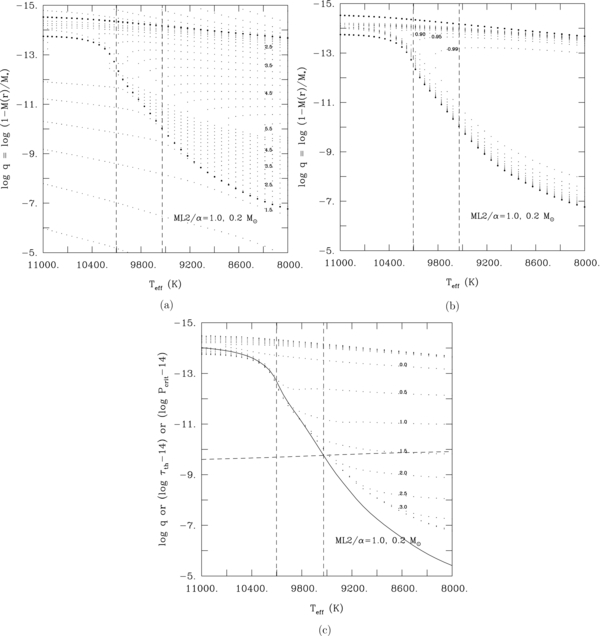
Figure 4. (a) Details of the structure of the outer part of the H envelope of our representative evolving 0.2 M☉ He-core DA white dwarf with log q(H) = −2.0. The ordinate gives the fractional mass depth in logarithmic units; a value of log q = 0.0 on this scale would correspond to the center of the model. The tiny dots define "isocontours" of the opacity in steps of Δlog κ = 0.25 dex. Some of these contours are labeled by the value of their log κ. The small filled circles indicate the boundaries of the superficial H convection zone. The top of that zone is always located near the photosphere. The vertical dashed lines define, from left to right, our predicted blue edge in TDC, and our predicted red edge, both with ML2/α = 1.0. (b) Similar to Figure 4(a), but the tiny dots here define isocontours of the ratio of the convective to total flux, with values Fc/F = 0.99, 0.95, 0.9, 0.8, 0.7, 0.6, 0.5, 0.4, 0.3, 0.2, 0.1, and 0.01. (c) Similar to Figure 4(a), but for the convective turnover timescale log τc expressed in seconds. In addition, the solid curve illustrates the behavior of the thermal timescale at the bottom of the convection zone log τth, also expressed in seconds. The dashed curve indicates the value of the critical period log Pcrit (in seconds) beyond which outgoing ℓ = 1 gravity waves are no longer reflected back in the atmospheric layers and are lost into space. The red edge occurs when these two curves cross each other. Note that both the log τth and log Pcrit vertical scales are offset by a factor of −14.
Download figure:
Standard image High-resolution imageFigure 4(b) shows the equivalent, but for the ratio of the convective to total flux, Fc/F. It can be seen that the profile of Fc/F at the blue edge rises progressively outward from the base of the convection zone, reaches a maximum value of ∼0.97 about halfway into the zone, and subsequently decreases toward the top of the zone. This convection flux profile is shallower than that found in a more massive ZZ Ceti star model (see Figure 3(a) of Van Grootel et al. 2012 showing that Fc/F ∼ 0.99 at the base of the convection zone for a 0.6 M☉ model). This can be explained by the fact that our current 0.2 M☉ model is a lot less degenerate than the former. This implies less efficient electron thermal conductivity in the core, a shallower temperature gradient between the core and the surface, and a more extended but less efficient convection zone in the envelope for the less massive, less degenerate model. However, the driving mechanism is fundamentally the same in the 0.2 and 0.6 M☉ models: the blue edge appears when the convection zone is sufficiently deep and developed to efficiently carry the energy of the pulsation mode.
Figure 4(c), of the same general format as the two previous plots, brings together the various timescales of interest. In particular, the tiny dots indicate various values of the local convective turnover timescale. The figure demonstrates, among other things, that the convective turnover timescale at the base of the convection zone of the model at the blue edge is about 10 s, much smaller indeed than the periods excited in that model (see Figure 3). For its part, the solid curve represents the thermal timescale τth at the base of the convection zone. It grows rapidly with decreasing effective temperature and ultimately overtakes the critical period Pcrit for ℓ = 1 g-modes, shown here by the dashed curve. According to the energy leakage argument, the red edge is defined by the crossover of these two curves.
Finally, in Figure 5, we show representative period spectra of excited dipole g-modes for models specifically computed for each of the three known pulsating ELM white dwarfs. These models are simply meant to verify if we can qualitatively account for the observed periods; they are not seismic fits. Hence, for each ELM pulsator, we calculated a static ML2/α = 1.0 model specified by the values of log g and Teff tabulated in Brown et al. (2012), and an assumed thick H layer with log q(H) = −2.0 sitting on top of a pure He core. For SDSS J1518+0658, we also computed another model, similar on all accounts, except for the fact that it has a thin H layer with log q(H) = −4.0. This is to illustrate specifically our point made above that models with the same values of log g and Teff are part of the same instability strip, but that their period spectra still bear the signature of their internal structure (which may be different).

Figure 5. Comparison of the excited dipole g-mode period spectrum in a representative model of an ELM pulsator (the series of vertical line segments) with the observed periods in that star (short heavy line segments in red). From top to bottom, the various rows refer to (1) a He-core model of J1840+6423 with log g = 6.16, Teff = 9310 K, log q(H) = −2.0, and ML2/α = 1.0 convection, (2) a He-core model of J1518+0658 with log g = 6.66, Teff = 9810 K, log q(H) = −4.0, and ML2/α = 1.0 convection, (3) a similar model but this time with a thick H layer log q(H) = −2.0, and (4) an He-core model of J1112+1117 with log g = 5.99, Teff = 9400 K, log q(H) = −2.0, and ML2/α = 1.0 convection.
Download figure:
Standard image High-resolution image
We pulsated these individual models in TDC, and the results are shown in Figure 5. For SDSS J1840+6423 (first row in the figure), the band of excited periods spans a range from ∼860 s (k = 7) to ∼7833 s (k = 81).5 In the case of the SDSS J1518+0658 models, the band of excited periods spans a range from ∼406 s (k = 2) to ∼4383 s (k = 46) for the thin envelope structure (second row), and a range from ∼530 s (k = 5) to ∼4657 s (k = 62) for the thick envelope structure (third row). We point out that the average period spacing between adjacent modes is significantly less for the thick than for the thin H envelope model, in line with the detailed adiabatic investigation of Brassard et al. (1992) on standard ZZ Ceti stars. This clearly illustrates that the predicted period spectra do bear the signature of the structure of the models, in this case a different H envelope mass. For the SDSS J1112+1117 model (lower row), the band of excited periods spans a range from ∼1235 s (k = 10) to ∼5661 s (k = 53).
A comparison with the available period data in Figure 5 shows that our approach can account qualitatively for these relatively long periods. The observed periods are still very preliminary and come from discovery light curves where it is not easy to correctly identify the right aliases. This comparison with theoretical periods has to be seen as being only qualitative here. Furthermore, in all three cases, the observational data are quite sparse compared to the predicted period distributions, very much like the situation encountered from the ground for long period g-mode oscillations in cooler hot B subdwarf stars (see, e.g., Randall et al. 2006a, 2006b). This is not a cause for concern at this time, given that the pulsating ELM DA white dwarfs have not yet been observed over long campaigns. It is likely that higher sensitivity observations, beyond the discovery light curves, will reveal many more modes.
5. CONCLUSION
The detection of g-mode pulsational instabilities in three extremely low-mass, He-core DA white dwarfs by Hermes et al. (2012) and J. J. Hermes et al. (2012, in preparation) is a very significant discovery. As foreseen initially by Steinfadt et al. (2010), such a discovery opens the way for the eventual application of asteroseismology to a whole domain of the spectroscopic HR diagram that has remained out of reach so far. In particular, it is hoped that asteroseismology will one day reveal the detailed internal structure and, perhaps, even constrain the age of an ELM white dwarf pulsator.
We have presented in this paper the results of a detailed stability study aimed at (1) explaining the very existence of the pulsating ELM white dwarfs, (2) accounting for their observed periods (at the qualitative level), and (3) assigning them to a known (or new) instability strip in the spectroscopic HR diagram. For those purposes, we built on the experience of Van Grootel et al. (2012), and first computed several evolutionary sequences of low-mass DA white dwarfs which incorporate the feedback effect of convection on the atmospheric structure. This effect—usually neglected in evolutionary calculations of white dwarf stars—is important for pulsation studies, particularly for accurately mapping the boundaries of the instability strip. In addition, we took advantage of the nonradial nonadiabatic code MAD, which incorporates a detailed treatment of TDC (Dupret 2002; Grigahcène et al. 2005). This code has been adapted successfully to pulsate DB white dwarf models (Dupret et al. 2008; Quirion et al. 2008), and, more recently, to pulsate DA models as well (Van Grootel et al. 2012). It provides the best available physical description of g-mode pulsations in convective white dwarf models, particularly at or near the blue edge of the instability strip. However, in its current implementation, MAD fails (as all other nonadiabatic codes used so far) to provide a realistic red edge. In this connection, we have tested the idea of Hansen et al. (1985) that energy leakage might be the physical mechanism responsible for the red edge of the ZZ Ceti instability strip.
The results of our mapping exercise in the HR diagram are illustrated in Figure 2. The comparison of the location, extent, and shape of our predicted instability strip with the empirical data is most encouraging. The expected blue edge (obtained from detailed nonadiabatic calculations in the TDC mode), as well as the expected red edge (obtained from the energy leakage argument), indeed accounts remarkably well for the data, including the positions of the three ELM pulsators. We did not expect this result at the outset, especially for the red edge. This suggests that we may have put our finger on the correct mechanism that is physically responsible for the observed red edge. That mechanism has remained elusive ever since the discovery of the very first pulsating DA white dwarf in 1968.
The good agreement between expectations and observations displayed in Figure 2 also provides a very credible calibration of the mixing-length theory in DA white dwarfs, since both edges are sensitive to the assumed convective efficiency. As explained above, our pulsation considerations can be used to measure the convective efficiency in layers near the base of the convection zone in these white dwarf models. On the other hand, spectroscopic and photometric constraints impose a different calibration in the atmospheric layers (Bergeron et al. 1995). The asteroseismic calibration does depend on the location of the stars in the HR diagram and, therefore, is related to the atmospheric calibration. In the present situation, the available empirical data are based on the ML2/α = 0.6 version. With that constraint, our asteroseismic approach leads rather to ML2/α = 1.0, which could be perceived negatively as an incoherence, but should be seen instead as the demonstration that the convective efficiency in a white dwarf increases with depth as predicted by hydrodynamic simulations (Ludwig et al. 1994). We note that for evolutionary calculations, the asteroseismic calibration of the mixing-length convective efficiency is the one to use. We note also that, should the empirical atmospheric parameter data be revised, this will imply a concomitant revision of the asteroseismic calibration.
We have thus established in this paper that the newly discovered ELM DA pulsators are genuine ZZ Ceti stars: they belong to the ZZ Ceti instability strip, and the driving mechanism responsible for exciting some of their g-modes is the same as the one at work in more massive pulsating DA white dwarfs. The relatively long periods observed in these stars are readily explained by the low values of the surface gravity. In this respect, Figure 5 provides a preview of what the spectrum of excited dipole modes might look like for each of the three ELM pulsators. Clearly, the predicted periods are consistent with the (sparse) observations and account for them at the qualitative level. We also recall that there exists a correlation between the excited period and the effective temperature or surface gravity for ZZ Ceti pulsators, as best seen in Figure 24 of Fontaine & Brassard (2008). Without pushing too much in the sense of overinterpretation, there could already be hints in the available data that the correlation is again at work. For instance, we find that the average observed period is the smallest in SDSS J1112+1117 and the largest in SDSS J1840+6423, consistent with their position near the blue edge and near the red edge, respectively. Likewise, SDSS J1518+0658 is rather nearer the red edge than the blue edge, but its surface gravity, being higher than in the two previous stars, compensates for this partly in the sense of producing shorter excited periods, also as expected.
Finally, we have provided in Table 1 a list of candidates for variability, which are ELM white dwarfs that have atmospheric parameters falling close to the boundaries of our theoretical instability strip.
The referee has kindly pointed out to us the existence of an independent paper dedicated to the seismic properties of low-mass, He-core white dwarfs (Corsico et al. 2012). We were not aware of that very recent work. That paper presents a pulsational study of ELM white dwarfs based on detailed evolutionary models, with a particular emphasis on adiabatic properties. To a large extent, our paper is complementary to theirs, as we focused exclusively on the nonadiabatic aspects of the problem. It should be pointed out that Corsico et al. (2012) also carried out nonadiabatic calculations which, we find, are in qualitative agreement with our findings. There are, however, significant differences in that (1) they used the FC approximation in their nonadiabatic computations, (2) they assumed a different convective efficiency (ML1/α = 1.6) in their models than we did in ours (ML2/α = 1.0), (3) they ignored the important effect of the feedback of convection on the atmospheric structure, and (4) they did not provide an estimate for the red edge. As a result, they could not map the ZZ Ceti instability strip and account for the empirical data (including the three newly found ELM pulsators) as we did in this paper.
This work was supported in part by the NSERC of Canada. G.F. also acknowledges the contribution of the Canada Research Chair Program.
Footnotes
- 4
- 5
Formally speaking, the spectroscopic values of log g and Teff for SDSS J1840+6423 put it just outside the theoretical strip, as can be seen in Figure 2 on the side of the red edge. Given the uncertainties on these parameters, however, and to be coherent in our approach, we computed a model for that star using the spectroscopic surface gravity, but the effective temperature has been increased by half of its quoted uncertainty (i.e., 65 K) to relocate it in the formal strip.