


ABSTRACT
The dependence of solar energetic proton (SEP) event peak intensities Ip on properties of associated coronal mass ejections (CMEs) has been extensively examined, but the dependence of SEP event timescales is not well known. We define three timescales of 20 MeV SEP events and ask how they are related to speeds vCME or widths W of their associated CMEs observed by LASCO/SOHO. The timescales of the EPACT/Wind 20 MeV events are TO, the onset time from CME launch to SEP onset; TR, the rise time from onset to half the peak intensity (0.5Ip); and TD, the duration of the SEP intensity above 0.5Ip. This is a statistical study based on 217 SEP–CME events observed during 1996–2008. The large number of SEP events allows us to examine the SEP–CME relationship in five solar-source longitude ranges. In general, we statistically find that TO declines slightly with vCME, and TR and TD increase with both vCME and W. TO is inversely correlated with log Ip, as expected from a particle background effect. We discuss the implications of this result and find that a background-independent parameter TO+TR also increases with vCME and W. The correlations generally fall below the 98% significance level, but there is a significant correlation between vCME and W which renders interpretation of the timescale results uncertain. We suggest that faster (and wider) CMEs drive shocks and accelerate SEPs over longer times to produce the longer TR and TD SEP timescales.
Export citation and abstract BibTeX RIS
1. INTRODUCTION
It is widely accepted (Reames 1999, 2013) that there are two classes of solar energetic (E ⩾ 10 MeV) particle (SEP) events. The smaller events, called impulsive, are characterized by enhanced abundances of He3 and Fe/O in the few MeV nuc−1 range and are associated with impulsive flares and type III radio bursts. The largest SEP events, called gradual, are produced in coronal and interplanetary shocks driven by coronal mass ejections (CMEs). It is therefore of interest to determine how the gradual SEP event properties are related to the characteristics of the associated CMEs. The SEP event properties of prime interest are those of the peak intensity Ip and energy spectra. The dependence of the occurrence and peak intensities of SEP events on CME properties have been extensively explored using databases of the LASCO/SOHO CMEs and the GOES E > 10 MeV protons. Recent studies (Reinard & Andrews 2006; Kumar et al. 2009; Hwang et al. 2010; Park et al. 2012) have used the published list of major GOES SEP events with peak proton intensities Ip exceeding 10 pfu (1 pfu = 1 p cm−2 sr−1 s−1), but others (Wang 2006; Gopalswamy et al. 2008) have included weaker (<10 pfu) SEP events in their analyses.
Cane et al. (2010) carried out an extensive comparison of SEP events with CMEs over solar cycle 23. Listing 280 SEP events well observed in the 20–30 MeV range with IMP-8 and SOHO particle detectors, they made flare and CME associations where possible. They looked for systematic variations of a subset of 201 SEP events classified into five groups based on their e/p and Fe/O abundances and observed 1 AU shock associations. There were good correlations between 25 MeV peak proton intensities of all groups, measured within the first 12 hr of the events, and both the listed CME speeds and the CME widths, which they estimated when the CME leading edges were in the LASCO C2 field of view. Their estimated widths replaced where possible the listed large angle halo widths, usually of 360°. This and other previous work has indicated increasing SEP event occurrence probabilities and Ip with faster and wider CMEs and generally with more western CME source longitudes.
The temporal characteristics of SEP events are also of interest for both space weather forecasting and understanding the SEP injection profiles and propagation characteristics. For example, faster CMEs could begin to accelerate and inject SEPs earlier, producing earlier onsets and perhaps longer rise times. The variations of SEP rise times, taken as time from X-ray flare maximum to SEP maximum at 1 AU, as a function of solar source longitude have been surveyed (Cane et al. 1988; Balch 1999), but within those longitudinal variations the dependence on CME characteristics was not explored until our previous work (Kahler 2005, hereafter K05).
K05 used time profiles of 144 20 MeV proton events observed with the EPACT experiment on the Wind spacecraft, which provided a much larger dynamic range of peak SEP intensities than those of the E > 10 MeV GOES SEP events. Those 20 MeV SEP events had peak intensities at least a factor of two above background and were observed during the period 1998–2002. For each SEP event the time of projected associated CME onset at the Sun was determined from height–time profiles given in the LASCO CDAW catalog. The three characteristic times of the SEP events were TO, the time from inferred CME launch at 1 R☉ to the time of the 20 MeV SEP onset at Wind; TR, the time from SEP onset to the time the intensity reached half the peak value Ip (0.5Ip); and TD, the time during which the intensity was above 0.5Ip. If an SEP increase occurred with the associated shock passage, then TD was taken only up to the time of the shock.
The three SEP event timescales were compared with the CME speeds vCME, accelerations, widths W, and the solar wind O+7/O+6 ratios at 1 AU. The expected longitude dependence of the timescales (e.g., Cane et al. 1988) was addressed by separating the events into five longitude ranges and looking for significant correlations between SEP and CME parameters in each longitude range. In addition, the median values of the timescales were given for each longitude range, providing a rough guide for space weather forecasting of SEP events.
Several results appeared clear from K05. There was no correlation (at a ⩾98% significance probability) of any SEP timescale with the solar wind O+7/O+6 ratios (Kahler 2008), and, with a possible exception of TD for well-connected events, no correlation with CME accelerations. These results would be expected if ambient solar wind particles are not seed particles for the shocks and if CME accelerations are small perturbations of vCME. There was no correlation of TO with vCME, although the median TO was smaller for events in well-connected longitude ranges than for those near the limb, as perhaps expected from earlier studies. TR and TD were significantly correlated with vCME only in the W65°–W90° longitude range. There were large, but not significant, correlations of TD with W for western hemisphere events.
Pan et al. (2011) repeated the analysis of K05 but used the CME ice-cream cone model of Xue et al. (2005) to get more accurate values of vCME and W than the sky-projected values used by K05. They eliminated CMEs with source regions behind the limbs, with irregular structures, or with halos from central meridian sources, which reduced their sample size to 95 events. The model CME speeds resulted in changes in the projected CME onset times and some changes to the TO values, but they retained the TR and TD values of the K05 study. In agreement with K05 they found no correlation of TO with vCME in any longitude region but significant correlations of TR with vCME for the W60°–W90° region and of TD with vCME for both the W30°–W59° and W60°–W90° source regions. Their correlation coefficients (CCs) were substantially enhanced above the corresponding values of K05, an apparent effect of using more accurate values of vCME deduced from the cone model. For the correlations with W Pan et al. (2011) found significant correlations of TR and TD in the W30°–W59° and W60°–W90° source regions, where K05 found only high but not significant correlations. Once again, the cone model seemed to provide the more accurate CME parameters that resulted in better correlations.
This work is an extension of K05 to the full solar cycle from 1996 to 2008. We have added SEP events from 1996 to 1997 and from 2003 to 2008, bringing the new total to 217 SEP events, an increase of 73 events. The previously published 1998–2002 event list is amended with several flare/CME source longitude corrections and event additions and deletions. Besides a check on the results of the previous study, we use the improved statistics to provide comparative plots of median values of each SEP timescale versus vCME or W within each longitude range for an easier overview of the timescale dependences. Based on our earlier results, we do not include here the CME accelerations or the solar wind O+7/O+6 values. An important extension of K05 is to explore significant correlations between TO and log Ip and between vCME and W. The goal is to provide a more definitive determination of how 20 MeV SEP timescales depend on the basic properties of CMEs.
2. DATA ANALYSIS
2.1. SEP Event Selection
We follow the same procedure as discussed in detail in K05. We identify all the SEP events in the 18.9–21.9 MeV (hereafter 20 MeV) proton intensity–time profiles from the Wind/EPACT instrument and attempt to associate each event with a CME listed in the LASCO (Large Angle Spectroscopic Coronagraph) CDAW catalog. As in K05, we looked at associated Hα and X-ray flare reports and used both the direct and difference 195 Å EIT images superposed on the LASCO movies to locate the solar sources of the CME (eruption region on the disk, at the limb, or behind the limb). The flare location was taken as the source region of the CME, although CME size scales are greater than those of flares, which may lie nearer to the legs than to the centers of the associated CMEs (Harrison 2006). The most frequent flare site, however, is centered under the CME span (Yashiro & Gopalswamy 2009). Some SEP events could not be associated with CMEs, usually because of gaps in LASCO observational coverage.
The description of the SEP parameters TO, TR, and TD and of the CME launch times is given above and in Section 2 of K05. The 20 MeV onset and 0.5Ip times were determined to the nearest half-hour from data plots of that resolution. The parameters vCME and W are measured in the plane of the sky and reported in the CDAW catalog (http://cdaw.gsfc.nasa.gov/CME_list/), although some entries for W here are lower limits in the CDAW catalog. We used the linear height–time fits to deduce the 1 R☉ CME onsets, which can differ by tens of minutes from those based on the quadratic fits that allow CME accelerations.
The new list of 217 20-MeV SEP events is given in Table 1. There we list the date and time of the CME launch, vCME, W, the solar source region, TO, TR, the initial time of 0.5Ip, TD, and Ip. Note that TO+TR equals the time from CME launch to 0.5Ip. Table 1 of K05 has been expanded to include events from the years 1996–1997 and 2003–2008.
Table 1. Properties of CMEs and Associated SEP Events
| Date | Launch | vCME | W | Solar | TO | TR | 0.5Ipb | TD | 20 MeV |
|---|---|---|---|---|---|---|---|---|---|
| CME | (UT) | (km s−1) | (deg) | Locationa | (hr) | (hr) | (UT) | (hr) | Ipc |
| 1996 | |||||||||
| Nov 28 | 16:10 | 984 | 101 | bNWL | 3.7 | 1.0 | 21:00 | 22.0 | 0.007 |
| Dec 24 | 12:10 | 325 | 69 | bWL | 2.3 | 2.0 | 16:30 | 6.0 | 0.006 |
| 1997 | |||||||||
| Apr 1 | 13:20 | 312 | 79 | S25E16 | 6.7 | 2.0 | 22:00 | 41.0 | 0.002 |
| Apr 7 | 14:10 | 878 | 360 | S30E18 | 1.9 | 1.5 | 17:30 | 25.5 | 0.009 |
| May 12 | 4:15 | 464 | 360 | N21W08 | 1.7 | 1.5 | 7:30 | 26.5 | 0.02 |
| May 21 | 20:00 | 296 | 165 | N05W12 | 1.0 | 1.0 | 22:00 | 14.0 | 0.007 |
| Jul 25 | 19:50 | 611 | 84 | N16W54 | 2.7 | 0.5 | 23:00 | 13.0 | 0.01 |
| Sep 23 | 21:45 | 712 | 155 | S29E26 | 6.2 | 1.5 | 5:30 | 17.5 | 0.008 |
| Oct 7 | 12:30 | 1271 | 167 | bSWL | 1.5 | 1.5 | 15:30 | 13.5 | 0.009 |
| Nov 3 | 9:30 | 352 | 122 | S20W13 | 2.5 | 1.5 | 13:30 | NA | 0.006 |
| Nov 4 | 5:20 | 785 | 360 | S14W33 | 0.7 | 2.0 | 8:00 | 23.0 | 0.6 |
| Nov 6 | 11:35 | 1556 | 360 | S18W63 | 0.4 | 5.0 | 17:00 | 20.5 | 11 |
| Nov 13 | 20:20 | 546 | 288 | bSWL | 0.8 | 1.5 | 23:00 | 19.0 | 0.045 |
| 1998 | |||||||||
| Jan 26 | 22:05 | 399 | 66 | S17W55 | 2.4 | 2.5 | 27 3:00 | 5.0 | 0.008 |
| Apr 20 | 9:55 | 1863 | 165 | S43W90 | 1.6 | 12.5 | 24:00 | 36.0 | 30 |
| Apr 29 | 16:30 | 1374 | 360 | S18E20 | 4.5 | 14.0 | 30 11:00 | 41.5 | 0.05 |
| May 2 | 13:20 | 938 | 360 | S15W15 | 1.2 | 2.0 | 16:30 | 8.5 | 2 |
| May 6 | 8:00 | 1099 | 190 | S11W65 | 0.5 | 1.0 | 9:30 | 1.0 | 4 |
| May 9 | 3:25 | 2331 | 178 | S11W90 | 1.1 | 5.0 | 9:30 | 18.5 | 0.3 |
| May 27 | 13:05 | 878 | 268 | N18W58 | 1.9 | 1.0 | 16:00 | 11.0 | 0.002 |
| May 30 | 22:10 | 594 | 63 | bSWL | 3.8 | 6.0 | 31 8:00 | 8.5 | 0.003 |
| Jun 4 | 1:45 | 1802 | 360 | bNWL | 8.7 | 8.5 | 19:00 | 17.0 | 0.01 |
| Jun 16 | 18:00 | 1484 | 281 | S17W90 | 2.5 | 8.5 | 17 5:00 | 40.0 | 0.03 |
| Nov 5 | 20:10 | 1118 | 360 | N22W18 | 1.8 | 11.0 | 6 9:00 | 6.0 | 0.03 |
| Nov 24 | 2:10 | 1798 | 360 | S30W90 | 0.8 | 4.0 | 7:00 | 17.0 | 0.02 |
| 1999 | |||||||||
| Apr 24 | 13:02 | 1495 | 360 | bWL | 2.0 | 3.0 | 18:00 | 12.0 | 0.3 |
| May 3 | 5:50 | 1584 | 360 | N15E32 | 12.7 | 11.5 | 4 6:00 | 33.0 | 0.02 |
| May 9 | 17:15 | 615 | 172 | N26W90 | 1.3 | 1.0 | 19:30 | 4.5 | 0.04 |
| May 27 | 10:40 | 1691 | 360 | bWL | 0.7 | 1.5 | 12:30 | 6.5 | 0.15 |
| Jun 1 | 18:33 | 1772 | 360 | bNWL | 2.0 | 8.0 | 2 4:30 | 30.5 | 0.8 |
| Jun 4 | 6:45 | 2230 | 150 | N17W69 | 1.7 | 1.5 | 10:00 | 18.0 | 0.8 |
| Jun 11 | 0:20 | 719 | 101 | bSWL | 0.7 | 1.0 | 2:00 | 2.5 | 0.07 |
| Jun 27 | 8:15 | 903 | 86 | N23W25 | 3.3 | 2.0 | 13:30 | 9.0 | 0.004 |
| Jun 29e,f | 5:10 | 589 | 164 | S15E08 | 6.8 | 27.0 | 30 15:00 | 37.0 | 0.002 |
| Jul 25 | 13:12 | 1389 | 360 | N38W81 | 8.3 | 4.5 | 26 2:00 | 29.0 | 0.0015 |
| Aug 28 | 17:40 | 462 | 245 | S26W14 | 3.3 | 1.0 | 22:00 | 12.5 | 0.001 |
| Sep 14 | 7:15 | 761 | 122 | NWL | 0.0 | 1.0 | 7:00 | 17.0 | 0.0025 |
| Oct 14 | 8:43 | 1250 | 360 | N11E32 | 10.3 | 9.0 | 15 5:00 | 46.0 | 0.0015 |
| Dec 28 | 0:25 | 672 | 82 | N20W56 | 2.6 | 2.0 | 5:00 | 12.0 | 0.004 |
| 2000 | |||||||||
| Jan 18 | 17:10 | 739 | 360 | S19E11 | 2.8 | 2.0 | 22:00 | 42.0 | 0.02 |
| Feb 12 | 4:05 | 1107 | 360 | N26W23 | 2.4 | 1.5 | 8:00 | 6.0 | 0.04 |
| Feb 17 | 20:05 | 728 | 360 | S29E07 | 1.9 | 2.0 | 18 0:00 | NA | 0.02 |
| Feb 18 | 9:05 | 890 | 118 | bNWL | 0.9 | 0.5 | 10:30 | 2.5 | 0.4 |
| Mar 2 | 8:05 | 776 | 62 | S14W52 | 1.9 | 2.0 | 12:00 | 8.0 | 0.01 |
| Mar 3 | 2:05 | 841 | 98 | S15W60 | 1.4 | 0.5 | 4:00 | 3.0 | 0.01 |
| Apr 4 | 14:53 | 1188 | 360 | N16W66 | 1.6 | 5.5 | 22:00 | 15.5 | 0.4 |
| Apr 23 | 12:08 | 1187 | 360 | bNWL | 3.4 | 4.0 | 19:30 | 19.5 | 0.015 |
| Apr 27 | 14:00 | 1110 | 138 | N32W90 | 2.5 | 0.5 | 17:00 | 10.0 | 0.003 |
| May 1 | 10:13 | 1360 | 54 | N20W54 | 0.8 | 0.5 | 11:30 | 2.5 | 0.002 |
| May 4 | 10:53 | 1404 | 170 | S17W90 | 1.1 | 4.0 | 16:00 | 22.0 | 0.003 |
| May 5 | 15:18 | 1594 | 360 | SW90 | 4.7 | 10.0 | 6 6:00 | 32.0 | 0.005 |
| May 10 | 19:10 | 641 | 205 | N14E20 | 9.3 | 3.0 | 11 7:30 | 24.5 | 0.0015 |
| May 15 | 15:45 | 1212 | 165 | S24W67 | 3.7 | 2.5 | 21:30 | 8.5 | 0.015 |
| Jun 2 | 20:30 | 731 | 112 | N16E60 | 9.0 | 11.0 | 4 16:30 | 30.5 | 0.0008 |
| Jun 6 | 15:20 | 1119 | 360 | N20E14 | 4.2 | 21.5 | 7 17:00 | 16.0 | 0.4 |
| Jun 10 | 16:45 | 1108 | 360 | N22W38 | 0.7 | 0.5 | 18:00 | 7.0 | 1.3 |
| Jun 15 | 19:25 | 1081 | 116 | N20W65 | 1.6 | 1.0 | 22:00 | 15.5 | 0.0013 |
| Jun 17 | 2:40 | 857 | 133 | N22W72 | 2.8 | 0.5 | 6:00 | 7.5 | 0.006 |
| Jun 18 | 1:40 | 629 | 132 | N23W85 | 0.8 | 1.0 | 3:30 | 6.5 | 0.04 |
| Jun 23 | 13:50 | 847 | 198 | N26W72 | 1.2 | 1.5 | 16:30 | 3.5 | 0.015 |
| Jun 25 | 7:42 | 1617 | 165 | N16W55 | 3.8 | 2.5 | 14:00 | 17.5 | 0.03 |
| Jun 28 | 18:38 | 1198 | 134 | N20W90 | 1.9 | 1.0 | 21:30 | 8.5 | 0.002 |
| Jul 10 | 21:20 | 1352 | 289 | N18E49 | 1.2 | 4.5 | 11 3:00 | 10.5 | 0.007 |
| Jul 11 | 12:32 | 1078 | 360 | N18E27 | 2.5 | 1.0 | 16:00 | 32.0 | 0.005 |
| Jul 14 | 10:25 | 1674 | 360 | N22W07 | 1.1 | 1.5 | 13:00 | 26.0 | 120 |
| Jul 22 | 11:20 | 1230 | 229 | N14W56 | 1.2 | 1.0 | 13:30 | 9.5 | 0.3 |
| Aug 12 | 9:38 | 662 | 168 | bWL | 0.9 | 1.5 | 12:00 | 2.0 | 0.03 |
| Aug 12 | 14:03 | 876 | 161 | N13W46 | 2.0 | 1.0 | 17:00 | 12.0 | 0.005 |
| Aug 13 | 6:00 | 883 | 154 | bWL | 11.0 | 6.5 | 23:30 | 20.5 | 0.007 |
| Sep 7 | 20:15 | 422 | 169 | N06W47 | 2.3 | 4.5 | 8 3:00 | 4.0 | 0.005 |
| Sep 9 | 7:40 | 554 | 180 | N07W67 | 3.3 | 1.0 | 12:00 | 9.0 | 0.008 |
| Sep 12 | 11:45 | 1550 | 360 | S17W09 | 1.7 | 5.5 | 19:00 | 26.0 | 2 |
| Sep 19 | 8:10 | 766 | 76 | N14W46 | 4.8 | 2.0 | 15:00 | 18.0 | 0.013 |
| Oct 9 | 23:00 | 798 | 360 | N01W14 | 8.0 | 7.0 | 14:00 | 43.0 | 0.005 |
| Oct 16 | 6:50 | 1336 | 360 | bWL | 0.7 | 3.5 | 11:00 | 14.5 | 0.4 |
| Oct 25f | 8:55 | 770 | 360 | N10W66 | 3.6 | 5.0 | 17:30 | 16.5 | 0.25 |
| Nov 8 | 22:48 | 1738 | 170 | N10W77 | 0.7 | 3.5 | 9 3:00 | 15.0 | 150 |
| Nov 24g | 5:08 | 1289 | 360 | N20W05 | 1.3 | 1.5 | 8:00 | NA | 0.2 |
| Nov 24 | 15:10 | 1245 | 360 | N22W07 | 0.8 | 1.0 | 17:00 | 8.0 | 1.5 |
| Nov 25 | 1:07 | 2519 | 360 | N07E50 | 10.9 | 25.5 | 26 13:30 | 15.0 | 15 |
| Dec 28 | 11:30 | 930 | 360 | bNWL | 5.0 | 3.0 | 19:30 | 38.5 | 0.015 |
| 2001 | |||||||||
| Jan 5 | 16:20 | 828 | 360 | bWL | 4.2 | 2.5 | 23:00 | 14.0 | 0.02 |
| Jan 20 | 21:08 | 1507 | 360 | S07E46 | 6.3 | 22.0 | 22 1:30 | 35.5 | 0.03 |
| Jan 28 | 15:45 | 916 | 250 | S04W59 | 2.7 | 1.5 | 20:00 | 16.0 | 0.8 |
| Feb 11 | 1:10 | 1183 | 360 | N24W57 | 2.3 | 1.5 | 5:00 | 15.0 | 0.009 |
| Feb 26 | 4:50 | 851 | 152 | bWL | 2.6 | 2.5 | 10:00 | 14.0 | 0.008 |
| Mar 10 | 3:30 | 819 | 81 | N27W42 | 7.0 | 3.5 | 14:00 | 9.0 | 0.002 |
| Mar 25 | 16:20 | 677 | 360 | N16E25 | 4.7 | 22.5 | 19:30 | 20.5 | 0.007 |
| Mar 29 | 9:52 | 942 | 360 | N14W12 | 2.1 | 4.5 | 16:30 | 29.5 | 0.5 |
| Apr 2 | 11:00 | 992 | 80 | N17W65 | 1.5 | 1.5 | 14:00 | NA | 0.07 |
| Apr 2 | 21:43 | 2505 | 244 | N19W72 | 0.8 | 9.0 | 3 7:30 | 17.5 | 15 |
| Apr 9 | 15:32 | 1192 | 360 | S21W04 | 2.5 | 1.0 | 19:00 | NA | 0.1 |
| Apr 10 | 5:22 | 2411 | 360 | S23W09 | 3.1 | 4.5 | 13:00 | 23.0 | 2 |
| Apr 12 | 10:10 | 1184 | 360 | S19W43 | 3.8 | 2.0 | 16:00 | 12.5 | 0.9 |
| Apr 15 | 13:30 | 1199 | 167 | S20W85 | 0.5 | 2.5 | 16:30 | 11.5 | 20 |
| Apr 18 | 2:10 | 2465 | 360 | bSWL | 0.8 | 4.0 | 7:00 | 14.0 | 5 |
| Apr 26 | 11:50 | 1006 | 360 | N17W31 | 4.7 | 19.5 | 27 12:00 | 14.0 | 0.02 |
| May 7f | 11:55 | 1223 | 205 | bNWL | 0.6 | 3.5 | 16:00 | 21.5 | 0.3 |
| May 20 | 5:40 | 546 | 179 | bWL | 1.3 | 3.0 | 10:00 | 10.0 | 0.15 |
| May 29 | 23:50 | 2087 | 216 | bEL | 18.2 | 46.5 | 1 16:30 | 42.0 | 0.002 |
| Jun 4 | 15:30 | 464 | 89 | N24W59 | 2.0 | 0.5 | 18:00 | 10.0 | 0.03 |
| Jun 15 | 10:10 | 1090 | 119 | S26E41 | 0.3 | NA | NA | NA | 0.002 |
| Jun 15 | 15:24 | 1701 | 360 | bSWL | 1.1 | 1.0 | 17:30 | 5.5 | 0.8 |
| Jul 11 | 23:55 | 736 | 148 | S20W65 | 3.1 | 8.0 | 12 11:00 | 9.0 | 0.001 |
| Jul 19 | 10:00 | 1668 | 166 | S08W62 | 5.0 | 1.0 | 16:00 | 21.0 | 0.0008 |
| Aug 9f | 10:20 | 479 | 175 | N15W18 | 7.2 | 6.5 | 10 0:00 | NA | 0.03 |
| Aug 9f | 21:05 | 909 | 100 | S10E21 | 9.4 | 2.5 | 10 9:00 | 6.0 | 0.2 |
| Aug 14 | 10:40 | 618 | 360 | N20W20 | 5.8 | 3.5 | 14 20:00 | 15.0 | 0.01 |
| Aug 15f | 23:35 | 1575 | 360 | bSWL | 1.4 | 1.5 | 16 2:30 | 22.5 | 5 |
| Sep 12 | 21:20 | 668 | 114 | S20W75 | 6.2 | 1.5 | 13 5:00 | 21.0 | 0.002 |
| Sep 15 | 10:40 | 478 | 130 | S21W49 | 0.8 | 2.5 | 14:00 | 5.5 | 0.2 |
| Sep 17 | 8:05 | 1009 | 166 | S14E04 | 9.9 | 3.0 | 21:00 | 21.0 | 0.003 |
| Sep 19 | 5:45 | 416 | 210 | bSWL | 4.3 | 1.5 | 11:30 | 23.5 | 0.004 |
| Sep 24 | 10:20 | 2402 | 360 | S16E23 | 1.2 | 9.5 | 21:00 | 21.0 | 30 |
| Oct 1f | 5:30 | 1405 | 360 | S20W84 | 4.5 | 5.5 | 15:30 | 11.5 | 8 |
| Oct 9 | 10:40 | 973 | 360 | S28E08 | 8.3 | 0.5 | 19:30 | 24.0 | 0.03 |
| Oct 19 | 0:25 | 558 | 254 | N16W18 | 2.6 | 2.0 | 5:00 | NA | 0.09 |
| Oct 19 | 16:20 | 901 | 360 | N15W29 | 1.7 | 0.5 | 18:30 | NA | 0.17 |
| Oct 22 | 14:50 | 1336 | 360 | S21E18 | 1.2 | 3.5 | 19:30 | 6.0 | 0.3 |
| Nov 4 | 16:10 | 1810 | 360 | N06W18 | 1.3 | 5.5 | 23:00 | 25.0 | 50 |
| Nov 17 | 4:50 | 1379 | 360 | S13E42 | 3.7 | 20.5 | 18 5:00 | 34.0 | 0.04 |
| Nov 22 | 20:15 | 1443 | 360 | S25W67 | 0.7 | NA | NA | NA | 0.5 |
| Nov 22f | 22:55 | 1437 | 360 | S15W34 | 2.6 | 5.5 | 23 7:00 | 24.5 | 50 |
| Dec 11 | 9:50 | 891 | 121 | bSWL | 5.7 | 1.5 | 17:00 | 21.0 | 0.007 |
| Dec 14 | 8:50 | 1506 | 360 | N06E90 | 25.7 | 16.5 | 16 3:00 | 42.0 | 0.007 |
| Dec 26 | 5:05 | 1446 | 212 | N08W54 | 0.4 | 2.5 | 8:00 | 12.5 | 10 |
| Dec 28 | 20:05 | 2216 | 360 | bSEL | 3.9 | 5.0 | 29 5:00 | 17.0 | 0.7 |
| 2002 | |||||||||
| Jan 8d | 17:47 | 1794 | 360 | bNEL | 32.2 | 20.0 | 10 22:00 | 20.0 | 1.7 |
| Jan 14f | 5:33 | 1492 | 360 | S28W83 | 3.5 | 20.0 | 15 5:00 | 49.0 | 0.3 |
| Jan 27 | 12:10 | 1136 | 360 | bWL | 1.8 | 0.5 | 14:30 | 5.0 | 0.2 |
| Feb 20 | 5:55 | 952 | 360 | N12W72 | 0.6 | 0.5 | 7:00 | 1.5 | 0.2 |
| Mar 15 | 22:24 | 957 | 360 | S08W03 | 3.6 | 6.0 | 16 8:00 | 23.0 | 0.015 |
| Mar 18 | 2:30 | 989 | 360 | S10W25 | 4.5 | 20.0 | 19 3:00 | 10.0 | 0.7 |
| Mar 22 | 10:53 | 1750 | 360 | bWL | 2.6 | 3.0 | 16:30 | 17.5 | 0.03 |
| Apr 11 | 16:00 | 540 | 70 | S15W33 | 3.0 | 3.0 | 22:00 | 7.0 | 0.015 |
| Apr 14 | 7:25 | 757 | 76 | N19W57 | 6.6 | 2.0 | 16:00 | 15.5 | 0.005 |
| Apr 17 | 8:00 | 1240 | 360 | S14W34 | 3.0 | 4.0 | 15:00 | 8.0 | 0.3 |
| Apr 21 | 1:15 | 2393 | 241 | S14W84 | 0.3 | 5.5 | 7:00 | 26.0 | 20 |
| Apr 30 | 22:44 | 1103 | 195 | bWL | 2.8 | 1.0 | 1 2:30 | 12.5 | 0.03 |
| May 20 | 15:10 | 553 | 35 | S21E65 | 1.8 | 0.5 | 17:30 | 5.0 | 0.005 |
| May 22 | 3:22 | 1557 | 360 | S22W53 | 4.2 | 13.5 | 21:00 | 11.0 | 1.1 |
| Jul 4 | 19:45 | 957 | 168 | bSWL | 0.7 | 2.5 | 23:00 | 12.0 | 0.004 |
| Jul 7g | 11:04 | 1423 | 197 | bWL | 1.5 | 3.5 | 16:00 | 12.5 | 0.4 |
| Jul 9 | 17:43 | 1076 | 360 | bSWL | 4.8 | 1.0 | 23:30 | 21.5 | 0.03 |
| Jul 15e | 21:00 | 1300 | 188 | N19W01 | 13.0 | 9.0 | 16 19:00 | 17.0 | 1 |
| Jul 20d | 20:50 | 1941 | 360 | bSEL | 19.2 | 15.0 | 22 07:00 | 80.0 | 0.53 |
| Aug 3 | 18:45 | 1150 | 138 | S16W76 | 3.3 | 1.0 | 23:00 | 5.5 | 0.004 |
| Aug 14 | 1:50 | 1309 | 133 | N09W54 | 0.7 | 5.5 | 8:00 | 8.5 | 0.25 |
| Aug 16 | 5:53 | 1378 | 152 | N07W83 | 2.1 | 0.5 | 8:30 | 6.5 | 0.009 |
| Aug 16 | 12:08 | 1585 | 360 | S14E20 | 4.3 | 5.5 | 22:00 | 26.0 | 0.03 |
| Aug 18 | 21:15 | 682 | 140 | S12W19 | 1.7 | 0.5 | 23:30 | 15.5 | 0.06 |
| Aug 20 | 8:10 | 1099 | 122 | S10W38 | 0.8 | 0.5 | 9:30 | 8.0 | 0.025 |
| Aug 22 | 1:22 | 998 | 360 | S07W62 | 1.6 | 1.0 | 4:00 | 16.0 | 0.4 |
| Aug 24 | 0:57 | 1913 | 360 | S02W81 | 1.6 | 1.0 | 3:30 | 21.0 | 6 |
| Sep 5 | 16:32 | 1748 | 360 | N09E28 | 7.5 | 10.5 | 6 10:30 | 25.5 | 0.12 |
| Sep 27 | 1:08 | 1502 | 59 | SWL | 1.3 | 0.5 | 3:00 | 5.0 | 0.002 |
| Oct 27d | 22:45 | 2115 | 360 | S10E130 | 28.2 | 47.0 | 31 2:00 | 80.0 | 0.02 |
| Nov 9 | 13:10 | 1838 | 360 | S12W29 | 2.3 | 7.0 | 22:30 | 9.0 | 5.5 |
| Nov 24 | 20:00 | 1077 | 360 | N17E34 | 11.0 | 3.0 | 25 10:00 | 33.5 | 0.0024 |
| Dec 19 | 21:25 | 1092 | 360 | N15W09 | 1.1 | 1.0 | 23:30 | 7.5 | 0.09 |
| 2003 | |||||||||
| Mar 17 | 19:15 | 1020 | 96 | S14W39 | 0.8 | 1.0 | 21:00 | 4.0 | 0.008 |
| Mar 18 | 12:10 | 1601 | 209 | S15W46 | 1.8 | 1.0 | 15:00 | 9.0 | 0.006 |
| Apr 7 | 9:12 | 719 | 69 | bSWL | 0.8 | 5.0 | 15:00 | 26.0 | 0.005 |
| Apr 21 | 12:58 | 784 | 163 | N18E02 | 3.0 | 2.0 | 18:00 | 31.0 | 0.006 |
| Apr 23 | 0:45 | 916 | 248 | N22W25 | 1.7 | 1.0 | 3:00 | 19.0 | 0.015 |
| Apr 24 | 12:30 | 609 | 242 | N21W39 | 1.5 | 0.5 | 14:30 | 1.5 | 0.013 |
| Apr 25 | 5:12 | 806 | 235 | N14E79 | 15.8 | 12. | 26 9:00 | 57.0 | 0.004 |
| May 28 | 0:20 | 1366 | 360 | S06W20 | 1.7 | 13.0 | 15:00 | 21.0 | 0.2 |
| May 31 | 2:20 | 1835 | 360 | S07W65 | 0.7 | 1.0 | 4:00 | 9.0 | 0.4 |
| Jun 15 | 23:40 | 2053 | 360 | S07E80 | 8.3 | 24.0 | 17 8:00 | 24 | 0.003 |
| Aug 19 | 7:12 | 412 | 35 | S13W63 | 1.8 | 1.5 | 10:30 | 4.0 | 0.004 |
| Aug 19 | 9:40 | 468 | 111 | S10W58 | NA | NA | 14:00 | 24.0 | 0.002 |
| Oct 4 | 18:45 | 1262 | 103 | bWL | 1.2 | 1.0 | 21:00 | 7.5 | 0.0013 |
| Oct 21 | 3:30 | 1484 | 360 | S15E90 | 24.5 | 11.0 | 22 15:00 | 60.0 | 0.015 |
| Oct 26 | 17:40 | 1537 | 171 | N02W38 | 0.7 | 1.0 | 19:00 | 14.0 | 6 |
| Oct 28 | 11:05 | 2459 | 360 | S16E08 | 0.9 | 1.0 | 13:00 | 15.5 | 20 |
| Oct 29 | 20:40 | 2029 | 360 | S15W02 | 0.8 | 1.0 | 22:30 | 17.5 | 30 |
| Nov 2 | 9:05 | 2036 | 360 | S23WL | 1.4 | 1.0 | 11:30 | 5.0 | 0.5 |
| Nov 2 | 17:20 | 2598 | 360 | S14W56 | 0.7 | 3.5 | 21:30 | 24.0 | 30 |
| Nov 4 | 19:40 | 2657 | 360 | S19W83 | 1.8 | 7.0 | 5 4:30 | 8.5 | 6 |
| Nov 18 | 8:10 | 1660 | 360 | N00E18 | 2.3 | 1.5 | 13:00 | 47.0 | 0.01 |
| Dec 2 | 10:25 | 1393 | 150 | S19W89 | 1.6 | 3.5 | 15:30 | 6.0 | 1.5 |
| 2004 | |||||||||
| Apr 11 | 4:00 | 1645 | 314 | S14W47 | 1.0 | 5.0 | 10:00 | 12.5 | 0.4 |
| Jul 5 | 22:20 | 1444 | 360 | bSWL | 15.7 | 10.0 | 6 24:00 | 87.0 | 0.002 |
| Jul 12 | 23:42 | 409 | 201 | N14W45 | 1.3 | 1.5 | 132:30 | 14.0 | 0.02 |
| Jul 25 | 14:40 | 1333 | 360 | N08W33 | 1.3 | 3.0 | 19:00 | 26.0 | 1.5 |
| Sep 2 | 23:40 | 751 | 360 | bWL | 3.3 | 0.5 | 3:30 | 32.5 | 0.002 |
| Sep 12 | 0:30 | 1328 | 360 | N04E42 | 6.5 | 8.0 | 15:00 | 30.0 | 0.02 |
| Oct 30 | 6:05 | 422 | 360 | N14W21 | 0.4 | 2.5 | 9:00 | NA | 0.03 |
| Nov 1 | 5:35 | 925 | 146 | bWL | 0.4 | 1.0 | 7:00 | 3.5 | 2 |
| Nov 7 | 16:20 | 1759 | 360 | N09W17 | 1.7 | 2.0 | 20:00 | 10.0 | 5 |
| Nov 10 | 2:10 | 3387 | 360 | N09W49 | 3.8 | 3.0 | 9:00 | 19.5 | 5 |
| Dec 2 | 23:50 | 1216 | 360 | N09E03 | 9.2 | 6.0 | 3 15:00 | 19.5 | 0.05 |
| 2005 | |||||||||
| Jan 15 | 6:05 | 2049 | 360 | N11E06 | 0.9 | 2.5 | 9:30 | 9.5 | 0.15 |
| Jan 15 | 22:40 | 2861 | 360 | N15W05 | 1.3 | 11.0 | 16 11:00 | 19.0 | 6 |
| Jan 17 | 9:05 | 2094 | 360 | N14W24 | 2.9 | 2.0 | 14:00 | 31.5 | 30 |
| Jan 20h | 6:50 | 3242 | 360 | N12W58 | 0.2 | 1.0 | 8:00 | 15.0 | 20 |
| May 11 | 18:55 | 550 | 360 | S10W47 | 2.1 | 1.0 | 22:00 | 7.0 | 0.01 |
| May 13 | 16:50 | 1689 | 360 | N12E12 | 0.8 | 22.0 | 14 15:30 | 8.5 | 5 |
| May 31 | 13:40 | 313 | 134 | N12W22 | 3.3 | 1.5 | 18:30 | 27.5 | 0.0012 |
| Jun 14 | 7:00 | 791 | 360 | N08W45 | 3.0 | 1.0 | 11:00 | 19.0 | 0.002 |
| Jul 9 | 22:00 | 1540 | 360 | N11W27 | 3.0 | 1.5 | 2:30 | 6.5 | 0.03 |
| Jul 12 | 16:15 | 523 | 360 | N11W64 | 2.2 | 0.5 | 19:00 | 3.0 | 0.003 |
| Jul 13 | 14:10 | 1423 | 360 | N11W80 | 1.8 | 8.0 | 14 00:00 | 9.0 | 0.2 |
| Jul 14 | 10:25 | 2115 | 360 | N11W90 | 2.6 | 7.0 | 20:00 | 25.0 | 3 |
| Jul 17 | 11:15 | 1527 | 360 | N11W130 | 2.7 | 4.0 | 18:00 | 12.0 | 0.7 |
| Aug 22 | 1:00 | 1194 | 360 | S08W50 | 1.0 | 2.0 | 4:00 | 6.0 | 0.15 |
| Aug 22 | 17:05 | 2378 | 360 | S12W60 | 1.9 | 5.0 | 23 00:00 | 17.0 | 6 |
| Aug 29 | 10:40 | 1600 | 360 | S11W148 | 2.3 | 4.0 | 17:00 | 28.0 | 0.03 |
| Aug 31 | 22:00 | 1808 | 360 | S11W181 | 5.0 | 11.0 | 1 14:00 | 23.0 | 0.035 |
| Sep 13 | 19:40 | 1866 | 360 | S09E10 | 3.7 | 4.0 | 14 3:00 | 26.0 | 3 |
| 2006 | |||||||||
| Jul 6 | 8:30 | 911 | 360 | S11W32 | 1.5 | 2.0 | 12:00 | 21.0 | 0.05 |
| Aug 16 | 15:45 | 888 | 360 | S14W13 | 4.2 | 4.0 | 17 00:00 | 27.0 | 0.001 |
| Nov 6 | 17:35 | 1994 | 360 | S00E100 | 2.4 | 1.0 | 21:00 | 33.0 | 0.002 |
| Dec 13 | 2:25 | 1774 | 360 | S06W24 | 0.6 | 3.0 | 6:00 | 15.0 | 8 |
| Dec 14 | 22:00 | 1042 | 360 | S06W46 | 2.0 | 1.0 | 15 1:00 | 18.0 | 0.5 |
| 2007 | |||||||||
| May 19 | 12:55 | 958 | 106 | N01W05 | 3.1 | 1.0 | 17:00 | 15.0 | 0.0015 |
| 2008 | |||||||||
| none |
Notes. aSolar source latitude and longitude. bWL and bEL are sources behind the west and east limbs. bThe time at which the 20 MeV proton intensity reaches about one-half of the peak value. It equals the CME launch time of column (2) + TO + TR. Dates are specified for one-half peak UT only where these differ from CME dates given in column (1). cPeak intensities in protons cm−2 s−1 sr−1 MeV−1. dAdditional SEP/CME event. eDifferent CME. fDifferent CME source region. gDifferent CME speed. hCME speed from Gopalswamy et al. (2010).
All such tables of event associations based on best judgments are provisional and subject to change. Comparisons with other lists of SEP event identifications and associations (Cane et al. 2006, 2010; Desai et al. 2006; Gopalswamy et al. 2004, 2010; J. Park 2011, private communication) yielded discrepancies that were resolved with data sources including SEP plots from the ERNE/SOHO experiment, metric and decametric-hectometric (DH) type II burst reports, SOHO EIT/LASCO movies, and lists of interplanetary shocks at 1 AU. Event associations from the period 1998–2002 included in Table 1 of K05 have been modified here by several event additions and deletions, modified CME speeds, different CME associations, and changed solar source locations. We added a 2002 event based on observations of the Mars Odyssey mission (Krucker et al. 2007). The new list of 217 events in Table 1 includes only SEP events for which the intensity profiles were adequate for making the timing estimates and for which confident solar source longitude and CME associations could be made.
The focus of this study are the gradual SEP events, but our selection criteria do not discriminate between those events and large impulsive SEP events, which can also be associated with CMEs (Kahler et al. 2001). We turn to the survey of impulsive SEP events observed through 2002 September with the Low-Energy Matrix Telescope on the Wind spacecraft by Reames & Ng (2004), which overlaps part of our Table 1. Of our 156 SEP events in that time interval, we identify only 6 or 7 matching events in Table 1 of Reames & Ng (2004). If we apply this rate to all of our Table 1, then only ∼5% of the SEP events are impulsive, and our statistical results will generally reflect the properties of gradual SEP events. The impulsive events will, however, lie predominately in well-connected (∼W20°–W80°) longitudes (Cliver & Ling 2007).
2.2. SEP Event Statistical Treatment
As in K05, we divide the 217 SEP events into 5 longitude ranges of about 43 events each, listed in the first column of Table 2. A primary goal is to look for SEP/CME correlations by calculating their CCs given in the top (vCME) and middle (W) sections of Table 2. We require a 98% statistical significance, which for 44 cases is CC = 0.35 (Bevington & Robinson 2003). The signs of the CCs indicate positive or negative correlation trends, and significant CCs are italicized in Table 2.
Table 2. Correlation Coefficients of SEP Timescales versus CME Speeds and Widths and SEP Peak Intensities
| SEP Timescalea | TO | TR | TD | TO+TR |
|---|---|---|---|---|
| Longitude (Events) | CME Speeds vCME | |||
| E130°–E06° (41–43) | 0.17 | 0.32 | 0.04 | 0.29 |
| E04°–W32° (38–44) | −0.16 | 0.21 | −0.02 | 0.09 |
| W33°–W60° (43–44) | −0.15 | 0.23 | 0.35 | 0.10 |
| W62°–W90° (42–44) | −0.19 | 0.41 | 0.42 | 0.30 |
| W100°–WL (42) | 0.02 | 0.32 | 0.08 | 0.18 |
| CME Widths W | ||||
| W33°–W60° | −0.20 | 0.25 | 0.41 | 0.10 |
| W62°–W90° | 0.06 | 0.36 | 0.31 | 0.35 |
| W100°–WL | 0.19 | 0.27 | 0.32 | 0.25 |
| Log 20 MeV Ip | ||||
| E130°–E06° | −0.07 | 0.02 | −0.32 | −0.03 |
| E04°–W32° | −0.30 | 0.15 | −0.04 | −0.02 |
| W33°–W60° | −0.31 | 0.34 | 0.42 | 0.10 |
| W62°–W90° | −0.49 | 0.36 | 0.14 | 0.14 |
| W100°–WL | −0.40 | −0.07 | −0.29 | −0.27 |
Download table as: ASCIITypeset image
A scan of the values of TO, TR, and TD of Table 1 shows that each of those values ranges over more than an order of magnitude and that the distributions are skewed toward smaller values. To represent a characteristic value for any set of timescales we use here the median value of each distribution. The few large values of the distributions result in standard deviations generally comparable to or larger than the medians of TO and TR and comparable to or less than medians of TD. The medians presented here are therefore typical values, but excursions to much larger values do occur. In the following presentations we use median values of both the SEP and CME parameters.
2.3. Correlations of SEP Timescales with CME Speeds vCME
For each SEP timescale and CME parameter comparison, we further subdivided each longitude range into event groups sorted on the CME parameter. For example, for TO and longitude E130°–E06° there are 43 events, and we calculate the median TO for 4 groups sorted by increasing CME speeds, with about 11 events in each group. Those median TO values of each group then constitute the data points of that longitude range shown in the top panel of Figure 1. The other longitude ranges are shown as similar series of four median values plotted at the appropriate TO and vCME medians in the figure, which allows us to compare variations of TO in both vCME and longitude. Similarly, we present the longitude/group medians of TR and TD in the top panels of Figures 2 and 3. Figures 1–3 allow us to look for correlation trends between the SEP timescales and associated vCME, but for statistical significance we need the CCs for each full set of ∼43 events in each longitude range given in Table 2.
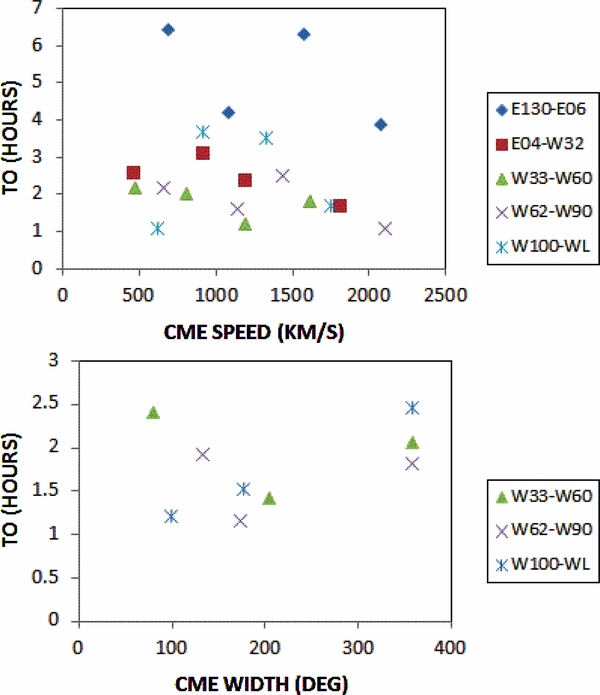
Figure 1. Top: plot of SEP event onset time TO medians vs. CME speed medians for the five longitude ranges. SEP events in each longitude range are divided into four speed groups of about 11 events in each speed group. Bottom: plot of SEP event TO medians vs. CME width medians for three western longitude ranges. SEP events in each longitude range are divided into three width groups, of which one group is exclusively 360° halo events.
Download figure:
Standard image High-resolution image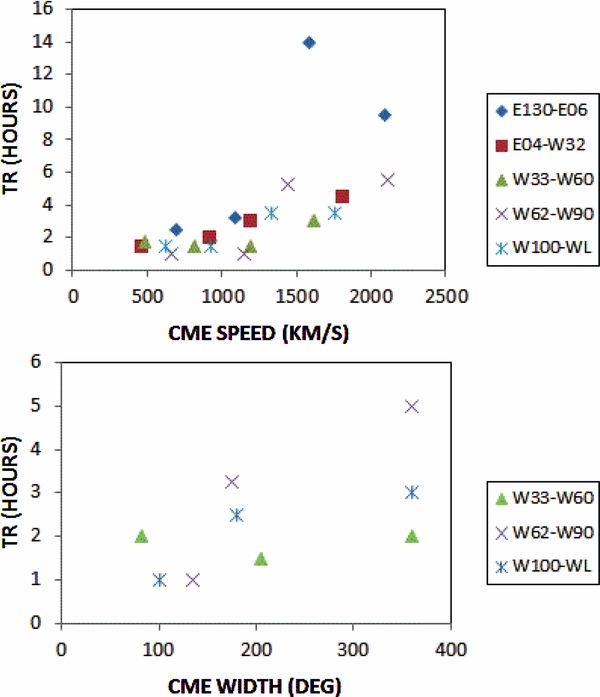
Figure 2. Same as Figure 1, but for the rise time TR medians.
Download figure:
Standard image High-resolution image
Figure 3. Same as Figure 1, but for the duration time TD medians.
Download figure:
Standard image High-resolution imageThe only significant CCs for vCME are those of TR for the W62°–W90° range and TD for both the W33°–W60° and W62°–W90° ranges, but TR correlates positively with vCME for all longitude ranges (Figure 2), consistent with longer SEP injection times from faster CMEs.
The lack of significant correlation of TR for longitudes near the central meridian is consistent with increasing differences between true values and plane-of-sky measurements of vCME (Burkepile et al. 2004). Consistent with this interpretation is the result that the TR CC, as well as the median vCME is lowest for the most central longitude range of E04°–W32°. The CCs of TO and TD are only suggestive of earlier SEP onsets and longer durations with faster CMEs, shown in the longitude groups of Figures 1 and 3.
2.4. Correlations of SEP Times with CME Widths W
For comparison with CME widths W, we use only the three most western longitude ranges, for which the observed W is least subject to projection effects in the plane of the sky. In this case, the large number of 360° halo events in each longitude range suggests the use of only three width groups, the largest of which is only the halo events. The median TO, TR, and TD group values are plotted in the bottom panels of Figures 1–3, and the CCs for each longitude range are given in the middle part of Table 2. TR and TD are both correlated with W at CCs at or slightly below our CC ⩾ 0.35 significance criterion.
When we find an SEP event parameter, in this case TR or TD, that correlates with both vCME and W, we have to be careful to check for a possible correlation between vCME and W. This situation was first encountered for log Ip of SEP events by Kahler et al. (1984), who found that vCME and W of the Solwind/P-78 CMEs, each correlated with the associated SEP event log Ip, were not themselves correlated. On that basis, those authors concluded that vCME and W were each somehow causal factors in SEP events. A recent comparison of 379 LASCO limb CMEs (Gopalswamy et al. 2009), however, has shown a strong linear correlation (CC = 0.69) between vCME and W. A similar pair of CME width and speed correlations was presented in Figure 10 of Cane et al. (2010). For the 130 events of our W33°–WL longitude ranges vCME and W are also correlated at CC = 0.46, well exceeding our 98% significance criterion. This immediately raises the question of whether only one of these variables is causally related to TR and TD, and if so, which?
2.5. SEP Peak Intensity Effects on Timescales
As discussed above, following numerous studies relating SEP peak intensities to CME properties, the goal here is to consider the SEP event timescales as a complementary tool for space weather forecasting and SEP physics. Implicit in K05 and the approach taken here is the assumption that the SEP event timescales are independent of the associated SEP peak intensities Ip. Our definition of TR and TD, keyed to 0.5Ip, is intended to yield timescales independent of Ip. The parameter TO, however, does depend on the ratio of the SEP peak intensity to the background, as some studies and models have shown (Lintunen & Vainio 2004; Sáiz et al. 2005; Rouillard et al. 2012). In several cases the SEP event onsets of Table 1 occurred during the enhanced backgrounds of previous SEP events. We therefore qualitatively expect TO to be generally larger (later onsets) for smaller SEP events, which in turn implies smaller TR for smaller SEP events. These effects should produce negative (positive) CCs for TO (TR) with log Ip.
We plotted log Ip versus TO and TR and calculated the corresponding CCs, which are presented in the bottom section of Table 2. The expected correlations are found, and the significant CCs are italicized, this time with a lower threshold of CC ⩾ 0.25, appropriate for 90% significance for 44 events. We employ the lower 90% threshold here since we look for an expected bias in the SEP timescale determinations, rather than for physical relationships with CMEs, as we did above. We show plots of two of the four significantly correlated longitude ranges of TO in Figure 4. The plots illustrate the five orders of magnitude spanned by Ip and how the TO distributions are skewed to smaller values for larger Ip. The main drivers of the negative correlations appear to be the small Ip events with TO > 4 hr in each plot. Inspection of those events in Figure 4 shows, however, that backgrounds of only 5 of the total 13 events exceeded the median 20 MeV background value of 0.0005 p cm−2 s−1 sr−1 MeV−1. Furthermore, the 13 events include none of the 6 or 7 impulsive SEP events of Reames & Ng (2004) included in Table 1. Thus, while background effects must contribute to the negative correlation and some incorrect CME associations are always possible, there may be a small population of SEP events with intrinsically large (>4 hr) TO values.
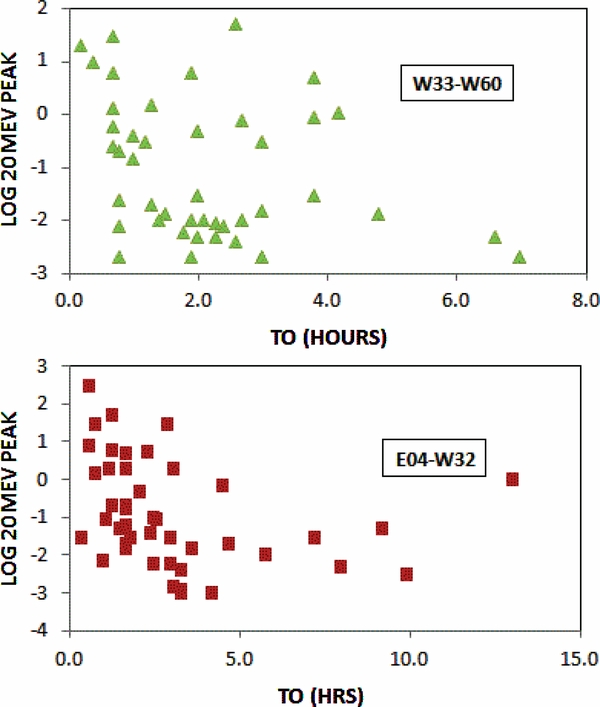
Figure 4. Log plots of SEP event 20 MeV peak intensities vs. onset times TO for the W33°–W60° (top) and E04°–W32° (bottom) longitude ranges, showing the population of small SEP events with large (>4 hr) TO.
Download figure:
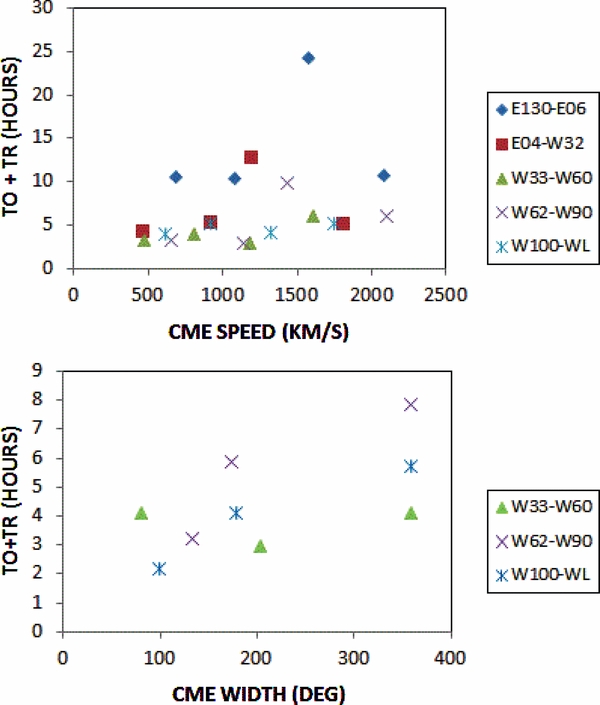
Standard image High-resolution imageThe way to finesse the expected threshold bias in TO and TR is simply to introduce TO+TR as a parameter, since the times of CME launch and of 0.5Ip are background independent. The last column of Table 2 gives those correlations, which for vCME are positive but not significant. The correlations with W are positive for the three longitude ranges, but barely significant for only one range. The corresponding plots are shown in Figure 5.
With TD and the more robust parameter TO+TR we can now ask whether those 20 MeV SEP timescales are independent of log Ip. The CCs of the last two columns of the bottom section of Table 2 show that result. The negative correlations with TO and positive with TR now essentially disappear with the small CCs for TO+TR. There is a trend, however, for TD to increase with log Ip for well-connected (W33°–W60°) events but to decrease with more poorly connected events.
2.6. Median SEP Timescales by Longitude
Determining the median timescales of the SEP events is a secondary goal of this work, and those times are given in Table 3. Since most of the SEP events of this study were included in K05, the median timescales of the five longitude ranges of Table 3 are only slightly changed from those of comparable longitude ranges in Table 2 of K05. There is a clear trend for timescales to increase from well-connected longitude (W33°–W90°) ranges toward the limbs. As emphasized above, the scatter in those parameters is considerable, as can be seen by comparing the TO values of the W33°–W60° and E04°–W32° events in Figure 1 with their corresponding distributions of Figure 4.
Table 3. Median Timescalesa of SEP Events
| Longitude | TO | TR | TD | TO+TR |
|---|---|---|---|---|
| E130°–E06° | 6.2 | 8.5 | 26.0 | 14.3 |
| E04°–W32° | 2.4 | 2.0 | 17.5 | 4.9 |
| W33°–W60° | 1.9 | 2.0 | 12.0 | 3.9 |
| W62°–W90° | 1.7 | 2.5 | 12.0 | 5.1 |
| W100°–WL | 1.9 | 2.3 | 14.0 | 4.5 |
Download table as: ASCIITypeset image
3. DISCUSSION
We have looked for correlations of 20 MeV SEP event timescales with CME speeds vCME and widths W using a data set of 217 SEP events over the 1996–2008 period. This study, revised and extended from our previous K05 study, considers the correlation variations with source longitudes and is complementary to works relating SEP peak intensities Ip to CME properties. The CME vCME was generally correlated with TR (Figure 2 and Table 2). This result is consistent with the correlation of SEP rise times (onset to peak) with vCME found by Hwang et al. (2010) for a sample of 63 GOES E > 10 MeV proton events. Their CC = 0.34 is similar to our CC = 0.28 taking all 217 events together. TD correlates with vCME in the well-connected longitude ranges, consistent with the view that faster CMEs continue injecting SEPs over longer time periods.
The TR and TD timescales correlate with the CME width W, at or somewhat less than our 98% confidence level. We noted that this result is deduced for only the three western longitude ranges and that there are significant correlations between CME W and vCME in those ranges (CC = 0.46) which could explain the timescale–W correlations as only a consequence of the W–vCME correlation alone. However, Kahler & Gopalswamy (2009) make a connection between the general observed requirement of fast (vCME > 900 km s−1) and wide (W > 60°) CMEs for SEP event associations (Gopalswamy et al. 2008) and the fundamental difference between bow shocks and piston-driven shocks. Fast and narrow CMEs act as projectiles through the solar wind to produce only narrow bow shocks, but fast and wide CMEs drive broad piston-driven shocks as they accrete solar wind material ahead of themselves (Vršnak & Cliver 2008), even when vCME may be subsonic. The interpretation we favor here for the W correlation with TR and TD is that a larger W implies a longer continued magnetic connection of the Earth to the SEP-producing regions of the broader piston-driven shock. In our view, both vCME and W are contributing factors to the enhanced values of TR and TD. However, the general correlation of CME W with vCME (Gopalswamy et al. 2009) does not allow us to preclude the third possibility that only W, and not vCME, is the primary causal factor of longer correlated TR and TD.
A new aspect of this study is the relationship between the observed SEP timescales and peak intensities Ip. This was prompted by the previous work cited in Section 2.5 to model variations of SEP onset times observed at 1 AU as functions of solar injection profiles and ambient backgrounds. We found the statistically expected qualitative effects of larger TO (Figure 4) and slightly smaller TR for smaller peak intensities Ip. However, it is not clear that the population of small SEP events with TO ⩾ 4 hr is necessarily due to the background effect since most of those events we examined in detail had relatively low backgrounds. We also note that the background variations of the SEP onset models produced differences of minutes to several tens of minutes at most in their onset times. Here we deal with half-hour averages of SEP intensities, a much coarser time bin than considered in the models. An implication is that the weak inverse correlations of TO with vCME shown in the first column of Table 2 and in the top of Figure 1 are negligibly biased by a possible background effect.
Large intensity SEP events tend to have long durations, and we looked for any correlation between TD, defined as the time the SEP intensity remains within 0.5Ip, and Ip itself. The results in Table 2 suggest a tendency for broader SEP intensity peaks with larger Ip at well connected but not poorly connected longitudes. However, TO+TR, the time from CME launch to the time of 0.5Ip, is independent of Ip. The well-known correlation of SEP log Ip with CME speed vCME and width W therefore does not imply any relationship of SEP timescales with those CME parameters. They must be separately investigated, as we have done here.
The TR values can be compared roughly to ΔTm, the time from onset to maximum, of 20–80 MeV protons of Figure 13 of van Hollebeke et al. (1975). At central and western longitudes, our TR values are somewhat smaller than those of ΔTm, as expected, since ΔTm extends from SEP onset to the full Ip. However, for eastern hemisphere events our TR value of 8.5 hr appears less than the fitted value for ΔTm. Cane et al. (1988) analyzed a comparable sample of 235 SEP events with delays from Hα flare maximum to time of Ip, comparable to our TO+TR. Here again, looking at E = 43–81 MeV events of their Figure 8, we find good agreement for western events, but much lower TO+TR for our central and eastern events, despite our lower 20 MeV energy range. The significantly longer rise timescales of the eastern hemisphere events of van Hollebeke et al. (1975) and Cane et al. (1988) are likely due not only to our times of 0.5Ip versus their Ip times, but also to their including peak intensities at times of shocks for many of their events, while we base TR on the peak observed well before any later shock peak. We conclude that our timescale results are compatible with those earlier works.
Figure 5. Same as Figure 1, but for the combined onset and rise time (TO+TD) medians.
Download figure:
Standard image High-resolution image
A final goal was to provide better timescales of ∼20 MeV SEP events to aid in space weather forecasting. Given an observed CME speed or width and/or an X-ray or Hα flare, Figures 10 and 11 of Cane et al. (2010) show the ranges of subsequent associated peak SEP intensities Ip. Our Figures 1–3 show the complementary median timescales as functions of CME speeds and widths for five source longitude ranges. Those timescales are presented as median values of ∼44 events per longitude range in Table 3 and are similar to the corresponding timescales of Table 2 of K05, as expected from the many SEP events common to both data sets. All the timescales reach minimal values in the best connected longitude ranges. With these studies comes the caveat that we and Cane et al. (2010) do not consider those cases in which fast and wide CMEs may not result in any observed SEP events, so SEP event probabilities can not be deduced from these studies.
S. Kahler was funded by AFOSR Task 2301RDZ4. I thank J. Park and S. Akiyama for comments on SEP source associations and the reviewer for very helpful comments that greatly improved the work. CME data were taken from the CDAW LASCO catalog. This CME catalog is generated and maintained at the CDAW Data Center by NASA and The Catholic University of America in cooperation with the Naval Research Laboratory. SOHO is a project of international cooperation between ESA and NASA. We thank D. Reames for the use of the EPACT proton data.