


ABSTRACT
Within the next five years, it is expected that the Advanced LIGO/Virgo network will have reached a sensitivity sufficient to enable the routine detection of gravitational waves. Beyond the initial detection, the scientific promise of these instruments relies on the effectiveness of our physical parameter estimation capabilities. A major part of this effort has been toward the detection and characterization of gravitational waves from compact binary coalescence, e.g., the coalescence of binary neutron stars. While several previous studies have investigated the accuracy of parameter estimation with advanced detectors, the majority have relied on approximation techniques such as the Fisher Matrix which are insensitive to the non-Gaussian nature of the gravitational wave posterior distribution function. Here we report average statistical uncertainties that will be achievable for strong detection candidates (S/N = 20) over a comprehensive sample of source parameters. We use the Markov Chain Monte Carlo based parameter estimation software developed by the LIGO/Virgo Collaboration with the goal of updating the previously quoted Fisher Matrix bounds. We find the recovery of the individual masses to be fractionally within 9% (15%) at the 68% (95%) credible intervals for equal-mass systems, and within 1.9% (3.7%) for unequal-mass systems. We also find that the Advanced LIGO/Virgo network will constrain the locations of binary neutron star mergers to a median uncertainty of 5.1 deg2 (13.5 deg2) on the sky. This region is improved to 2.3 deg2 (6 deg2) with the addition of the proposed LIGO India detector to the network. We also report the average uncertainties on the luminosity distances and orbital inclinations of strong detections that can be achieved by different network configurations.
Export citation and abstract BibTeX RIS
1. INTRODUCTION
Within the next few years, the first generation of gravitational-wave (GW) interferometers capable of regularly detecting astrophysical sources will come online (Harry & the LIGO Scientific Collaboration 2010; Virgo Collaboration 2009). The Advanced LIGO and Advanced Virgo detectors (and the anticipated LIGO India detector) will provide the first insights into the final moments of compact object mergers, including the mergers of binary neutron star (BNS) systems. Intense preparations are underway to characterize and extract as much physical information as possible from these signals.
The mergers of BNSs are expected to be one of the most common compact binary sources in the advanced detector era. Models from stellar evolution and observations of binary pulsars suggest that the number of BNS mergers within Advanced LIGO/Virgo's detection horizon could reach several tens to hundreds each year (Abadie et al. 2010b). Although the peak sensitivity of ground-based detectors is not focused on the frequency at which BNS systems merge, it could still be possible to extract information about both strong field gravitational physics (Li et al. 2012) and the the equation of state of dense nuclear matter (Hinderer et al. 2010). Furthermore, the observations of multiple BNS systems will provide key insights into the evolution of binary systems in the field (Kalogera et al. 2004; Kim et al. 2006; Osłowski et al. 2011; O'Shaughnessy et al. 2010). As such, BNS systems will likely form the "bread and butter" of the compact binary coalescence detection effort in the coming years.
Of course, one must distinguish between the detection of such events and the precision measurement of their relevant physical parameters. The detection of the BNS systems will be performed with a grid-based matched filtering approach. By comparing the data stream with a bank of theoretical templates, the time series data can be searched for candidate signals (Abadie et al. 2012). The parameter space of these signals exhibits degeneracies and strong correlations. In order to completely realize the science potential of LIGO and Virgo observations, we must perform a full exploration of the parameter space for each detection. To do so, we characterize the posterior distribution function using Bayesian inference to make informative, scientifically meaningful statements about the physics of BNS systems.
In this paper, we will study large signal-to-noise ratio (S/N) BNS coalescence events and report on the measurement capabilities of the LIGO/Virgo advanced detector network. The particular inference method used in our work is a Markov Chain Monte Carlo (MCMC) sampling code, lalinference_mcmc, included in the LIGO Algorithm Library parameter estimation library LALInference.
There is a long history of research which has sought to provide insight into what will be learned by GW observations. The majority of studies have employed the Fisher matrix formalism which was first adapted for GW parameter estimation by Finn (1992). While each of these studies (Poisson & Will 1995; Cutler & Flanagan 1994; Arun et al. 2005) have pointed out the limitations of the Fisher Information Matrix estimates, there have been relatively few studies that investigated the BNS parameter estimation capabilities of Advanced LIGO/Virgo observations using the full infrastructure of Bayesian inference which must be employed to draw robust conclusions about the GW source and its properties (Vallisneri 2008; Rodriguez et al. 2013).
Fisher matrix estimates, which our study seeks to improve upon, approximate the likelihood distribution as a multivariate Gaussian and are thus insensitive to more complicated structures such as multiple peaks, non-trivial correlations, skew, etc. Conversely, studies in GW parameter estimation have repeatedly shown that the recovered posterior distribution functions exhibit the very details which violate the explicit assumptions of the Fisher matrix formalism. Furthermore, measured quantities which are not tightly constrained, particularly distance and mass ratio, will be influenced by our choice of prior—a consideration which is typically left out of Fisher-based studies.
By relaxing assumptions about the shape of the likelihood distribution, and therefore the posterior, we provide more detailed insight into the average measurement accuracy for LIGO/Virgo observations of "loud" BNS mergers. These findings will help guide the community as it prepares to employ GW observations as a new tool to study astrophysics, relativity, and cosmology.
The goal of our study is to provide touchstone estimates of parameter estimation uncertainties for Advanced LIGO/Virgo observations of strong BNS signals, accounting for the complexity of the likelihood distribution. For ease of accessibility, the results are collected and summarized in Tables 1 and 2.
Table 1. Median 68% and 95% Credible Intervals for Intrinsic Parameters for Each of the Four Systems Considered
| HLV | ||||||||||
|---|---|---|---|---|---|---|---|---|---|---|
| System |  |
ΔM1/M1 | ΔM2/M2 | ΔMtot/Mtot | Δq | |||||
| Credible Level | 68% | 95% | 68% | 95% | 68% | 95% | 68% | 95% | 68% | 95% |
| 1 M☉ − 1 M☉ | 0.00497% | 0.0104% | 7.17% | 11.9% | 6.39% | 10.3% | 0.643% | 1.25% | 0.123 | 0.197 |
| 1.4 M☉ − 1.4 M☉ | 0.00883% | 0.0188% | 7.77% | 13% | 6.87% | 11.1% | 0.746% | 1.47% | 0.132 | 0.212 |
| 1 M☉ − 2.5 M☉ | 0.0176% | 0.0355% | 1.86% | 3.74% | 1.59% | 3.23% | 1.48% | 2.99% | 0.0138 | 0.028 |
| 2.5 M☉ − 2.5 M☉ | 0.0246% | 0.0522% | 9.02% | 15% | 7.82% | 12.6% | 1.01% | 1.94% | 0.149 | 0.239 |
| HLVI | ||||||||||
| System |  |
ΔM1/M1 | ΔM2/M2 | ΔMtot/Mtot | Δq | |||||
| Credible Level | 68% | 95% | 68% | 95% | 68% | 95% | 68% | 95% | 68% | 95% |
| 1 M☉ − 1 M☉ | 0.00497% | 0.0106% | 7.15% | 11.9% | 6.38% | 10.4% | 0.646% | 1.27% | 0.123 | 0.198 |
| 1.4 M☉ − 1.4 M☉ | 0.00884% | 0.0188% | 7.67% | 12.8% | 6.79% | 11.1% | 0.733% | 1.46% | 0.13 | 0.211 |
| 1 M☉ − 2.5 M☉ | 0.0176% | 0.0352% | 1.85% | 3.72% | 1.59% | 3.2% | 1.47% | 2.96% | 0.0137 | 0.0277 |
| 2.5 M☉ − 2.5 M☉ | 0.0243% | 0.0515% | 9.03% | 14.9% | 7.84% | 12.6% | 0.998% | 1.92% | 0.149 | 0.238 |
Notes. We report the credible intervals of quantities measured, as well as the component masses and total mass. Although the results for the HLV and HLVI configurations are quantitatively identical, we report them separately for consistency.
Download table as: ASCIITypeset image
Table 2. Median 68% and 95% Credible Intervals of Extrinsic Parameters for Each of the Four Systems Considered
| HLV | ||||||||||
|---|---|---|---|---|---|---|---|---|---|---|
| System | ΔD (mpc) | Δ|cos (ι)| | Δα (deg) | Δδ (deg) | ΔΩ(deg2) | |||||
| Credible Level | 68% | 95% | 68% | 95% | 68% | 95% | 68% | 95% | 68% | 95% |
| 1 M☉ − 1 M☉ | 49.4 | 89.9 | 0.323 | 0.611 | 1.73 | 4.09 | 2.51 | 5.52 | 5.12 | 13.5 |
| 1.4 M☉ − 1.4 M☉ | 61.4 | 107 | 0.314 | 0.588 | 2.63 | 5.42 | 2.53 | 5.27 | 4.12 | 11.2 |
| 1 M☉ − 2.5 M☉ | 68.8 | 127 | 0.31 | 0.549 | 2.41 | 4.6 | 2.77 | 6.2 | 4.37 | 12.1 |
| 2.5 M☉ − 2.5 M☉ | 116 | 198 | 0.349 | 0.613 | 1.75 | 4.51 | 2.42 | 5.01 | 4.62 | 12 |
| HLVI | ||||||||||
| System | ΔD (mpc) | Δ|cos (ι)| | Δα (deg) | Δδ (deg) | ΔΩ(deg2) | |||||
| Credible Level | 68% | 95% | 68% | 95% | 68% | 95% | 68% | 95% | 68% | 95% |
| 1 M☉ − 1 M☉ | 42.7 | 76.2 | 0.267 | 0.455 | 1.13 | 2.25 | 1.48 | 3.01 | 1.87 | 5.37 |
| 1.4 M☉ − 1.4 M☉ | 66.6 | 121 | 0.285 | 0.509 | 1.27 | 2.48 | 1.49 | 3.01 | 2 | 5.12 |
| 1 M☉ − 2.5 M☉ | 73.7 | 130 | 0.297 | 0.499 | 1.29 | 2.42 | 1.42 | 2.89 | 1.75 | 4.87 |
| 2.5 M☉ − 2.5 M☉ | 120 | 213 | 0.301 | 0.517 | 1.18 | 2.34 | 1.55 | 3.14 | 2.25 | 5.99 |
Notes. As expected, there exists a substantial improvement in the sky localization capabilities of the four-detector HLVI configuration over the three-detector HLV configuration. Note that the solid-angle sky location credible intervals, ΔΩ, are calculated directly on the 2D sphere, not by combining the α and δ uncertainties.
Download table as: ASCIITypeset image
Our study provides complementary results to previous investigations which used similar methods but pursued different questions. While our work reports on the recovery of all system parameters for a range of plausible BNS mass and mass-ratios at a fixed (and comparatively large) S/N, recent papers (Nissanke et al. 2011, 2013) have prioritized multi messenger astronomy by simulating a LIGO/Virgo detection catalog and strictly reporting on how well BNS mergers can be localized on the sky and/or in volume to facilitate electromagnetic observations. We are in agreement with the published work where our findings overlap, and we proceed to also examine how well intrinsic quantities, in particular the mass parameters, are measured for strong detections. Our work also distinguishes itself both from Nissanke et al. (2011, 2013) and Veitch et al. (2012) by quantifying the effects of mass ratio on parameter recovery, whereas the previous studies have restricted their results for BNS systems to the equal mass case.
In Section 2, we describe the infrastructure of the parameter estimation code, LALInference, and its associated MCMC sampler, lalinference_mcmc, as well as the frequency-domain GW template we employ. In Section 3, we qualitatively analyze the posterior probability density functions (PDFs) for BNS systems with different masses and extrinsic parameters. We select three equal-mass and one unequal-mass binary systems as prototypical examples of BNS systems. Each system is analyzed 40 times with isotropically selected sky locations and orbital orientations, and with a distance such that each signal was injected with a network S/N of 20. The results are divided into three subsections of interest: the recovery of the mass parameters (Section 3.1), the recovery of the orbital inclination and luminosity distance (Section 3.2), and the localization of sources on the sky (Section 3.3). Finally, we provide quantitative one-dimensional (1D) credible intervals on each parameter in Section 4. Throughout this paper, we adopt geometrized units with G = c = 1.
2. PARAMETER ESTIMATION
The parameter estimation methodology used here—namely, matched filtering with post-Newtonian (pN) waveforms and using MCMC to sample the posterior—have become sufficiently ubiquitous in the GW literature that we will give only a very cursory treatment of both mainly for the sake of introducing notation and terminology. We refer readers seeking more detail to Appendix A and references therein.
We begin by introducing the matched filtering formalism for parameter estimation. We assume that the time-domain signal in a GW network can be written as the sum of a gravitational waveform h0 and the noise of the detector n. We further assume that this noise is stationary and Gaussian with zero mean. The detector output is simply

Since the noise model is Gaussian, we can write the probability of a specific signal realization s given an input waveform  as being proportional to the probability that the residual is Gaussian distributed once the waveform has been subtracted

where  is the set of parameters for the template waveforms. The quantity
  is the likelihood of the signal s given the parameters
  . The inner product, <| >, is defined using the noise spectrum of the detectors as

where Sn(f) is the one-sided power-spectral density (PSD) as a function of frequency, and  and
and  are the Fourier transforms of the time-domain data a(t) and b(t). If we pick a set of parameters
  such that
  , then the likelihood (2) will be near a global maximum; however, the presence of noise will in general deflect the maximum of our likelihood away from the value at
  . Therefore, the maximum likelihood parameters do not necessarily correspond to the true parameters of the source.
Once we have the likelihood of the signal (2), we employ Bayes' Theorem to obtain the posterior probability of the system parameters  given the signal s as

where  are the prior probabilities on our source parameters and p(s) is a normalization constant.
2.1. Markov Chain Monte Carlo
The LIGO Algorithm Library Bayesian inference code LALInference is designed as a unified framework for GW parameter estimation. By using a common setup for waveform generation, PSD estimation, data handling, and other associated techniques from GW parameter estimation, LALInference allows the implementation of multiple samplers of the parameter space, including Nested Sampling (lalinference_nest, described in Veitch & Vecchio 2010) and MCMC (lalinference_mcmc). We elect to use the MCMC sampler for this study. lalinference_mcmc is based upon the previously described code, SpinSpiral (van der Sluys et al. 2009; Raymond et al. 2010). The MCMC employs a Metropolis-Hastings sampling algorithm (Gilks et al. 1995), which is described in Appendix A.
2.2. Parameter Space
Our methodology is predicated on the existence of accurate templates. We assume no systematic difference between our model waveforms and the true GW signal. We use a frequency-domain waveform accurate up to 3.5 pN order in phase and 3 pN order in amplitude of the lowest (l = |m| = 2) spatial mode. We restrict ourselves to quasi-circular, non-spinning waveforms as a simplifying assumption. The standard form of our waveform model, known as the TaylorF2 approximant, is calculated via the stationary-phase approximation (Buonanno et al. 2009). Future studies will be needed to include the impact of realistic NS spin and/or the bias introduced by using approximate waveforms.
In the absence of any spin, the phase evolution of the gravitational-waveform is determined by four intrinsic parameters—the two masses (M1 and M2) and two intrinsic constants of integration (ϕ0 and tc). In addition, there are five extrinsic parameters that do not influence the inspiral of the binary but which govern the amplitude of the signal in each detector. Considering these parameters leads to a nine-dimensional (9D) parameter space for non-spinning systems as employed in our MCMC:

where
- 1.
 is the chirp mass;
 - 2.q ≡ M2/M1 is the mass ratio;
- 3.ϕ0 and tc are the chirp phase and chirp time, arbitrary phasing parameters;
- 4.D is the luminosity distance to the binary;
- 5.ι is the orbital inclination (the angle between the orbital angular momentum and the line of sight);
- 6.ψ is the GW polarization; and
- 7.α and δ are the right ascension and declination of the source on the sky.

Since the wave amplitude depends on the orientation of the binary with respect to each detector, most of the information about these extrinsic parameters comes from two sources: the time-of-arrival triangulation of the signal and the relative amplitudes in each detector in the network.
2.3. Priors
We are interested in the posterior  as it encodes information about both the prior state of knowledge about the problem in addition to the likelihood of the signal. We adopt the same conventions for the prior distribution as were used in the follow-up parameter estimation studies of simulated detections during LIGO's sixth and Virgo's second science collection periods (Aasi et al. 2013). They are:
- 1.uniform in component masses from 0.8 M☉ ⩽ M1, 2 ⩽ 30 M☉, with a minimum chirp mass of 0.6 M☉;
- 2.uniform in volume, which implies a luminosity distance prior of p(D)dD∝D2dD;
- 3.uniform in coalescence time over the segment of data being analyzed; and
- 4.isotropic in all angles.
2.4. Detector Configuration and Noise Models
To perform the integral defined in Equation (3), we used as our power-spectral density the best estimate for a high-power, zero-detuning configuration of Advanced LIGO, provided by the LIGO Scientific Collaboration. Both the noise curve and the technical reports describing it can be found in Shoemaker (2009). We consider two configurations of the advanced detector network: a three-detector configuration consisting of the two LIGO sites (in Hanford, WA, and Livingston, LA) and the Virgo site (in Pisa, Italy), and a four-detector configuration that adds the proposed LIGO-India detector (in Chitradurga, KA). We refer to these network configurations as HLV and HLV1, respectively. For simplicity, we assume that each detector is operating at the Advanced LIGO sensitivity.
For a multi-detector network, the noise-weighted inner products (Equation (3)) combine linearly so long as the noise is uncorrelated between detectors, allowing us to use the above formalism with an additional summation over interferometers in the network. We integrate the inner product from a lower-frequency cutoff of 20Hz to the innermost-stable-circular orbit of the systems, which for a non-spinning binary is a function only of the total mass:

We define the S/N of a GW in a single detector as

where  and
and  are the frequency-domain data and template, respectively, and the normalization σ is given by

When dealing with a network of GW detectors, the S/Ns of the individual detectors add in quadrature. That is, the network S/N for a detection is

where S/Ni is the S/N, given by (7), of the ith detector.
For this study, we consider four separate populations of BNS systems, with component mass combinations of 1 M☉/1 M☉, 1.4 M☉/1.4 M☉, 1 M☉/2.5 M☉, and 2.5 M☉/2.5 M☉. Each population consisted of 40 signals distributed randomly in sky location, polarization, inclination, time-of-arrival, and coalescence phase. The luminosity distance, D, was selected to yield a signal strength of S/Nnetwork = 20 for each source in each network configuration. While unphysical from an astrophysics perspective, this choice allows us to explore the parameter estimation in the context of loud but plausible detection candidates. Signals much stronger than S/N = 20 will most likely be rare. Signals much lower will be at the threshold for detection, where details of the instrument noise play a more commanding role in any inferences which will be drawn from the observations, making it impossible to meaningfully quantify "typical" parameter estimation accuracies until the detectors begin operating.
Finally, note that the PSD that defines the inner product (Equation (3)) is simply the time-averaged sensitivity of a given detector to a specific frequency. Under ideal circumstances any stretch of data should contain a specific noise realization drawn from a Gaussian colored by the PSD; however, in practice, non-Gaussian noise events are occasionally present in the data. While we await the completion of the advanced detectors, we are without a realistic model including the actual instrument performance, and we cannot accurately simulate GW data to the point of making complete predictions about parameter estimation capabilities. Because of this, we elect to focus only on the part of the simulation over which we have control by setting n(t) ≡ 0. Thus, what is reported here are strictly the statistical errors due to the flexibility of the waveforms and the expected sensitivity of the advanced era detectors while suppressing any effects of random detector noise. Consequently, what we recover with the MCMC should be interpreted as the posterior distribution function for each source averaged over all possible (Gaussian) noise realizations, assuming we have the correct PSD and that the signal is sufficiently powerful for the linearized-signal approximation to be valid. By selecting a source population with an artificial distribution in S/N, we ensure that the "zero-noise" as an average uncertainty approximation is valid. We discuss further the validity of this approach in Appendix C.
3. RESULTS
Of the nine parameters in the domain of the waveform, only six are particularly physically interesting: the masses of the two binaries, M1 and M2, the orbital inclination, ι, the angular position on the sky, α and δ, and the luminosity distance of the source, D. While the coalescence phase, ϕ0, the coalescence time, tc, and the wave polarization, ψ must be included in any parameter estimation of the waveform, they do not encode any information of particular astrophysical interest.
In Figure 1, we provide an example of the nine, 1D marginalized posterior probability density functions recovered from a single 1.4 M☉/1.4 M☉ BNS system. These PDFs are representative of the type of results that will be produced by parameter estimation studies in the advanced detector era. Notice that the peak of several parameters, including the chirp mass,  , appears to be displaced from the true values in dashed red. This effect is due to gradients in the priors on the mass parameters and distance, and the reduction of the 9D PDF to a series of marginalized 1D PDFs. For instance, the 1D PDF for chirp mass is marginalized via

where the notation  implies all parameters of Equation (5) except
  . Other parameter and higher-dimensional marginalizations follow a similar convention. In practice, the MCMC samples make this integral trivial: since the samples are distributed according to the posterior, Equation (10) can be "computed" by simply histogramming the chain entries of a single parameter, implicitly calculating a Monte Carlo integral over all other parameters.

Figure 1. Marginalized 1D posterior probability densities of a typical 1.4 M☉/1.4 M☉ BNS system. We have plotted each of the nine parameters for our non-spinning BNS problem as stated in Section 2.2. Note how, even for parameters with excellent recovery, the peak of the 1D Gaussian is displaced from the injected value (in dashed red). This is not due to a systematic bias but is caused by the marginalization of a single dimension from the full 9D posterior space. To better see this effect, compare the 1D PDF for  and q with the 2D marginalized PDF in Figure 2. The plots here represent the Gaussian kernel density estimator of each PDF. The plot for q was computed by reflecting the highest 10% of samples across the q = 1 boundary, in order for the smoothed plot to agree with the binned histograms.
Download figure:
Standard image High-resolution imageWe display marginalized 1D distributions after smoothing with a Kernel Density Estimator (KDE). At a prior boundary (e.g., q = 1) the KDE is artificially depleted because there is no support from beyond the edge in parameter space. To rectify this, it is customary to reflect some of the points across the boundary, so that the KDE resembles the histogram. This estimator is unbiased as long as the first derivative of the prior is zero at the boundary. We elected to use 10% of the points, as it was the minimum number required to get the smooth KDE to match the binned histograms.
3.1. Mass Parameters
Of the nine variables in our parameter space (5), the mass parameters,  and q, or correspondingly, M1 and M2, are the most astrophysically interesting. The ability of the Advanced LIGO/Virgo network to construct a population of BNS masses will be one of the more useful and immediate applications of GW astronomy.
If we sort our results by each system's mass parameters, we find virtually no difference between the mass PDFs of injections with the same intrinsic parameters. More simply, at a given S/N, the accuracy to which LIGO/Virgo can measure the mass parameters of a (non-spinning) BNS system is independent of the sky location and orientation of the binary. This can be understood if we recall that the mass parameters are the only two which directly affect the phase evolution of the waveform (B2). Therefore, as long as the source's mass parameters are equivalent, and the injected S/N is the same for each source, the amount of recoverable information pertaining to the phase of the waveform is identical. The only noticeable difference will come from the specific realization of noise produced by the detector, which we address in Appendix C.
In Figures 2 and 3, we show the marginalized 2D posterior PDFs of our mass parameters for prototypical equal-mass and unequal-mass binaries. We include the PDF in both the  space (relevant for the waveform and the MCMC algorithm) and the more physically interesting component mass space (M1–M2). Although only the 1.4 M☉/1.4 M☉ system is included in Figure 2, the PDF is qualitatively identical to the other equal mass cases, modulo a scaling factor.

Figure 2. 2D marginalized posterior probability density functions for the mass parameters recovered in typical a 1.4 M☉/1.4 M☉ system. The posteriors are plotted in terms of parameters used in the waveform, chirp mass ( ), and the mass ratio (q), and in the individual component masses of the binary (M1 and M2). In the
  space, the posterior would almost resemble a Gaussian if not for the limitation of q ⩽ 1. The presence of the q cutoff and the convention that M1 ⩾ M2 inform the non-Gaussian features that are present. When projected as 1D marginalized posteriors, the component masses resemble the posterior PDFs shown in Figure 4.
Download figure:
Standard image High-resolution image
Figure 3. Similar to Figure 2, but for a typical 1 M☉/2.5 M☉ system. The unequal mass ratio displaces the posterior PDFs from the q ⩽ 1 boundary present in the equal-mass case, yielding a Gaussian PDF in both the  and M1–M2 spaces.
Download figure:
Standard image High-resolution imageTo condense the results into a single figure of merit, we average the 1D mass PDFs into a single posterior probability for the system in Figure 4. Notice how, when averaged and normalized to the injected values, the recovery of the component masses depends only on the mass ratio. Furthermore, for systems with equal component masses, the posterior barely extends beyond 15% of the injected values. If one assumes that the threshold between black holes and neutron stars lies at approximately 3 M☉, then it might be naively assumed that the mass recovery would allow one to discriminate between black holes and neutron stars.

Figure 4. Mass PDFs for the four BNS systems, averaged over each of the 40 injections. The average is reported since, in practice, there was quantitatively no difference between the recovered PDFs for different systems with identical masses and S/Ns. Systems with identical mass ratios but different total masses have quantitatively identical PDFs when normalized to the total mass. Similarly to Figure 1, we plot the Gaussian kernel density estimates and reflect 10% of the points across the q = 1 and M1 = M2 boundaries (for the three equal-mass cases).
Download figure:
Standard image High-resolution imageIn practice, there is a physical complication to this claim: we have neglected the spin of the binaries, which will be highly correlated to the masses. This coupling means that in the case where the component masses have non-negligible spins parallel to the orbital angular momentum of the binary, a higher-massed spinning system can produce waveforms very similar to a non-spinning, low-mass binary. This effect makes it extremely difficult to discern between, for example, non-spinning neutron stars and spin-aligned, stellar mass black holes (Baird et al. 2013; Hannam et al. 2013). However, the situation is not hopeless: if the spins are misaligned, the spin vectors will couple to the orientation of the binary (encoded in the three angles ϕ0, ι, and ψ) via relativistic precession. It remains to be seen if using fully spinning waveforms will make it possible for the Advanced LIGO/Virgo network to discern BNSs from their spinning black hole counterparts.
In Table 1, we list the 68% and 95% credible intervals for the mass parameters. We find that the component masses for equal mass systems can be isolated to between 6.4% and 9% (10.3% and 15%) fractional uncertainty at the 68% (95%) credible interval. This value drops to less than 1.9% (3.7%) for the components of the unequal mass systems. Again, this neglects the effects of spin which can substantially increase these values.
3.2. Inclination and Distance
BNS systems (along with neutron star/black hole systems) are one of the best candidates for progenitors of short, hard gamma-ray bursts (SGRBs; Nakar 2007 and references therein). After the merger, the remnant is believed to emit the burst along the axis of orbital angular momentum, making the inclination of the binary system of particular interest to gamma-ray astronomy (Abadie et al. 2010a; Corsi et al. 2012). The inclination is detected as a relative amplitude difference between the two GW polarizations, such that to lowest order

It should be apparent that the luminosity distance D and the inclination ι can be highly correlated in any parameter estimation recovery.
Given this degeneracy, it should come as no surprise that the 2D marginalized posteriors of distance and inclination are the broadest of the six physically interesting parameters. Four typical 2D PDFs are presented in Figure 5. Notice the bimodal uncertainty present in the top 2D PDF along the ι axis, due to the similarity between the evaluated likelihoods at ι and ι + π/2. As the majority of the information extracted via parameter estimation is from the phase of the signal, the recovery of the posterior in D–ι space will be limited, even during the Advanced LIGO/Virgo era; however, if a GW signal is matched to a detected SGRB counterpart (which may occur at the rate of ∼3 yr−1 in the Advanced LIGO/Virgo network, according to Metzger & Berger (2012)), the optical information about the orbital inclination will provide an additional constraint on the D-ι space, vastly improving the luminosity distance recovery quoted here. These results qualitatively agree with those of Nissanke et al. (2011), who studied in detail MCMC estimation of D–ι measurements from GW detectors with coincident GRB detections.

Figure 5. Typical marginalized 2D mass PDFs for luminosity distance D and orbital inclination ι. Notice the bimodal distribution on the first PDF, that can occur when a system is detected nearly "edge-on" (ι ≈ π/2). In general, the degeneracy between distance and inclination forces the PDF into one of these two paths when the system is not edge-on, as seen in the second and third PDFs.
Download figure:
Standard image High-resolution imageIn Table 2, we list the averaged 68% and 95% credible intervals for distance and inclination. Notice that the uncertainties on distance can be extreme, from tens to hundreds of Mpc. When discussing the inclination angle, we elected to use |cos (ι)|, as this maps the occasional bimodal structure into a single PDF, and observing a compact merger at ι and ι + π/2 should yield identical physics.
3.3. Sky Localization
Unlike the mass parameters, the recovery of the position on the sky is highly dependent on the location of the source with respect to the detector network in question. Much of the information about the sky position of the source comes from the relative timing of the signals in each detector. For the HLV configuration there are two regions in the sky which produce consistent delays in the arrival time of the GW signal between pairs of detectors. That is, when using only time-of-arrival information, there is equal support in the probability density functions around the true location and the region of the sky found by reflecting the correct line of sight through the plane formed by the three detectors. See Fairhurst (2011) for a global analysis of time-of-arrival accuracy for various network configurations, including those considered here. See also LIGO Scientific Collaboration et al. (2013) for a similar analysis, applied to each stage of the advanced detector network.
In practice, however, additional information from the wave polarization and the relative difference in S/N between individual detectors can break this plane-reflection degeneracy, leading to a bi-modal distribution with significantly more support in one mode of the PDF. By fitting for the sky location and the polarization simultaneously, the MCMC can often identify the correct mode on the sky. For the four-detector configuration, this concern is irrelevant: even with time-of-arrival data alone, the HLVI network can constrain any source to a single mode on the sky. Even then, there are still locations on the sky in which two or more detectors are not sensitive to the GW signal, yielding distorted, non-Gaussian PDFs.
The sky location uncertainties for HLV and HLVI are shown in Figures 6 and 7, respectively. We show all four mass bins together, since in practice the mass of the signals has little effect on the recovery of the sky location for the considered BNS systems. Only the location on the sky, the network configuration, and the other extrinsic parameters were found to be relevant. In particular, notice the increase in efficiency between the HLV configuration and the HLVI configuration. The network S/N is held fixed for each configuration so the improvements seen here are strictly due to extra information provided by the additional interferometer, not the increased S/N a fourth detector would provide for sources at a fixed distance.

Figure 6. Uncertainties on the sky of 160 BNS systems in the HLV detector configuration. Each region represents a single injection, with the colored central region representing the 68% uncertainty region on the sphere, and the gray shade representing the 95% uncertainty region. The color scheme indicates the total solid angle size of the 68% region. Note the similar shape of the uncertainty regions at particular points; this is due to the specific pattern of sensitivity over the sky for the three-detector network.
Download figure:
Standard image High-resolution image
Figure 7. Same as Figure 6, except for the HLVI detector configuration. Note the substantially lower average uncertainties on the skies for the majority of the injections. Also note the lack of large, "banana-shaped" uncertainties that were recovered by the HLV configuration. The two improvements are strictly due to the breaking of the plane degeneracy that is facilitated by the transition to a four-detector network, and not the additional S/N achieved by adding another detector to the network. The S/N was held at 20 for both figures.
Download figure:
Standard image High-resolution imageIn the HLV configuration, there exist points on the sky in which the signal was injected near the plane of the detector network. This causes the elongated, "banana-shaped" PDFs seen in Figure 6. In the HLVI configuration, the plane is no longer relevant, and there are substantially fewer regions in which only two detectors see a sufficiently strong signal. For the HLV configuration, we find that all of the signals are recovered with a solid angle uncertainty of less than 64 deg2 (136 deg2) at the 68% (95%) credible interval, while the HLVI configuration recovers all signals to less than 14 deg2 (45 deg2). The median quantitative results for the two network configurations show a similar benefit with the addition of LIGO India, and are again reported in Table 2.
Previous studies have considered the increase in sensitivity from the addition of the LIGO India site. Nissanke et al. (2013) studied the decrease in sky location uncertainties obtained by the inclusion of the LIGO India site into the advanced detector network. Their study also employed an MCMC sampling technique (a modified version of CosmoMC) to determine the average parameter estimation uncertainties for a realistic distribution of sources. As the current study is interested in the average uncertainties of strong sources at S/Nnetwork = 20, ignoring the effects of less viable detection candidates, it is useful to compare the 95% credible intervals between the two studies. The cumulative distributions of sky area uncertainties for both network configurations in each study are plotted in Figure 8.
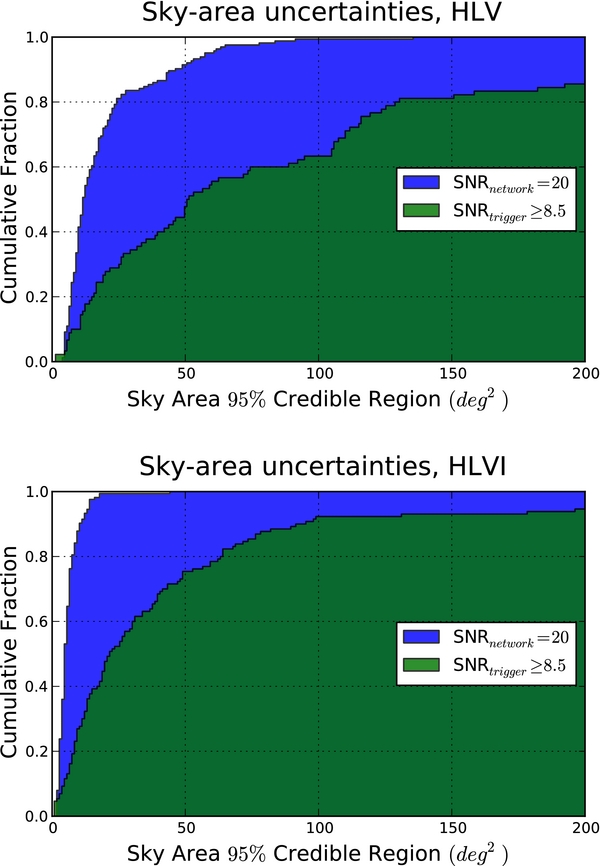
Figure 8. Cumulative fraction of sources found within deg2 at the 95% credible interval. This plot contains results from two separate studies: the current study, in which only strong detection candidates are considered (S/Nnetwork = 20), and Nissanke et al. (2013), which employs a separate MCMC code on a realistic source population (where S/Ntrigger ⩾ 8.5 is employed to determine parameter estimation sources). The strong detection candidates are constrained to substantially smaller solid angles on the sky, as is expected for such "gold-plated" events, while both studies show a substantial decrease in sky area uncertainties for the HLVI configuration.
Download figure:
Standard image High-resolution imageThe difference in uncertainties between the two studies is illustrative. Nissanke et al. (2013) considered a realistic distribution of sources motivated by a local galaxy catalogue for sources where D ⩽ 200Mpc, and homogeneously distributed in co-moving volume for sources where D > 200Mpc. The "detection candidates" which underwent parameter estimation were limited to the signals where S/Nnetwork ⩾ 8.5. The S/N threshold for a detection is a simplification to the actual detection statistic used for BNS searches. The current study considers a source population isotropically distributed on the sky, but at distances such that each signal represents a relatively high precision case for parameter estimation. Figure 8 compares the sky area uncertainties that will be available to those considering "good GW events" (e.g., precision source localization), and the uncertainties that one can gather by considering all GW candidates with S/Nnetwork ⩾ 8.5 (e.g., electromagnetic follow-up). As expected, both source populations show a dramatic decrease in parameter estimation uncertainties with the addition of the LIGO India site to the advanced detector network. This holds true even when considering the increased number of nominal sources available to the HLVI network configuration in the Nissanke population, where the expansion of the network detection horizon due to LIGO India increases the number of sources to 130 versus 90 in the HLV configuration. This trend is similar to that which is observed in Veitch et al. (2012), contrasting the originally proposed four-detector configuration (with two co-located Hanford detectors) to the HLVI configuration.
4. CREDIBLE INTERVALS
When quoting parameter estimation results, it is often convenient to reduce the full parameter space to credible intervals about single marginalized parameters. To that end, we state the averaged 68% and 95% credible intervals about the single parameters for each of the three parameter pairs of interest. These were already plotted for the sky locations in Figures 6 and 7.
There are several different ways of computing the width of a credible interval in this setup. If one considers the points in the MCMC as random draws from the true posterior, then the α-level credible interval can be computed by simply ordering the points, removing N(1 − α)/2 points from both sides of the posterior samples symmetrically, and measuring the width of the remaining points. While this procedure can prove hazardous for multi-modal distributions, it is straightforward and reliable for single-peaked distributions as reported here.
In Table 1, we list the mean 68% and 95% credible intervals recovered for the four mass configurations in both network configurations. This essentially quantifies the widths of the posteriors plotted throughout Section 3. The purpose of Tables 1 and 2 is to provide a quantitative and quotable source for studies seeking to determine how well a physical question about BNS systems can be answered with the Advanced LIGO/Virgo network.
Given the previous reliance of parameter estimation studies on the Fisher Information Matrix, it is informative to compare the credible intervals quoted here to previously reported values in the literature. We recompute the credible intervals of the chirp mass and the symmetric mass ratio ( ) at the 68% confidence level (1σ) for the 1.4 M☉/1.4 M☉ system presented here. We then compare the findings of the MCMC to the Fisher matrix predictions using an identical network configuration (HLV), noise curve, and waveform model. We compute the Fisher matrix uncertainties using a code previously described in Rodriguez et al. (2013). We find that the MCMC credible intervals can vary significantly from the estimates of the Fisher matrix, with the Fisher matrix underestimating the fractional uncertainties by as much as a factor of 2. See Table 3. This result agrees with the conventional wisdom surrounding the Fisher Matrix accuracy, as well as results where the Fisher Matrix is computed to higher order (Vitale & Zanolin 2010) This disagreement, while unsurprising, emphasizes the importance of employing the full parameter estimation machinery of an MCMC when making physically relevant claims.
Table 3. 68% Credible Intervals versus the 1σ Fisher Matrix Confidence Intervals for Mass Parameters in each System in the HLV Configuration
| Parameter |  |
Δη/η | ||
|---|---|---|---|---|
| Estimate | MCMC | FIM | MCMC | FIM |
| 1 M☉ − 1 M☉ | 0.00497% | 0.00396% | 0.645% | 0.704% |
| 1.4 M☉ − 1.4 M☉ | 0.00890% | 0.00743% | 0.745% | 0.866% |
| 1 M☉ − 2.5 M☉ | 0.0176% | 0.00880% | 1.475% | 0.862% |
| 2.5 M☉ − 2.5 M☉ | 0.0245% | 0.0221% | 1.000% | 1.299% |
Download table as: ASCIITypeset image
5. CONCLUSION
In this paper, we performed an MCMC parameter estimation analysis on the recoverability of basic information about BNSs, using two projected versions of the Advanced LIGO/Virgo network. We focused on the recovery of the two masses, the luminosity distance, orbital inclination, and the sky location, as these are the six basic parameters of physical interest to the problem. The signals were injected at a high, but not unrealistic, S/N = 20 in order to create a reference similar to those found in previous Fisher Matrix studies while remaining in a regime where the "n(t) = 0 as average" simplification is justified. The simulated signals comprehensively covered sky-location, orientation, component mass, and mass ratios for plausible BNS systems, while neglecting spin, corrections due to finite size effects, orbital eccentricity, and other higher-order modifications to the GW signal.
Despite the high S/N of our simulated signals, Fisher matrix results are not adequate to characterize the parameter estimation capabilities of advanced detectors. The Fisher matrix approximation assumes the likelihood distribution is a multivariate Gaussian. In contrast, using MCMC to sample the posterior distribution function allows us to relax any assumptions about the functional form of the posterior (apart from the implicit dependence on templates and the PSD common to any similar study). Given the highly non-Gaussian nature of the recovered posteriors, even in the absence of a simulated noise realization (see Figures 1, 2, and 4–7), we conclude that it is critical for a complete understanding of the GW BNS parameter estimation problem to use Bayesian sampling techniques.
The quantitative results reported here represent the average statistical error for S/N = 20 detections—"loud" but not unrealistic for Advanced LIGO/Virgo observations—assuming well-modeled waveforms and detectors which achieve their design sensitivity. For the mass parameters we found that by neglecting the effects of spin, the component masses can be constrained to within 9% (15%) of their true value to a credible level of 68% (95%) for systems with equal-mass neutron stars. This value drops below 1.9% (3.7%) for systems with an asymmetric masses. It was also found that the fractional uncertainties for equal-mass binary systems are similar at equal S/N. Only when the masses are unequal are the fractional errors effected. These results were summarized in Table 1. Our study is the first to comprehensively quantify neutron star mass measurements in the Advanced LIGO/VIRGO network via an MCMC for a range of component masses and mass ratios.
We also reported on the ability of the two network configurations to constrain the luminosity distance and orbital inclination. For distance, it was found that the uncertainties will average anywhere from 43 to 120 MPC at 68% credible levels, and from 76 to 213 MPC at 96% credible levels, making the uncertainties larger than the luminosity distances themselves in many cases. Furthermore, it was found that the cosine of the orbital inclination can be constrained to within 0.35 (0.61) at the 68% (95%) level on average, suggesting that the Advanced LIGO/Virgo network will not be able to offer constraining information on GRB beaming angles in coincidence with electromagnetic observations. Coincidence detections will still be possible, but the orbital orientation information from GWs will not provide astrophysically relevant constraints.
Finally, we reported the ability of advanced networks to constrain the sky location of strong BNS signals. It was found that the three-detector configuration, consisting of the Washington and Louisiana LIGO sites plus the Italian Virgo site, was able to constrain all signals within 64 deg2 (136 deg2) on the sky at the 68% (95%) credible level, with an average median 68% (95%) credible interval of 4.6 deg2 (12.2 deg2). Meanwhile, the four-detector configuration, consisting of the three-detector sites plus a LIGO India detector, was able to localize all the sky locations to within 14 deg2 (45 deg2) on the sky at the 68% (95%) credible interval, with an average median 68% (95%) credible interval of 2 deg2 (5.3 deg2). These high-S/N results were then compared to similar results for a more realistic source distribution from Nissanke et al. (2013).
It should be noted that there are two distinct types of systematic error, highly relevant to the GW parameter estimation problem, that we have not addressed in this study. First, we have studied the parameter estimation uncertainties under the assumption that the waveform template we use to recover the signal template exactly matches the fully relativistic waveforms nature provides. In practice, these waveforms are only approximations to the fully general relativistic physics required to solve the problem. See Buonanno et al. (2009) for a better description of the systematic uncertainties present in the most common waveform families. Additionally, there are several astrophysical assumptions that can potentially contribute to systematic uncertainties in the waveforms, such as the neutron-star equation of state, possible modifications to general relativity, eccentricity, etc.
Second, we have performed our study under idealized detector-noise conditions. In practice the noise levels of Advanced LIGO and Advanced Virgo can vary with time and contain occasional excursions which are highly non-Gaussian. Unfortunately, there is no reliable way to predict the sort of non-Gaussian detector glitches and instrumentation effects that will arise in any advanced GW detector. The realization of noise will be a major factor in the deflection of signal PDFs from the idealized cases presented here.
In this study, we have also neglected the effects of spin in the parameter space, electing to focus on the absolute basic parameters that will be measured routinely in the Advanced Detector era. Given the high degree of coupling between the spin and mass of objects in the GW parameter space, it remains unclear if the mass measurement alone will be sufficient to distinguish non-spinning neutron stars from highly-spinning low-mass black holes. Future work will explore this potential mass/spin degeneracy, including the effects of orbital precession, with the aim of definitively answering this question.
The authors thank Samaya Nissanke, John Veitch, and Neil Cornish for useful discussions. We also thank Samaya Nissanke for the 95% credible regions quoted in Figure 8. C.R. and B.F. were supported by NSF GRFP Fellowships, award DGE-0824162. All authors were also partially or fully supported by NSF Gravitational Physics grant PHY-0969820, PI: V.K. Lastly, V.K. is grateful to the hospitality of the Aspen Center for Physics while she worked on this study.
APPENDIX A: MARKOV CHAIN MONTE CARLO
The MCMC sampler included in LALInference employs a Metropolis–Hastings sampling algorithm, which is described as follows.
- 1.Pick an initial point in the parameter space (), and then propose a random "jump" to a new set of waveform parameters, . The jump follows the proposal distribution .
- 2.
- 3.Accept the new parameters with probabilityIf the new parameters are accepted, record and repeat with ; otherwise, record , and repeat.


The above procedure is designed to record a chain of samples whose distribution is  . By drawing a sufficient (∼1000) number of effectively independent samples from the posterior, the chains traces out the functional form of the posterior, gathering more samples from regions with high posterior probability density. Depending on the proposal distribution, q, the convergence (mixing) of the chain may be rapid or slow. We employ multiple optimization techniques, including both specially crafted jump proposals (q) and parallel tempering, to ensure adequate mixing of the Markov Chains throughout our parameter space. Both samplers were tuned and developed during the last science run of the Initial LIGO/Virgo network. A description of the parameter estimation capabilities of these two samplers with respect to real interferometer data, as well as a more detailed description of the algorithms and checks for convergence, can be found in Aasi et al. (2013).
APPENDIX B: GRAVITATIONAL-WAVEFORM MODEL
We use a frequency-domain waveform accurate up to 3.5 pN order in phase and 3 pN order in amplitude of the lowest (l = m = 2) spatial mode. We restrict ourselves to quasi-circular, non-spinning waveforms as a simplifying assumption. The standard form of our waveform model, known as the TaylorF2 approximant, is calculated via the stationary-phase approximation. In this setup, the GW amplitude is given by

where a(tf) is the amplitude evaluated at a stationary-phase reference point, which to lowest order takes the form  , where D is the luminosity distance of the binary, and ψ(f) is the pN phase. Θ(angle) is a function of the orbital orientation with respect to the detector network in terms of the sky position, orbital inclination, and the wave polarization. In addition to the total mass, Mtot ≡ M1 + M2, it is convenient to work with the mass ratio and chirp mass, defined in Equation (5). Note that most GW literature instead uses the symmetric mass ratio, defined as η ≡ M1M2/M2. We elect to use q as it is more physically intuitive, and because it avoids an integrable singularity that can appear for equal-mass systems when employing a prior on p(η). By convention, M1 ⩾ M2. The stationary phase then becomes an expansion in the Newtonian orbital velocity, v = (πMtotf)1/3,

where the αk coefficients are taken from the pN expansion to order n/2. See Buonanno et al. (2009) for a description and comparison of different waveform families. The terms tc and ϕ0 in Equation (B2) are constants of integration, referred to as the chirp time and coalescence phase, respectively.
APPENDIX C: ZERO-NOISE VERSUS VARIED NOISE REALIZATIONS
We have performed the current analysis on zero-noise injections for two reasons. First, the results of a zero-noise analysis are similar to those that would be achieved by averaging the results of multiple identical injections in different Gaussian noise realizations. For a unique Gaussian realization of the Advanced LIGO noise curve, the realization causes the maximum likelihood of the posterior probability distribution to be translated away from the true value. These displacements tend cancel in the frequentist average over noise realizations, ensuring that the mean uncertainties should be nearly identical to the uncertainty drawn from the zero-noise runs. This can be seen in Vallisneri (2008), Equations (73) and (74). By expanding the posterior mean and the posterior variance as a series in 1/S/N, it can be seen that the n(t) = 0 posterior mean is identical to the frequentist average over noise realizations of the posterior mean to first order in 1/S/N. In similar fashion, the n(t) = 0 posterior variance is identical to the noise-realization frequentist average up to third order in 1/S/N. As the current study operates in a high-S/N regime, the zero-noise averages (particularly the averages of the posterior variances) are assumed to be valid.
Previous studies have both employed and studied in detail the consequences of this approach. In particular, Nissanke et al. (2010) demonstrated that the n(t) = 0 posterior is equal to the geometric mean over specific noise realizations of the posterior, while Sampson et al. (2013) performed a numerical experiment to demonstrate the validity of the assumption. We perform a similar numerical experiment here in which we demonstrate that the uncertainties from a n(t) = 0 posterior are equivalent to the frequentist average over uncertainties from multiple noise realizations. We injected a single 1 M☉/2.5 M☉ system, detected in HLVI, into five separate realizations of Gaussian noise colored by the Advanced LIGO PSD, and compared the results to the same MCMC recovery in the zero-noise case. This example can be seen for 1D marginalizations of  and q in Figure 9. In effect, the "real answer" that will be recovered is a single PDF with similar width to the zero-noise PDF, but with the peak likelihood displaced from the true value.

Figure 9. Effects of a non-zero noise realization on the recovered PDF for five different Gaussian realizations of the Advanced LIGO noise curve. Each blue-dashed PDF represents the recovery of the same 1 M☉/2.5 M☉ signal in a different noise curve, picked at random from the Gaussian colored noise defined by the Advanced LIGO power spectral density, while the gray-shaded curve is the zero-noise PDF. Notice how each curve is a Gaussian PDF with different mean but similar width from the zero-noise PDF. This is to be expected as the zero-noise mean is identical to the average to first order in 1/S/N, while the zero-noise standard deviation is identical to the average standard-deviation up to 1/S/N3. This only holds true for glitch-free data, which is an unrealistic idealization when compared to real data.
Download figure:
Standard image High-resolution image
Of course, this also relies on the assumption that the detector noise is Gaussian. This is the second reason for employing the zero-noise approximation: it is not feasible to predict the characteristics of realistic advanced detector noise. While we can simulate a simple non-Gaussian excursion or errors in PSD estimation, there is an infinite set of possibilities and picking any one is too speculative prior to the advanced detectors are completed and collecting data. However, as the current study is focused on the average uncertainties and not the systematics of a single event (for which we must await a true detection), we feel the n = 0 method most adequately satisfies requests from the community for quotable "rule-of-thumb" estimates.
Techniques which build off of the theoretical progress made in Allen et al. (2003), Rover (2011), and Littenberg & Cornish (2010) for including glitches in the model for the data, and therefore relaxing the assumptions about stationary and Gaussian noise, are currently under investigation.