


ABSTRACT
The formation mechanism of the jet-aligned CO clouds found by NANTEN CO observations is studied by magnetohydrodynamical (MHD) simulations taking into account the cooling of the interstellar medium. Motivated by the association of the CO clouds with the enhancement of H i gas density, we carried out MHD simulations of the propagation of a supersonic jet injected into the dense H i gas. We found that the H i gas compressed by the bow shock ahead of the jet is cooled down by growth of the cooling instability triggered by the density enhancement. As a result, a cold dense sheath is formed around the interface between the jet and the H i gas. The radial speed of the cold, dense gas in the sheath is a few km s−1 almost independent of the jet speed. Molecular clouds can be formed in this region. Since the dense sheath wrapping the jet reflects waves generated in the cocoon, the jet is strongly perturbed by the vortices of the warm gas in the cocoon, which breaks up the jet and forms a secondary shock in the H i-cavity drilled by the jet. The particle acceleration at the shock can be the origin of radio and X-ray filaments observed near the eastern edge of the W50 nebula surrounding the galactic jet source SS433.
Export citation and abstract BibTeX RIS
1. INTRODUCTION
Detailed analysis of the NANTEN 12CO (J = 1–0) survey of galactic molecular gas revealed that molecular clouds are aligned with the jet ejected from the galactic jet source SS433 (Yamamoto et al. 2008). They locate along the extension of the major axis of the asymmetric radio nebula W50 (e.g., Dubner et al. 1998) and bipolar X-ray jets (Yamauchi et al. 1994; Safi-Harb & Oegelman 1997). The association of the H i density enhancement with molecular clouds indicates that the interaction of the jet and the H i cloud triggered the formation of the jet-aligned molecular clouds (Yamamoto et al. 2008).
The interaction of astrophysical jets with the ambient interstellar medium (ISM) has been studied extensively by hydrodynamic and magnetohydrodynamic (MHD) simulations. By carrying out axisymmetric, two-dimensional (2D) hydrodynamic simulations, Norman et al. (1982) revealed basic structures of a supersonic jet consisting of a bow shock, cocoon, and working surface. Subsequently, axisymmetric 2D MHD simulations of jet propagation were carried out (e.g., Clarke et al. 1986; Lind et al. 1989; Kössl et al. 1990; Todo et al. 1992). Todo et al. (1993) reported the results of three-dimensional (3D) MHD simulations of a jet interacting with a dense gas cloud. However, radiative cooling was not included in these simulations.
Blondin et al. (1989) carried out axisymmetric 2D hydrodynamical simulations of supersonic jets including radiative cooling and found that in the parameter range appropriate for protostellar jets (jet temperature is 104 K and jet number density is 20 cm−3), a dense, cold shell condenses out of the shocked gas at the head of the jet because shock compression increases the density, and cooling rate. Blondin et al. (1990) showed that when the jet density is smaller than the ambient density, the leading edge of the jet closely follows the contours of the cocoon because radiative cooling decreases the thermal pressure of the shocked ambient gas behind the bow shock (see also Stone & Norman 1993). Frank et al. (1998) and Stone & Hardee (2000) studied the effects of cooling on the propagation of magnetized protostellar jets by axisymmetric 2D MHD simulations. More recently, Teşileanu et al. (2008) reported the results of 2D MHD simulations of protostellar jets using a non-equilibrium, multispecies cooling function.
The SS433 jet differs from protostellar jets in its speed and density. The jet speed, 0.26c (see review by Margon 1984), is much faster than protostellar jets. The jet temperature exceeds 108 K near the central object but decreases to 105 K within 1012 cm from the central object (Brinkmann et al. 1991). X-ray observations around the eastern edge of W50 (Brinkmann et al. 2007) indicate that the temperature of the X-ray emitting plasma is 0.3 keV. The heating source of the region can be the internal shock of the jet, which partially dissipates the kinetic energy of the jet.
Figure 1 schematically shows how the SS433 jet creates molecular clouds. When the jet propagates in the warm interstellar medium with number density 0.1 cm−3 and T ∼ 104 K, cooling is negligible behind the bow shock (the left panel of Figure 1). However, when the supersonic jet is injected into the H i cloud, the density of the shock-compressed H i gas exceeds the threshold for the onset of the cooling instability (the right panel of Figure 1). When the cooling instability is triggered and temperature decreases, the density increases further. This mechanism is similar to that of formation of dense molecular gas by shock compression of the ISM (e.g., Fragile et al. 2004; Inoue et al. 2006, 2009). Molecular clouds can be formed around the surface of the H i-cavity drilled by the jet.
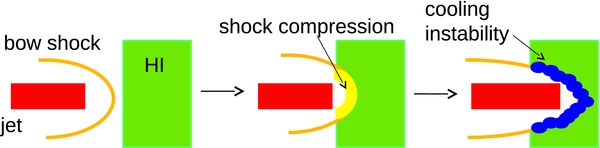
Figure 1. Schematic picture showing how cool dense clouds are formed in the interface between the supersonic jet and the H i cloud.
Download figure:
Standard image High-resolution imageIn this paper, we report the results of MHD simulations of jet propagation and interaction with an H i cloud including interstellar cooling. In Section 2, we present numerical models. Numerical results are presented in Section 3. Section 4 is for summary and discussion.
2. NUMERICAL MODEL
We carried out MHD simulations of jet propagation in a cylindrical coordinate (r, ϕ, z). We assume axisymmetry, but include the ϕ-component of velocity and magnetic field. The basic equations of ideal MHD are
where  are density, velocity, pressure, and magnetic field, respectively, and
is the energy density of the gas. In the right hand side of the energy Equation (3), L is the cooling function. We neglect thermal conduction, so that sharp temperature gradient can be preserved. These equations are solved numerically by applying the HLLD scheme (Miyoshi & Kusano 2005). HLLD scheme is a finite volume method to solve the magnetohydrodynamic equations in the conservation form, in which a Riemann problem at the cell interface is solved approximately by considering four intermediate states divided by two fast waves, two Alfvén waves, and one entropy wave. The HLLD scheme gives more accurate, less diffusive solutions than the HLL scheme (Harten et al. 1983) which takes into account only fast waves. Since the computational cost of the HLLD scheme is much less than the exact Riemann solver, and more easy to implement than other approximate Riemann solvers such as the Roe scheme (Roe 1981), the HLLD scheme is widely used in magnetohydrodynamic simulations of astrophysical phenomena. Second order accuracy in space is preserved by linearly interpolating the values at the cell interface, and restricting them using the minmod limiter. To satisfy the solenoidal condition  , we applied the generalized Lagrange multiplier (GLM) scheme proposed by Dedner et al. (2002). We incorporated the cooling term with time-implicit method.
Figure 2 shows the simulation model. The simulation domain is 0 ⩽ r ⩽ 200 pc and 0 ⩽ z ⩽ 100 pc. We apply free boundary condition at r = 200 pc and z = 100 pc and symmetrical boundary condition at r = 0 and z = 0. For adiabatic simulations, the number of grid points is (Nr, Nz) = (500, 1920). We used a uniform grid in z-direction. In the radial direction, uniform grid with mesh size 0.054 pc is used in 0 ⩽ r ⩽ 15 pc, so that the jet radius (rj = 1 pc) is resolved with 19 cells. In r ⩾ 15 pc, we increased the grid spacing with radius to avoid reflection at the outer radial boundary. For simulations including the cooling, we used twice as many grid points, (Nr, Nz) = (900, 3820), to resolve the thin, cold, dense region surrounding the jet.
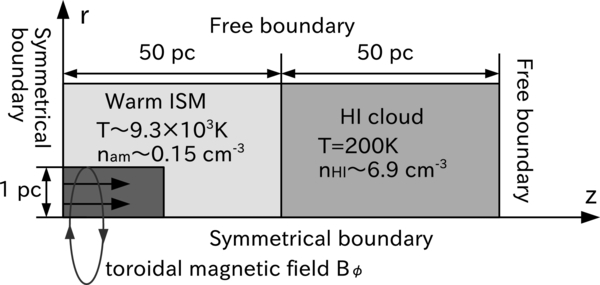
Figure 2. Simulation model. The simulation region is filled with the warm interstellar gas in 0 ⩽ z ⩽ 50 pc and H i gas in 50 pc ⩽ z ⩽ 100 pc. Supersonic, hot jet is injected in 0 ⩽ r ⩽ 1 pc and at z = 0.
Download figure:
Standard image High-resolution imageAt the initial state, the H i gas (T ∼ 200 K) is assumed to be in pressure equilibrium with the warm interstellar gas (T ∼ 104 K) at z = 50 pc. We assume that the H i gas and the warm interstellar gas are not magnetized at the initial state. The number density of the ambient medium and H i cloud are namb = 0.15 cm−3 and nHI ∼ 6.9 cm−3, respectively. The initial density and temperature of the ISM are chosen such that they satisfy the thermal equilibrium condition ρL = 0. We adopt the cooling function,

where Γ and Λ are the heating rate and cooling rate, respectively. They have the same form as those used by Inoue et al. (2006) but we modified it by cutting off the cooling in hot region where T > 14, 000 K and adjusting the last term in Equation (8) such that the equilibrium temperature is 200 K when n = nHi. We reduced the cooling rate when T > 104 K so that the jet stays in the hot (Tjet ∼ 105 K), low density (njet < 0.1 cm−3) state.
Figure 3 shows the thermal equilibrium curves of the cooling function (Γ = nΛ in Equation (6)) adopted in this paper. The upper branch appears because we cut off the cooling for high temperature plasma. The lower branch has thermally stable branches (solid curve) and an unstable branch (dashed curve) connecting stable branches.

Figure 3. Thermal equilibrium curve for the cooling function adopted in this paper. The horizontal axis is the number density and the vertical axis is the pressure. Dashed curve indicates the unstable branch.
Download figure:
Standard image High-resolution imageWe inject a weakly magnetized jet from the injection region at z = 0 and 0 < r < rjet = 1 pc. The number density and temperature of the injected plasma in a canonical model are njet ∼ 0.015 cm−3 = 0.1namb and Tjet = 105 K, respectively. The injection speed of the jet vjet is chosen to be much smaller than that of the subrelativistic jet speed in SS433 (vjet = 0.26c) because we have to deal with very high Mach number flows. Here the Mach number is defined as vjet/cs, jet, where cs, jet is the sound speed in the jet. When we numerically solve the conservation form of energy equation to handle strong shocks, numerical accuracy of gas pressure degrades in high Mach number flows because gas pressure is derived by subtracting kinetic energy from the total energy. Therefore, we carry out simulations for flows with Mach number less than 20. Still, we can study the propagation of supersonic jet, in which the dynamical pressure  much exceeds the thermal pressure of ambient medium. We study the dependence of numerical results on vjet, and extrapolate the results to extremely high Mach number flows.
Table 1 shows the model parameters. MA6 is a model without cooling. Other models are models with cooling. For model MA6, MC6, and MC19H, the mass flux of the jet  is chosen to be comparable to that of SS433 (
 ). The jet speed for models MC3, MC6 and MC12 (Mach 3, 6, and 12) are vjet = 110 km s−1, 220 km s−1, and 440 km s−1. MC6H and MC19H are models with higher jet temperature (Tjet ∼ 106 K) with cooling. The jet speed for models MC6H and MC19H are vjet ∼ 680 km s−1 and 2200 km s−1, respectively. For magnetic fields, we assume that the jet is injected with purely toroidal magnetic field Bϕ∝sin 4(2πr/rjet). We assumed Pgas/Pmag = 100 at r = 0.5 pc. In pointing flux dominated jets, it is possible that Pmag exceeds Pgas. However, we assumed weakly magnetized jets to study how the magnetic fields are amplified during the propagation of the jet, and by cooling. The effects of strong toroidal magnetic fields on the stability of the jet will be studied in subsequent papers by 3D magnetohydrodynamic simulations including cooling.
Table 1. Model Parameters
| Model | Cooling | vjet | njet | Tjet |  |
Resolution |
|---|---|---|---|---|---|---|
| (km s−1) | (cm−3) | (K) | (g s−1) | |||
| MA6 | No | 220 | 1.5 × 10⁻² | 9.3 × 10⁴ | 1.5 × 10¹⁹ | 500 × 1960 |
| MC3 | Yes | 110 | 1.5 × 10⁻² | 9.3 × 10⁴ | 7.3 × 10¹⁸ | 900 × 3920 |
| MC6 | Yes | 220 | 1.5 × 10⁻² | 9.3 × 10⁴ | 1.5 × 10¹⁹ | 900 × 3920 |
| MC6H | Yes | 680 | 1.5 × 10⁻³ | 9.3 × 10⁵ | 4.7 × 10¹⁸ | 900 × 3920 |
| MC12 | Yes | 440 | 1.5 × 10⁻² | 9.3 × 10⁴ | 2.9 × 10¹⁹ | 900 × 3920 |
| MC19H | Yes | 2200 | 1.5 × 10⁻³ | 9.3 × 10⁵ | 1.5 × 10¹⁹ | 900 × 3920 |
Download table as: ASCIITypeset image
3. NUMERICAL RESULTS
3.1. Formation of Cold, Dense Sheath in Simulations with Cooling
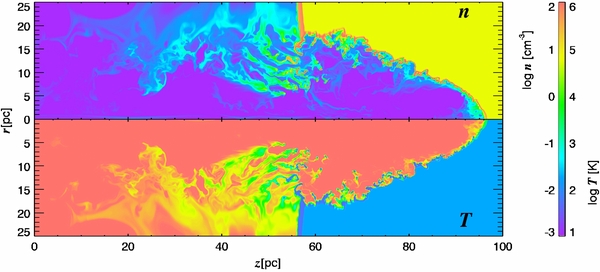
Figure 4 shows the results of numerical simulation without cooling (model MA6) and with cooling (model MC6). Color shows the distribution of density and temperature. Figure 4(a) shows results of an adiabatic MHD simulation. Low density, hot jet (T = 105 K) propagating in the warm interstellar gas collides with the H i cloud at z = 50 pc. The jet forms a bow shock, a jet terminal shock, and internal shocks. The H i gas flowing in through the bow shock is compressed, and heated up. The temperature and density of the H i gas increase to T ∼ 500 K and n ∼ 20 cm−3, respectively. The jet gas between the jet terminal shock and the contact discontinuity separating the jet and ambient medium, is heated up to T ∼ 106 K and the velocity along the jet axis reverses, forming a hot, low density backflow wrapping the jet (cocoon). The Kelvin–Helmholtz instability grows between the cocoon and interstellar medium by their velocity shear. These structures are common to those in conventional simulations (e.g., Norman et al. 1982).
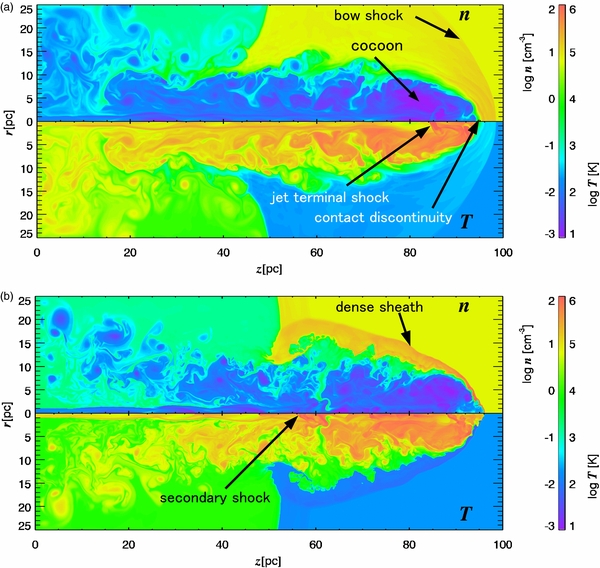
Figure 4. Density and temperature distribution. Results for (a) MA6 and (b) MC6 at t = 14.7 Myr.
Download figure:
Standard image High-resolution imageFigure 4(b) shows results of MHD simulations including cooling. Before collision, the jet structures are the same as those of adiabatic simulations since we cut off the cooling in the jet. After collision the H i gas inflowing through the bow shock is compressed. Subsequently, the H i gas is cooled down by the cooling instability because cooling rate increases by enhanced density, and forms cool, dense region behind the bow shock. The bow shock and the shock compressed region in adiabatic simulations are converted to this cold dense sheath. As shown in Figure 4, the jet is heated up to T ∼ 106 K by the internal shock and the jet terminal shock. In the cold sheath surrounding the jet, the density and temperature are about 30 cm−3 and 100 K, respectively. This sheath is thinner in the jet head than in sides of the jet. Molecular gas can be formed in these cold, dense regions.
Numerical results indicate that secondary shock appears around z = 55 pc at t = 14.7 Myr in the model with cooling (see the bottom panel in Figure 4). The shock appears more clearly in the velocity distribution displayed in top panels of Figure 5. The color shows the velocity component parallel to the jet axis, and arrows show velocity vectors. The jet corresponds to the beam in the region r < 1 pc where vz = 220 km s−1. The velocity reverses in the cocoon, and forms a backflow with speed vz ∼ −50 km s−1. Black contours show the isocontours of the radial velocity in the dense sheath where n > 10 cm−3. We found that the jet is disrupted at t = 10.9 Myr around z = 55 pc. The disruption takes place because the dense sheath wrapping the cocoon reflects waves generated in the H i cavity drilled by the jet. Since the vortices created in the cocoon are confined by the sheath, they strongly perturb the jet and block its propagation. The formation of the dense sheath results in the disruption of the jet. The top right panel of Figure 5 shows that the jet beam in the HI-cavity is recovered at t = 14.7 Myr but this beam is disconnected from the beam connecting the jet source and the initial surface of the H i cloud.

Figure 5. Top panel shows the vz distribution (color) and radial velocity vr = 0.5, 1.0 km s−1 of the dense sheath where n > 10 cm−3 (black contours) and velocity (arrows) for an MHD model with cooling at 10.9 Myr (top left) and 14.7 Myr (top right). The bottom panel shows the distribution of the toroidal magnetic field at t = 14.7 Myr for MHD simulations including the cooling.
Download figure:
Standard image High-resolution imageThe toroidal magnetic field between the terminal shock and the bow shock becomes several times stronger than that before crossing the shock. After the jet collides with the H i gas, the magnetic field is stored between the cocoon and the sheath and becomes about 10 times stronger than that injected into the simulation region at z = 0 (the bottom panel in Figure 5).
Figure 6 shows the distribution of the mean radial velocity vr and vz in the dense sheath (n > 7 cm−3) for model MC6. In the region around the head of the jet, the cold dense sheath moves along the jet axis with velocity vz ∼ 3 km s−1. This is the speed of the working surface of the jet, which can be computed by dividing the distance the jet propagates in the H i layer (50 pc) by the jet crossing time 14.7 Myr. The radial velocity at the jet head, vr ∼ 1.5 km s−1 is about half of the speed of the working surface. On the other hand, on the sides of the jet, the sheath expands mainly in the radial direction with speed vr = 0.5–1 km s−1. The radial velocity is nearly constant when z > 60 pc except the region near the head of the jet, where vr ∼ 1.5 km s−1.

Figure 6. Distribution of mean velocity of high density region (n > 7 cm−3) for MC6. Solid and dashed curves show the radial velocity and the velocity along the jet, respectively.
Download figure:
Standard image High-resolution imageFigure 7 shows the column number density obtained by assuming that the H i cloud is a cylinder with radius 50 pc. The column number density is about 1021.5 cm−2 in the dense sheath formed around the jet-cloud interface. Figure 8 shows the column number density of H2 when we assume solar abundance and neglect background UV radiation (e.g., Richings et al. 2014). The column number density ∼1021 cm−2 in the dense sheath is consistent with the H2 column number density of molecular clouds aligned with the SS433 jet (see Table 1 in Yamamoto et al. 2008). We can obtain the CO intensity from the column number density of H2 by using the X factor for typical molecular clouds in the Galactic plane, N(H2)/W(12CO) = 2.0 × 1020 cm−2/(K km s−1) (Lebrun et al. 1983; Bertsch et al. 1993). The CO intensity 1–10 K km s−1 obtained from our numerical simulation is also consistent with the CO intensity 4–10 K km s−1 obtained by observations.
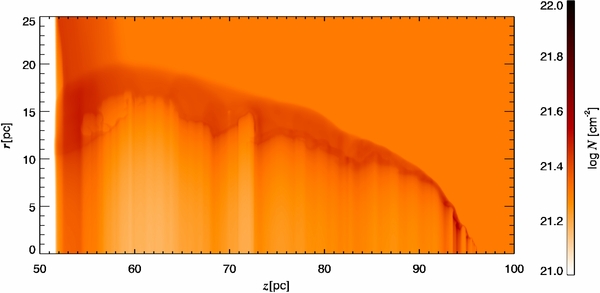
Figure 7. Column number density for MC6 at t = 14.7 Myr.
Download figure:
Standard image High-resolution image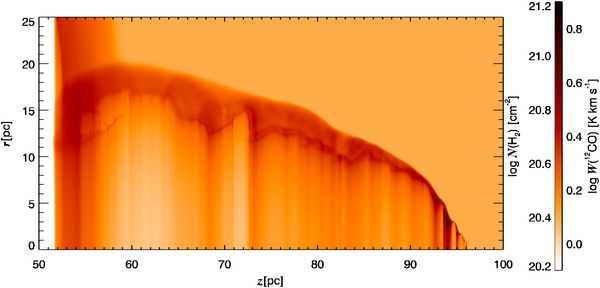
Figure 8. Column number density of H2 and the CO intensity for MC6 at t = 14.7 Myr.
Download figure:
Standard image High-resolution imageFigure 9 shows the density and temperature distribution for the high temperature jet model MC6H, in which the temperature of the jet at the injection point is Tjet = 106 K. The propagation of the working surface of the jet and the shape of the dense sheath are similar to those for model MC6, in which Tjet = 105 K. This is because the kinetic energy of the jet,  , is the same for both models. It indicates that when the kinetic energy of the light jet (ρjet < ρambient) is the same, the dynamics of the jet and the dense sheath do not depend significantly on vjet and the jet temperature (or the cooling function of the jet plasma).

Figure 9. Density and temperature distribution for MC6H at t = 14.7 Myr.
Download figure:
Standard image High-resolution image3.2. Dependence on the Beam Velocity
In this subsection we show the dependence of numerical results on the beam velocity. Figure 10(a) shows results for a model with slower beam speed (MC3). For MC3 the speed of the jet working surface is vws = 1.8 km s−1, which is about half of that for model MC6. Since the velocity of the beam and the kinetic energy of the jet are smaller than that of MC6, the velocity of the backflow decreases. Since the cocoon becomes more turbulent when the backflow is slow, the beam tends to be disrupted and does not extend to the jet head. The growth of the KH instability is observed in the region z > 60 pc. Similarly to model MC6, shock compression of the H i gas triggers the cooling instability which forms dense cold sheath surrounding the jet. The width of the sheath in the jet sides is larger than that of model MC6 because the jet propagation takes longer time, and the radial expansion speed of the dense sheath region is almost the same for both models.
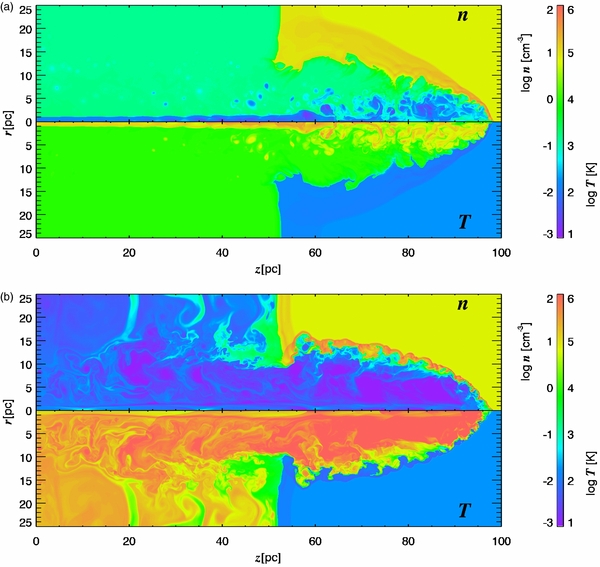
Figure 10. Density and temperature distribution for (a) MC3 at t = 27.1 Myr and (b) MC12 at t = 5.84 Myr.
Download figure:
Standard image High-resolution imageFigure 10(b) shows results for the Mach 12 jet (MC12). The speed of the jet working surface is 8 km s−1. The faster backflow formed by the faster beam makes the cocoon more stable. The sheath around the sides of the jet is thinner than other models because the propagation time of the jet is shorter.
Let us compare the physical parameters of the SS433 jet with those of our model. The jet speed vjet ∼ 220 km s−1 adopted in model MC6 is much slower than 0.26c measured by Doppler shifts of the line emission from the SS433 jet (Margon & Anderson 1989). We adopted smaller jet speed in our simulations to avoid numerical instabilities in high Mach number flows. The crossing time of the working surface ahead of the jet across the H i cloud with size 50 pc can be obtained by dividing this size with the speed of the working surface vws. When the jet with speed vjet = 0.26c is injected into the H i cloud, the balance of the dynamical pressure of the jet and the ambient medium with density ρa gives (e.g., Todo et al. 1992)

where ρjet is jet density and rjet and rws are the width of the jet and working surface, respectively. Here we assumed vjet ≫ vws. By using the mass flux of the jet  and combining this equation with Equation (9), we obtain

When vjet = 0.26c,  (Marshall et al. 2002), ρa = 3 × 10⁻²⁵ g cm−3 and rws = 4 pc, we obtain vws = 50 km s−1. This speed is 20 times faster than the speed of the working surface in our simulations (model MC6) because vjet = 0.26c is 400 times faster than vjet = 220 km s−1 in model MC6. The crossing time of the working surface across the H i cloud is 106 yr when vws = 50 km s−1.
Figure 11 shows the mean radial velocity for MC3, MC6, and MC12 measured at different times, t = 27.1, 14.7, and 5.84 Myr, respectively. The radial velocity at the jet head is about half of the speed of the working surface of the jet. The radial expansion speed of the dense sheath increases with the jet speed.
Figure 11. Mean radial velocity of high density region (n > 7 cm−3). Solid, dashed, and dotted curves show results for MC3, MC6 and MC12, respectively.
Download figure:
Standard image High-resolution imageFigure 12 shows the time evolution of the mean radial velocity at z = 65 pc.

Figure 12. Time evolution of mean radial velocity at z = 65 pc for model MC3 (solid curve), MC6 (dashed curve), and MC12 (dotted curve).
Download figure:
Standard image High-resolution imageWe can estimate the radial velocity of the dense gas at the sheath from the following argument. We assume the shape of the sheath to be a hollow cylinder whose inner and outer radius, density, and radial velocity at t = t0 are ri, ro, ρ, and vr, respectively. We denote those at t = t' as  , and
, and  . Mass conservation and momentum conservation equations are


Solving for  , we obtain
Substituting  into Equation (13) and integrating it, we obtain
where

If the H i gas pushed radially outward by the jet expands only in the radial direction, mass conservation equation is

Substituting Equation (16) into Equation (15), we obtain A = 1. Therefore, from Equation (14),
and
Figure 13 shows the time evolution of  for initial radial velocities vr = 2, 20, 200 km s−1. The radial velocity becomes a few km s−1 at t ∼ 10 Myr even if it is initially 200 km s−1. This radial velocity is consistent with the observed velocity 2–5 km s−1 derived from the line width ΔV of the composite spectrum of the molecular clouds aligned with the SS433 jet and VLSR reported in Table 1 in Yamamoto et al. (2008).

Figure 13. Time evolution of the radial velocity for initial radial velocities 2 km s−1 (solid curve), 20 km s−1 (dashed curve), and 200 km s−1 (dotted curve).
Download figure:
Standard image High-resolution imageFor all models, the shape of the interface between the cocoon and the dense sheath is similar. We can determine its shape using Equation (17) as

where we rewrite  to r and ro to ri and ignore the second term in Equation (17). Here, t0 is the time when the jet head passes. The position of the jet head can be evaluated by using Equation (9) as


Eliminating t0 from Equation (20) and Equation (21), the radius of the interface can be obtained as a function of r, z, t as
Assuming vr = Cvjet (C is constant),
When vjett is the same, the shape of the interface is the same even if vjet is different. In Figure 14, color shows the result for MC6 at t = 14.7 Myr and black curve shows the interface determined from Equation (23) when ri = 7.4 pc, rws = 3.15 pc, C = 10−2, and t = 13.0 Myr. Here t = 13.0 Myr is the time since the jet head collides with the H i cloud.

Figure 14. Density distribution for MC6. The black curve shows the location of the interface estimated by Equation (23) in the text.
Download figure:
Standard image High-resolution imageFigure 15 shows the time evolution of the total mass of the cold, dense sheath. When the beam velocity is high, the total mass increases since the region where the number density is larger than 20 cm−3 increases. The total mass of the H i gas swept by the bow shock limit the maximum total mass. When the swept up H i gas is originally located in a cylinder whose radius and length are  and
and  , respectively, we can estimate the maximum total mass

where M☉ is the solar mass. For MC12, substituting  and
and  to Equation (16), we get Mmax ∼ 4000 M☉. Figure 15 shows that the total mass of the sheath is about 3200 M☉ which is close to Mmax. Further increase of the beam velocity does not affect the total mass of the cold, dense gas.
Figure 15. Evolution of the total mass of the high density gas (n > 20 cm−3). The horizontal axis is the position of the jet head.
Download figure:
Standard image High-resolution imageFigure 16 shows the result for a high Mach number model for which the mass flux of the jet is equal to that for model MC6. Since the kinetic energy of the jet is higher than that for model MC6, the cold dense sheath becomes thinner. This result is more similar to that for model MC12 than that for model MC6 since the kinetic energy of the jet is closer to that for model MC12.
Figure 16. Density and temperature distribution for MC19H at t = 3.53 Myr.
Download figure:
Standard image High-resolution image
4. SUMMARY AND DISCUSSION
We have shown by performing MHD simulations including interstellar cooling that cold dense sheath surrounding the jet is formed when the low-density, supersonic jet collides with the cool (T ∼ 200 K) H i cloud. The interaction of the jet with the H i cloud is essential for the transition of the shock compressed gas to the cold (T ∼ 10 K) state. The density and temperature of the cold, dense gas is comparable to those in molecular clouds. This mechanism can explain the origin of molecular clouds aligned with the X-ray jet of SS433 and their association with the H i cloud (Yamamoto et al. 2008). On the other hand, when the ambient medium is warm ISM with temperature T ∼ 104 K, the shock compressed ISM stays in the warm state with higher density.
Observations indicate that the integrated intensity of the H i cloud along the axis of the SS433 jet is about 800 K km s−1 (Yamamoto et al. 2008). The column number density estimated by using the conventional factor 1.8 × 1018 cm−2/(K km s−1) is 1.4 × 1021 cm−2. When the depth of the H i cloud is 50 pc, we can estimate the number density of the H i cloud to be 10 cm−3, which is comparable to that we assumed in our simulation.
The present numerical simulations have shown that the formation of the molecular clouds by the jet requires a timescale of 106 yr. This is much longer than the age of W50, 2 × 10⁴ yr, estimated by assuming that W50 is a supernova remnant (Geldzahler et al. 1980). Goodall et al. (2011) carried out hydrodynamical simulations of the SS433 jet and showed that the W50 radio shell is consistent with such a short timescale. We should, however, note an alternative mechanism that a radio shell like W50 is being formed by the winds from a supercritically accreting black hole with a mass accretion rate exceeding the Eddington limit. According to the radiation hydrodynamical simulations of supercritical black hole accretion (e.g., Kawashima et al. 2009), radiation pressure driven wind emanating from the accretion disk can inject energy of order 1038 erg s−1 for life time of the supercritical accretion. If the lifetime of SS433 is 106 yr, the energy supplied by the wind (∼1051 erg) is comparable to that by supernova explosion. Recently, asymmetric radio and X-ray bubbles similar to W50 are found around a microquasar S26 in NGC 7793 (Pakull et al. 2010; Soria et al. 2010) and an ultraluminous X-ray source (ULX) IC 342 X-1 (Cseh et al. 2012). They can be inflated by jets and outflows from a supercritically accreting black hole. Therefore, it is a viable alternative that W50 is a bubble which has been continuously driven by the winds from SS433 over the last 106 yr.
X-ray observations (Safi-Harb & Oegelman 1997; Brinkmann et al. 1996) and radio observations (Downes et al. 1981; Elston & Baum 1987) of W50 reported that X-ray and radio are strong near the eastern edge of W50 where the SS433 jet is drilling the H i cloud. Our numerical results indicate that the radio filament is not necessarily be the jet terminal shock at the leading edge of the jet but a secondary shock formed in the H i cavity (see the top left panel in Figure 5). The jet terminal shocks and jet internal shocks can produce synchrotron emitting relativistic electrons. In high Mach number jets such as MC19H, since the Mach number at the jet terminal shock and the jet internal shock can exceed 20, relativistic electrons can be produced quickly by the shock surfing mechanism with Buneman instability (Matsumoto et al. 2013). The relativistic electrons will be accelerated further by diffusive shock acceleration. Since the jet terminal shock near the leading edge of the jet is recovered from time to time, faint radio and X-ray emission may be detected in the H i-cavity if this region is observed with high sensitivity.
Let us discuss the effects of precession of the SS433 jet. The current precession period and the precession angle of the SS433 jet are 162 days and 20°, respectively. According to the 3D relativistic hydrodynamic simulations of the precessing jet (Monceau-Baroux et al. 2014), the helical jet beam behaves like a piston, which creates a bow shock in front of the jet head and the lower-density cocoon surrounding the beam. In their simulation, the width of the helical beam and the cocoon are 0.1 pc, and the size of the simulation region is (0.2 pc, 0.1 pc, 0.1 pc). Therefore, the whole precessing jet is contained in the jet injection region in our simulations shown in Figure 2. In our simulations, instead of resolving the precessing jet, which requires the time resolution of order 10 days, and spacial resolution of order 0.001 pc, we replaced it with the wider, lower density jet. Furthermore, the current precession angle (20°) is inconsistent with the elongated shape of the W50 nebula, indicating that the precession angle had to be smaller than the current angle when W50 was formed (Goodall et al. 2011).
In this paper, we neglected the cooling in the jet where n ∼ 0.01 cm−3 and T ∼ 105 K. If we take into account the cooling in the region where T > 104 K, the cooling timescale of the jet is the order of 0.1 Myr (e.g., Sutherland & Dopita 1993), Since the jet with vjet ∼ 200 km s−1 propagates about 20 pc in 0.1 Myr, the internal plasma of the jet can be heated up by internal shocks of the jet within this timescale. In our simulations in which the jet cooling is neglected, the temperature of the jet exceeds the original temperature (Tjet ∼ 105 K). We expect that even when the cooling in the hot plasma is taken into account, the jet temperature will stay 105 K < T < 106 K. In subsequent papers, we would like to confirm it by carrying out simulations including the cooling when T > 104 K and thermal conduction, which affects the thermal balance of the hot plasma.
In the jet head between the jet terminal shock and the contact discontinuity and in the backflow region (cocoon), the plasma temperature exceeds 106 K when the jet speed exceeds 200 km s−1. Since the cooling timescale of this region exceeds 10 Myr, cooling can be neglected.
The cooling timescale of the region between the contact discontinuity and the bow shock where n > 10 cm−3 is on the order of 104 yr. Therefore, this region cools down, and forms a dense, cold sheath.
The cooling timescale of the interface between the dense sheath and hot cocoon can be affected by the thermal conduction. However, since the width of this layer is thin except in models for low Mach number jets, cooling of the hot plasma does not change the shape of the interface in high Mach number jets.
Since the temperature of the shock compressed H i gas does not exceed 1000 K, the ionization rate will be negligible during the formation of the dense, cold sheath from the H i gas. Inside the jet and cocoon, hydrogen is almost fully ionized because T > 105 K. Moderately ionized region will appear in the interface between the hot cocoon and the dense sheath, where T ∼ 104 K. This region is formed by the compression of the warm interstellar medium by the bow shock of the jet. Since the ionization timescale near the shock front is about 0.1 Myr and the recombination timescale is about 10 Myr, the ionization rate will increase just behind the bow shock, and gradually decrease in the downflow (e.g., Koyama & Inutsuka 2000). Thus, the warm interstellar medium which has been ionized by the bow shock is kept partially ionized.
The mass of the jet-aligned molecular clouds estimated from CO observations is 400–2300 M☉ (Yamamoto et al. 2008). According to the result of our simulation, the total mass of the cold, dense sheath where the number density exceeds 20 cm−3 is ∼1200 M☉ for MC6, which is consistent with observations. The cold dense gas in the sheath expands in the radial direction with speed ∼1–2 km s−1. This expansion takes place because the shock heated hot (T ∼ 106 K) gas in the cocoon (backflow region) pushes the sheath in the radial direction. This expansion speed in our simulation is consistent with the speed of the molecular gas (2–5 km s−1) obtained from CO observations (Yamamoto et al. 2008).
The interface between the sheath and the backflow wiggles because the Kelvin–Helmholtz instability grows by the velocity shear between the sheath and the backflow. Since the toroidal magnetic field is accumulated in this boundary, this layer may subject to the interchange instability. Although magnetic fields along the jet axis are not amplified in axisymmetric simulations, they can be amplified if the radial components are generated by non-axisymmetric motions and stretched by the velocity shear around the interface. We need to carry out 3D MHD simulations to study the magnetic field amplification by these mechanisms and their effects on the structure and stability of the sheath. We would like to report the results of 3D MHD simulations in subsequent papers.
We thank T. Hanawa, Y. Matsumoto, S. Miyaji, James M. Stone, M. Machida, A. Mizuta, and K. Suzuki for discussion. Numerical computations were carried out by FX1 at JAXA and XT4 and XC30 at Center for Computational Astrophysics, NAOJ. This work is supported by grants in aid for scientific research by JSPS Core-to-Core Program No. 22001, JSPS KAKENHI grant No. (21253003, 23340040), and Grant in Aid for JSPS fellows (24.4786).