


ABSTRACT
We present results from an analysis of Advanced Composition Explorer (ACE) observations of energetic particles in the 0.047–4.78 MeV range associated with shocks and discontinuities in the solar wind. Previous work found a strong correlation between coherent structures and energetic particles measured by ACE/EPAM. Coherent structures are identified using the Partial Variance of Increments (PVI) method, which is essentially a normalized vector increment. The correlation was based on a superposed epoch analysis using over 12 years of data. Here, we examine many individual high-PVI events to better understand this association emphasizing intervals selected from data with shock neighborhoods removed. We find that in many cases the local maximum in PVI is in a region of rising or falling energetic particle intensity, which suggests that magnetic discontinuities may act as barriers inhibiting the motion of energetic particles across them.
Export citation and abstract BibTeX RIS
1. INTRODUCTION
Suprathermal particles are an important feature of the solar wind, including various interplanetary transients such as shocks and CMEs, and can serve as seed particles that are further accelerated at interplanetary shocks (Desai et al. 2003; Channok et al. 2005). Fluctuations in the suprathermal particle flux may reflect processes of particle acceleration or transport. For example, Solar Energetic Particles (SEP) can be accelerated near the Sun itself by magnetic reconnection in flares or by shocks through diffusive shock acceleration (DSA), (see Drury 1983, and references therein), or other mechanisms involving first-order Fermi acceleration (Fermi 1954; Parker 1958; Reames 1999). Note, however, that not all shocks are associated with DSA; of 168 forward shocks analyzed by Lario et al. (2003), only 65 of them exhibited the "classic" energetic particle profile of DSA for ions in the 47–68 keV range. A challenge for any description of suprathermal particles is to explain the observed suprathermal tail of the plasma distribution function (Gosling et al. 1981; Gloeckler et al. 2000; Gloeckler 2003). Possibilities include stochastic acceleration (Miller et al. 1990; Le Roux et al. 2000; Dmitruk et al. 2004; Chandran et al. 2010) and/or the pump mechanism of Fisk & Gloeckler (2006).
A related issue concerns SEP propagation in the interplanetary magnetic field (Giacalone et al. 2000; Ruffolo et al. 2003). Borovsky (2008) proposed that the interplanetary magnetic field consists of flux tubes with a width of the order of the turbulent correlation length (∼0.02 AU) that can be identified at their boundaries by a coherent structure (localized region of high phase correlation), manifested as a change in the magnitude and/or direction of the magnetic field or solar wind velocity. Here we invoke a notion of flux tubes that does not require them to be connected back to the photosphere or space filling as described by Borovsky (2008) but for which there are problems (Burlaga 1969). In addition, different flux tubes may have different plasma properties. Accordingly, there is an association between observed classical discontinuities (Neugebauer et al. 1984) and statistical signatures of coherent structures (Greco et al. 2008), which will be exploited below.
Abrupt changes in the flux of energetic particles, known as "dropouts," are often observed in the solar wind (Mazur et al. 2000; Gosling et al. 2004; Chollet & Giacalone 2008, 2011; Trenchi et al. 2013) and may be the manifestation of flux tubes either full or devoid of energetic particles being advected past the spacecraft. This suggests that there is very little cross field diffusion of energetic particles. However, observations of wide longitudinal spreading of SEPs (Cane & Erickson 2003; Wiedenbeck et al. 2011) lead to an apparent contradiction with the observation of dropouts as sharp boundaries demarcating energetic particle events. This could be resolved by topological trapping in which particles starting in a region of extremal parallel magnetic vector potential will be confined to a flux tube while particles near magnetic X-type lines will transport away more quickly (Ruffolo et al. 2003; Chuychai et al. 2007; Seripienlert et al. 2010).
Flux tube boundaries, X-lines, and current sheets are coherent magnetic structures which have also been shown to be preferentially associated with heating in the solar wind and in simulations (Osman et al. 2011; Greco et al. 2012; Osman et al. 2012a, 2012b; Servidio et al. 2012; Wu et al. 2013; Chasapis et al. 2015) and may also be related to the phenomenon of moss emission in the solar transition region (Kittinaradorn et al. 2009) in which patchy features are associated with inhomogeneous heat transport from the corona. Suprathermal electrons are qualitatively shown to be found within kinetic scale current sheets (see, e.g., Figure 10 of Karimabadi et al. 2013). Test particle simulations using turbulent MHD fields have also shown that the highest energy particles are often found inside magnetic O-points and that this mechanism operates differently on electrons than on ions (Matthaeus et al. 1984; Ambrosiano et al. 1988; Dmitruk et al. 2004; Drake et al. 2006). There is also evidence from simulation and theory for particle acceleration in turbulent magnetic reconnection (Retinò et al. 2007; Zank et al. 2014; Khabarova et al. 2015; Le Roux et al. 2015; Matsumoto et al. 2015).
Given this association of heating and discontinuities in the solar wind and in simulations, Tessein et al. (2013; hereafter referred to as T13) looked at the association between magnetic discontinuities and energetic particles by analyzing data from the Advanced Composition Explorer (ACE) spacecraft and found a significant temporal correlation between coherent magnetic structures and energetic particles. A summary of that result is shown in Figure 1, a superposed epoch analysis of the average energetic particle intensity profile near shocks and near strong coherent structures. (including and excluding shock neighborhoods). Partial Variance of Increment (PVI) is a normalized magnetic field increment that identifies strong discontinuities and is defined by

where 
 is the increment, and
  indicates averaging. Thus, large values of PVI (>3) correspond to intense coherent structures.

Figure 1. Summary of the results of Tessein et al. (2013). Shown are data for strong (PVI > 7) coherent structure events with shock neighborhoods included (+) or excluded (−) as well as data for shock events. Note that the average flux near any PVI > 7 coherent structure (including shock neighborhoods) is higher than the average flux near shocks. The average energetic particle flux near coherent structures not in a shock neighborhood, while lower than that near shocks, still has a peak at the temporal location of the coherent structures. Additionally, the data for shocks match the profile one might expect for DSA. In this and several other figures, the right axis indicates the sample size for each trace.
Download figure:
Standard image High-resolution imageThe energetic particle flux is averaged over many events, the number of which is indicated by an arrow at the right hand side of the plot. Energetic particle intensity has been obtained by summing over the eight energy channels of the EPAM/LEMS120 detector on the ACE spacecraft and will be explained further below. The average energetic particle flux associated with the strongest coherent structures, when shock neighborhoods are included in the analysis, exceeds even the average flux associated with shocks. The profile of energetic particle flux for shocks matches well with what one might expect from standard DSA theory (Drury 1983), with a steep increase leading up to the shock and a plateau or slow decrease after the shock passage. For strong PVI events, there is a local peak in the average intensity, where the 47 keV–4.8 MeV energetic particle flux decreases as one moves away from the coherent structure. This brings to mind the superposed epoch analysis of Osman et al. (2012b), in which proton heating is maximal at coherent structures and falls of monotonically with temporal lag. With shock neighborhoods included, the peak average flux occurs about 30 minutes before the PVI > 7 coherent structure (also shown in Figure 1). Since many coherent structures occur in the downstream region of shocks, there is a high probability of a shock preceding a strong discontinuity. The offset peak is likely due to first-order Fermi acceleration at the shock. However, when shocks and regions around shocks are removed using the ACE shock list,4 the overall trend remains, albeit with reduced (by about a factor of 6) average energetic particle flux, and the peak is better aligned with the location of the discontinuity.
The current picture of the relationship of suprathermal particle enhancements to coherent magnetic structures (discontinuities) remains unsettled and perhaps confusing. The preponderance of suprathermal particle enhancements could be attributed in some way to DSA or Fermi acceleration despite considerable effort to remove any influence of the above described effect (e.g., in Figure 1). Part of the problem is that coherent magnetic structures (as we define them) tend to be close to shocks, making it difficult to disentangle these effects.
The purpose of the present study is to clarify the previously noted significant association between coherent structures in the interplanetary medium and the energetic particle flux, and in particular the possibility of effects that are distinct from standard DSA theory. T13 suggests that in the absence of an identified shock, the local enhancements in energetic particles at magnetic discontinuities could be due to transport along flux tubes, acceleration, or topological trapping. Here we examine further the diverse possibilities for this association by taking into account possible sources of error. These include upstream events that represent transient connection with an acceleration region at Earth's bow shock, and an incomplete shock list. We address the latter by expanding the shock list to be more inclusive. We also consider numerous individual events in detail, and frequently find features consistent with effects of transport and not inconsistent with local acceleration.
2. DATA AND ANALYSIS PROCEDURES
The data we use are from the ACE spacecraft (Stone et al. 1998). The energetic particle data are from the LEMS120 and LEMS30 detectors on the EPAM instrument in the energy range of tens to thousands of keV (Gold et al. 1998). The energetic particle flux in the detector is in eight energy channels and we sum over the eight channels weighted by the width of each channel. The temporal resolution of these data is 5 minutes. The magnetic field data are from the MAG instrument (Smith et al. 1998) and for the plasma data we used SWEPAM (McComas et al. 1998). For sample events, we used the 16 s resolution magnetic field and 64 s SWEPAM data. For the statistical analysis we resampled the 64 s merged MAG/SWEPAM data set from the ACE Science Center to 5 minute resolution to match the 5 minute EPAM data. See Table 1 for information about the data used. We mainly use data from LEMS120 for reasons to be explained in Section 2.4.
Table 1. Summary of the Data Used
| Instrument | Measurement | Energy Range | Cadence | Time Intervala |
|---|---|---|---|---|
| ACE/EPAM/LEMS30 | Ion Flux | 0.046–4.7 MeV | 5 min | 1998–23 to 2001–150 |
| ACE/EPAM/LEMS120 | Ion Flux | 0.047–4.78 MeV | 5 min | 1998–23 to 2010–258 |
| ACE/SWEPAM & MAG | Plasma Parameters & Magnetic Field | 0.26–36 keV | 64 s | 1998–23 to 2010–258 |
| ACE/MAG | Magnetic Field | N/A | 16 s | 1998–23 to 2010–258 |
Note.
aTime format is (year)-(day of year).Download table as: ASCIITypeset image
2.1. PVI
The PVI statistic identifies coherent structures by examining the statistics of increments. It is similar to other methods for finding coherent structures such as local intermittency measure, kurtosis, wavelets or phase coherence (Bruno et al. 2001; Hada et al. 2003) and is defined by examination of Equation (1). The averaging in the denominator is typically over a large sample. Note that the value of PVI has a dependence on nearby fluctuations because of the weighting factor in the denominator. Thus, given two equal discontinuities, one surrounded by many high amplitude fluctuations will have a lower PVI value than one with no other strong fluctuations around. For this reason we prefer to employ larger averaging intervals. Throughout the paper we use ∼34 day averaging for the denominator in Equation (1). By imposing a threshold on PVI we can identify the most intense events. Increments with PVI > 3 are related to "heavy tails" seen in the distribution of increments corresponding to non-Gaussian structures (Greco et al. 2008). Also, the mean fourth moment of PVI is related to kurtosis of the increments which allows us to relate PVI to intermittency statistics. The simple form of PVI allows for straightforward comparison to simulations. In this study, as in T13, we used a lag of τ = 5 minutes throughout, mainly for convenience as that is the minimum lag in the energetic particle data. With this lag, thin current sheets such as that seen by Perri et al. (2012) will not be detected. PVI can be implemented at a variety of scales, however, it has frequently been applied to the inertial range to make contact with intermittency statistics (Greco et al. 2009).
2.2. Shock Lists
The analysis reported in T13 used the ACE shock list to identify shocks. The ACE shock list is an excellent resource for shock studies, providing solutions to the jump conditions as well as other useful information, and works very well for analyzing shocks individually. It includes most, but not all strong shocks observed by ACE, and questionable shocks are not present (Vorotnikov et al. 2008). By questionable, we mean shocks that have a small magnetic field or density ratio and may not have obvious large discontinuities in the plasma data. We also make use of the CfA Interplanetary Shock Database5 which has been used to fill in the gaps. However, no shock list can hope to capture all of the questionable shocks given the ambiguity in their definition. For completeness we attempt to identify questionable shocks (see Section 2.3).
Using the CfA shock list we identified shocks that were observed by WIND but do not appear in the ACE list. Then we looked at the WIND orbits to determine whether it was possible for the shock measured by WIND to appear at ACE. If ACE and WIND were reasonably aligned we checked the data in ACE for a discontinuity present in the data. If there was a corresponding discontinuity in ACE, we assumed a 400 km s−1 solar wind speed to estimate the time at which the shock reached ACE. ACE is usually, at most, hours away from WIND so the error from lack of precision in wind speed (since shocks typically propagate faster than 400 km s−1) is small compared with the amount of data being removed during the shock masking. This procedure allows for the production of an augmented ACE shock list. It must be kept in mind that this shock list may include false positives and may also miss shocks. Given the difficulty of ruling out questionable shocks statistically, that seems to be the best we can do at this point, so we assume that the augmented list is adequate for our purposes.
The list augmented according to the above procedure contains 498 shocks (compared with 322 shocks in the list of T13). Figure 2 is a histogram of the PVI value for each of the shocks. The shock-associated PVI value shown is the maximum of the five nearest PVI values at the shock (the nearest neighbor plus two on either side). Note that the distribution peaks for PVI < 2, which is a relatively low PVI value.
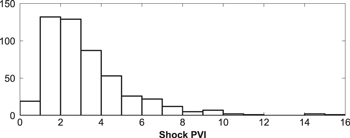
Figure 2. Histogram of the PVI value at 498 shocks. The shock-associated PVI value was obtained by taking the five nearest measurements to the shock (the nearest neighbor plus two on either side). Note that the distribution peaks for PVI < 2, which is a relatively low PVI value.
Download figure:
Standard image High-resolution imageBased on the augmented list we construct a new superposed epoch analysis that improves upon Figure 1 (from T13). Shown in Figure 3 is the average EPAM/LEMS120 flux conditioned on PVI threshold as a function of temporal proximity to the PVI event. For this figure, 30 hr of data around a shock (15 hr before and after) from the augmented list are removed from the statistical analysis; this procedure removes 13% of the total data. The energetic particle counts are reduced from T13, but the same trend is present except for PVI > 8. Since the ion channels of the LEFS60 detector are geometrically similar to LEMS120 (LEMS30 is not) we deemed it worthy of comparison between the two. The superposed epoch analysis has been repeated using the ion channels of the ACE/LEFS60 detector (FP5p-FP7p) with a qualitatively similar result.
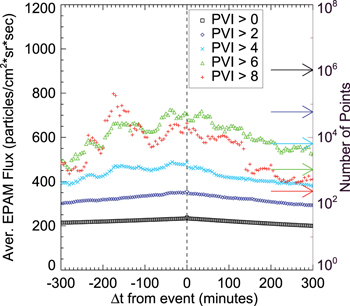
Figure 3. Average EPAM/LEMS120 flux conditioned on PVI threshold and temporal proximity to the PVI event, analogous to Figure 1 (from T13) . For this figure, data within the neighborhood of shocks from the augmented list are removed from the statistical analysis; this procedure removes 13% of the total data. The energetic particle counts are reduced from T13, but the same general trend is present except for PVI > 8.
Download figure:
Standard image High-resolution image2.3. Search for Questionable Shocks
Considering that the ACE and WIND shock lists are composed primarily of strong shocks, it may be worthwhile to try to include questionable shocks in the statistical analysis for completeness. An automated method for doing this would be ideal, for example, using criteria based on entropy, pressure discontinuity or jump conditions. An even simpler method for discerning between shock and non-shock discontinuities would be to look at the directions of the gradients of the discontinuities in the plasma and magnetic field data. At a forward shock, velocity, density, and temperature should all increase at the shock front. At a reverse shock, velocity increases while density, temperature, and field strength all decrease. For a non-shock discontinuity that would not necessarily be the case. At a boundary between a high temperature, low density flux tube and a low temperature, high density flux tube, the changes in temperature and density across the boundary will have opposite senses.
We decided to look at selected strong discontinuities absent in the shock lists and make a judgment on whether or not each one is a shock too weak to be selected for the lists. Since there are hundreds of thousands of discontinuities in the ACE data, we used a list of 279 PVI > 8 events that occurred at least 12 hr away from a shock in the augmented list. Examining the events by eye returned 6 out of 279 events as questionable shocks. The other events cannot be considered forward or reverse shocks because there was no clear transition from shocked to unshocked plasma. Recall that PVI is a poor method for identifying shocks (see Figure 2); there could be many questionable shocks that are missed by only looking at PVI > 8 discontinuities. The method used could lead to false positives as well.
We compare the energetic particle profiles of strong shocks, non-shock discontinuities, and questionable shocks in Figure 4 using the same superposed epoch analysis method employed in Figure 3. In this case, the strong shocks are naturally associated with much higher energetic particle flux than PVI > 8 questionable shocks (note the log scale). Henceforward, we will not consider PVI > 8 questionable shocks as a separate category because they do not seem to be associated with high energetic particle flux.

Figure 4. Average energetic particle profiles for questionable shocks, strong shocks and PVI > 8 discontinuities (with shock neighborhoods included). There is no evidence of strong energetic particle flux increases associated with questionable shocks.
Download figure:
Standard image High-resolution imageIt appears that there remains a correlation between PVI and energetic particle intensity in Figure 3, but as we improve the shock removal technique that trend is slowly eroded while the local temporal increase in flux at coherent structures is maintained. Given this, we have decided to categorize whatever questionable shocks are present as non-shock data because the method for identifying them is arbitrary and we have no evidence that they are affecting the statistics. There are many events that are unlikely to be shocks and are more likely to be flux tube boundaries; examples of these types of events are shown later in this paper.
2.4. Upstream Events at ACE
The LEMS120 detector is oriented at an angle of 120° from the spacecraft spin axis (which is within 20° of the Earth–Sun line), pointing mostly Earthward and subject to upstream events (brief, intermittent particle enhancements) when magnetically connected to Earth's bow shock (Haggerty et al. 1999, 2000). The LEMS30 detector, with a different orientation, is not as sensitive to upstream events. An example of this is shown in Figure 5; this is a time series of the three lowest energy channels of LEMS120 (top panel) and LEMS30 (middle panel) plus PVI (bottom panel) over two days at 5 minute time resolution. However, LEMS30 has an elevated P1 noise floor after day 150 of 2001 (see Figure 2 of Haggerty et al. 2006), making LEMS30 data after that day inappropriate for our analysis. Further, the P1 and P2 channels of LEMS30 are sometimes contaminated by sunlight (Marhavilas et al. 2015).

Figure 5. Time series of the three lowest energy channels of LEMS120 (top panel) and LEMS30 (middle panel) plus PVI (bottom panel) over two days at 5 minute time resolution. We see upstream events in LEMS120 and a much lower instance of them in LEMS30. Upstream events from the bow shock appear as three spikes in the top panel not seen in LEMS30.
Download figure:
Standard image High-resolution imageTo check the effect of upstream events, we have also examined LEMS30 data up to day 150 of 2001 (slightly over 3 years of data) as shown Figure 6. The analysis shown includes all 8 energy channels of LEMS30, but we have performed the same analysis without the P1 and P2 channels and obtained qualitatively similar results. This uses the augmented shock list, which incorporates shocks from the ACE and WIND lists. The result from 12 years of LEMS120 data with the augmented shock list was shown in Figure 3. There is not much difference in the shape of the traces in the two cases so we can eliminate these upstream events as a significant problem with the superposed epoch analysis. Note that Figure 6 has much higher average energetic particle flux than Figure 3 because it uses data only from solar maximum. Although the statistical significance is weaker for high PVI thresholds in Figures 3 and 6, it is also possible that different physical mechanisms contribute to the energetic particle intensity at high-PVI events. For example Osman et al. (2014) found an association between very high PVI values and nearby reconnection events. Because the LEMS120 data set includes ∼4 times more usable data, providing better statistics, we continue to use the LEMS120 data for further analysis.

Figure 6. Analogous to Figure 3 but using LEMS30, which, from Figure 5, is expected to have many fewer upstream events and covering the time period from day 23 of 1998 to day 150 of 2001. Given the qualitative similarities in this figure (relatively lacking in upstream events) and Figure 3 (containing more upstream events) we conclude that upstream events in LEMS120 almost certainly do not play a significant role in the superposed epoch analysis.
Download figure:
Standard image High-resolution image2.5. Prevalence of Coherent Structures in Shocked Regions
As a shock passes the spacecraft, the shocked plasma downstream is stirred up, leading to formation of turbulence and coherent structures. Most of the high PVI events in the study occur within several hours after a shock has passed.
Figure 7 is a superposed epoch analysis (analogous to Figure 3 but with shock neighborhoods included) showing the turbulence level b2 instead of energetic particle flux. The turbulence level comes from separating the interplanetary magnetic field into mean and fluctuating components ( ). By calculating the variance of the fluctuations (using the mean field averaging time described in Section 2.1) we obtain an estimate for the "turbulent power." For the shock trace, as expected, there is a discontinuity in the turbulent power at shocks. The turbulent power is low before the shock, which is the upstream region for forward shocks, then ramps up to a higher level at the shock, and eventually tapers off at long times. This is another manifestation of the increased turbulence level near shocks. The turbulence-level traces for PVI look similar to what we see in Figure 3 with a local increase in turbulence level at PVI events and higher turbulence level for higher values of PVI. A result like this is to be expected because PVI is, in a sense, a proxy for the turbulence level. One caveat to be kept in mind in this analysis is that approximately one fifth of the shocks studied are reverse shocks. In these cases, the upstream and downstream parts of the shocks will be reversed.

Figure 7. Superposed epoch analysis (analogous to Figure 3) showing turbulence level b2 (variance of magnetic field) instead of energetic particle flux with shock neighborhoods included. The turbulence level comes from separating the interplanetary magnetic field into mean and fluctuating components ( ) by calculating the magnetic field variance using the mean field averaging time described in Section 2.1.
Download figure:
Standard image High-resolution image3. SAMPLE EVENTS
A logical next step to extend the analysis of T13 is to look at sample events, which can help identify the cause of the strong peak in energetic particle flux associated with coherent structures. Recognizing that conditional statistics may lead to ambiguous results, we want to see directly the individual events in the data that influence the statistics. We consider three possible scenarios that might combine to give rise to observed enhancements at discontinuities in the superposed epoch analysis, all of which are explained further below:
- 1.The presence of shocks not appearing in the list.
- 2.Extended DSA tails.
- 3.Edge Events.
Scenario 1. There are shocks present in the T13 "shock removed" sample that are responsible for the observed SEP enhancements at PVI events. This can be corrected by taking into account the augmented shock list described above. There are DSA events that are not included in the shock list used by T13. An example of that type of event is shown in Figure 8. This particular event is an example of a shock ignored by T13 but accounted for in the augmented list. Excluding events of this type leads to the reduced energetic particle peak seen in Figure 3.
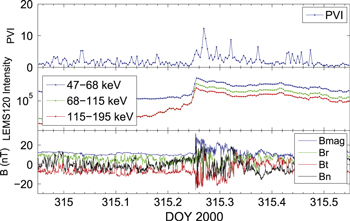
Figure 8. ACE data showing the time series of PVI (top), EPAM/LEMS120 energetic particle intensity (middle) and 16 s vector magnetic field (bottom). This event was not counted as a shock in T13, but has been included in the augmented shock list used for this paper. The cluster of high PVI events co-located with the energetic particle intensity peak could give rise to the effect we observe because it is not in the ACE shock list.
Download figure:
Standard image High-resolution imageScenario 2. This scenario refers to the influence of DSA on events identified as non-shock discontinuities. There is ample evidence of DSA in the results of T13. In our shock-masked analysis we remove 15 hr of data upstream and downstream of shocks; however, the energetic particle flux plateau downstream of the shock might persist up to 36 hr. PVI events occurring in this shock-associated region beyond the 15 hour masking will be associated with an elevated energetic particle flux that is shock-associated. It must be kept in mind that this scenario does not naturally produce a peak in the superposed epoch analysis.
An example of an event like this is shown in Figure 9. In this situation there are two DSA events with a cluster of high PVI values between them occurring more than 15 hr away from both shocks. The effects of DSA play a role for events like this, even if they are more than 15 hr away from the shock.
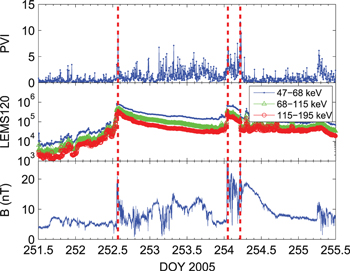
Figure 9. ACE data showing the time series of PVI (top), EPAM/LEMS120 energetic particle intensity (middle) and 16 s vector magnetic field (bottom). In that situation there are two DSA events. Between them, there is a cluster of high PVI values occurring more than 15 hr away from both shocks. The vertical dashed lines indicate locations of shocks.
Download figure:
Standard image High-resolution imageScenario 3. This refers to an effect observed in the data, where the strong discontinuities appear to be located at energetic particle gradients. That is, the energetic particle flux is increasing or decreasing as established by at least two consecutive data points. Figure 10 shows examples of that type of observation. In these sample plots, showing time series measurements of PVI, LEMS120 intensity, and magnetic field magnitude, the high PVI values are associated with gradients in the energetic particle intensity.
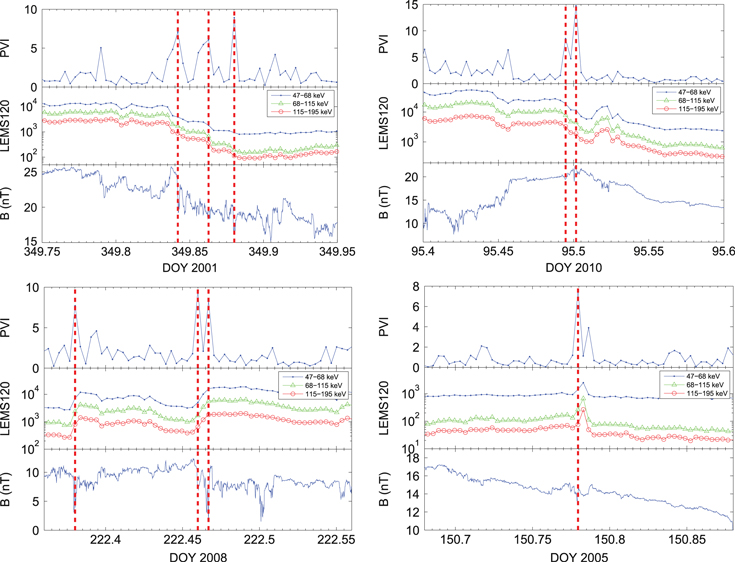
Figure 10. In these sample plots, showing time series of 5-minute PVI (top), 5-minute LEMS120 intensity (middle) and 16-s magnetic field measurements (bottom), the high PVI values are associated with a gradient in the energetic particle intensity (note the logarithmic scale). The vertical dashed lines indicate the locations of the discontinuities. These features may be related to the spacecraft passing through filled and empty flux tubes. Note in the upper left panel the excellent correspondence between PVI peaks and step-like changes in energetic particle flux.
Download figure:
Standard image High-resolution imageIn the upper panels of Figure 10, there is a decline in all channels of the energetic particle flux. In these cases there is at least one PVI > 8 non-shock discontinuity co-located with a general decline in energetic particle flux. While this is not plotted, the discontinuities often include a magnetic field rotation. In the upper left panel, for DOY 349 of 2001, we see that step-like changes in energetic particle flux are perfectly co-located with PVI peaks.
In principle there could be a fourth scenario in which there are isolated peaks of PVI and energetic particle flux overlapping; a simple case that is nearly this example is shown in the lower right panel of Figure 10. There may be more examples of this downstream of shocks but that is not the emphasis of the present paper. In fact, overlapping peaks of energetic particle intensity and PVI appear to be rare away from shocks. Upon closer inspection of the bottom left panel of Figure 10 one sees that there is a similar enhancement of energetic particle intensity between two PVI peaks. In this sense, there may be very little difference between so-called "peak" and "edge" events. Pairs of PVI peaks with energetic particle peaks between them may be a flux tube with particles entrained within. Some simulations reveal particles trapped within secondary flux tubes (Matsumoto et al. 2015) and test particles in MHD have also shown this effect (Matthaeus et al. 1984).
Figure 11 provides additional context for the type of the sample events shown in Figure 10. It contains time series of PVI, LEMS120 intensity, magnetic field, density, temperature and proton flow speed. Flux tubes in the solar wind can create boundaries for different types of plasma. Thus, if some of the flux tubes are acting as pipes and may be filled with energetic particles, we can look for magnetic field discontinuities marking the boundaries of the flux tubes, and a change in the plasma parameters (Trenchi et al. 2013). In Figure 11, as in Figure 10 we see exactly that scenario. The magnitude change in the magnetic field is small but there is also a rotation, which one would expect for many of these flux tube boundaries (marked by a vertical dashed line). There is also a discontinuity in the density. The temperature and flow velocity do not have significant discontinuities but are changing around t = 62.39, the time when we identify the possible flux tube boundary. The evidence points to this as being a current sheet that represents a boundary between flux tubes.
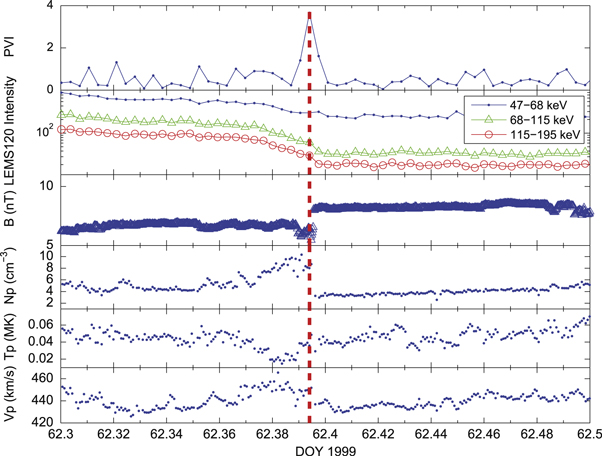
Figure 11. Time series of PVI, LEMS120 intensity, magnetic field, density, temperature, and proton flow speed. The magnitude change in the magnetic field (marked by a vertical dashed line) is small but there is also a rotation (not shown), which one would expect for the flux tube boundary. There is also a discontinuity in the density. The temperature and flow velocity do not have significant discontinuities but are changing around DOY 62.39, the site we have identified as a flux tube boundary. This is clearly not a shock; it is a current sheet bounding two regions of distinct plasma properties which we interpret as a flux tube boundary.
Download figure:
Standard image High-resolution image4. FURTHER STATISTICS
It is expedient to have a statistical way of confirming the observation of the edge events shown above. One way of doing this is by looking at a lagged cross correlation between quantities. Figure 12 is a lagged cross correlation between PVI and energetic particle intensity variations (with PVI being the lagged quantity) using LEMS120 for various PVI thresholds. It must be kept in mind when performing an analysis like this that we are looking at a composite result combining different types of events. This was done for data more than 15 hr away from a shock to remove the effect of local DSA using the augmented shock list. We subtracted off the means,


where I and PVI are the energetic particle flux and PVI time series, respectively, and  denotes a time average over the entire data set. Thus, we are correlating the fluctuating part of these quantities. The cross correlation is

where σ represents the variance of the subscripted quantity. The correlation function peaks for zero lag, telling us that energetic particle flux and PVI are most likely to be changing together.

Figure 12. Lagged cross correlation between quantities ΔPVI and ΔI for various PVI thresholds. The correlation function peaks for zero separation. This tells us that energetic particle flux and PVI are most likely to be changing within 15 minutes of one another. The data are more than 15 hr away from a shock to remove the effect of local DSA.
Download figure:
Standard image High-resolution imageFigure 13 depicts probability density functions (PDFs) of the signed percent difference

in energetic particle flux across discontinuities, where in this case the lag L is equal to one hour. We have applied this procedure for PVI > 3, 4 or 5 and PVI < 4 with varying lag and plotted a Gaussian for reference. Like many increment-type statistics in the solar wind, the distributions of energetic particle flux increments are non-Gaussian. In addition, for the stronger discontinuities the PDF is more non-Gaussian than for weak ones and statistics with longer lag are more non-Gaussian than those with shorter lag.

Figure 13. PDFs of the signed percent difference in energetic particle flux across discontinuities for PVI > 3, 4 or 5 and PVI < 4 with varying lag with a Gaussian distribution (dotted curve) shown for reference.
Download figure:
Standard image High-resolution image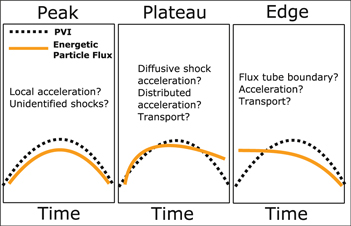
Figure 14. Three possible scenarios in the data that could lead to observations linking PVI and energetic particle flux.
Download figure:
Standard image High-resolution image
5. DISCUSSION
The results we present here provide evidence that the peak in the superposed epoch analysis first shown in T13 can be attributed partially to each of the three scenarios: unidentified shocks, DSA far from shocks, and structures such as flux tube boundaries. In the last case it is difficult to distinguish, based on the current analysis, between transport effects due to the entrainment or trapping of particles within flux tubes, and the possible energization of the particles that might occur while they are entrained. Thus, it is also possible that local acceleration at or near non-shock discontinuities could play a role. For example, there could be a contribution from flux tube collisions, which could then involve reconnection and associated energization processes including betatron acceleration (Swann 1933; Dalena et al. 2014) and secondary islands (Ambrosiano et al. 1988; Drake et al. 2006). Recall that in the sample flux tube event shown in Figure 11 there is a maximum in density near the flux tube boundary interface.
Such considerations make it difficult to rule out that some fraction of the particles are associated with flux tube boundaries or are accelerated at, or near, those locations. While this is expected on theoretical grounds (Karimabadi et al. 2013; Zank et al. 2014; Matsumoto et al. 2015), the diagnostics we employed provide no specific evidence for this type of acceleration other than the juxtaposition of high SEP fluxes with high PVI events and the possible presence of flux tube boundaries. One possibility to explain the results seen in T13 and in Figure 3 is a compression effect, where a compression in the shocked turbulence may affect the distribution functions resulting in a higher density of energetic particles as in Figure 1 of T13. However, given the relative scarcity of energetic particle peaks overlapping PVI peaks, which is what one would expect in this scenario, there appears to be no strong role of the compression effect on the average statistics.
In Figure 13 we see a non-Gaussian distribution of energetic particle flux changes. This in itself is not surprising given the non-Gaussian nature of solar wind turbulence. However, the fact that the tails become stronger for higher PVI values is revealing. This can be seen as a statistical manifestation of thousands of PVI events showing small changes in energetic particle flux, supporting our conclusion based on the sample events in Figures 10–11.
The location of the peak at zero lag in Figure 12 indicates that energetic particle flux tends to be changing in the vicinity of coherent structures and has with it the added complication of the time scale on which we are measuring current sheets. This is consistent with various simulations, for locations at or near strong coherent current structures (Greco et al. 2012; Servidio et al. 2012; Karimabadi et al. 2013; Dalena et al. 2014).
6. CONCLUSIONS
We have presented a follow-up to T13 by further improving the analysis and attempting to explain the association of high energetic particle flux with coherent structures in cases where shock neighborhoods are excluded. We started by addressing several possible weaknesses of that analysis: an incomplete shock list, questionable shocks, upstream events and instrumental issues. The shock list has been expanded from that used by T13 and now appears to include nearly all strong shocks in ACE. Shocks not included in shock lists, dubbed here as "questionable shocks," appear to have little association with DSA, making it unnecessary to consider them. While it is highly likely that upstream events are present in the statistics, the effects appear to be minimal and do not change the qualitative effects of the results. After accounting for these, the basic association remains even when local DSA effects should be removed. We proceeded to show sample events and point out three possible scenarios that contributed to the statistics shown in Figure 3. These scenarios are summarized as a cartoon in Figure 14. However, when excluding shock neighborhoods using the augmented shock list the first scenario should be mostly removed and the other two scenarios do not explain the peak seen in Figure 3. Therefore, we consider that local acceleration effects at discontinuities might play some role.
It should be noted here that DSA is clearly an important and dominant mechanism. We go to considerable effort to look at periods away from shocks and the influence of shock acceleration, yet there remains a local increase in energetic particle flux at coherent structures that increases with increasing PVI which remains incompletely explained.
We thank the ACE MAG, EPAM, & SWEPAM instrument teams and the ACE Science Center for providing the ACE data. The shocks used are from the ACE shock lists and the CfA Interplanetary Shock Database. The authors acknowledge NSF grants AGS-1063439 and AGS-1156094, NASA Helophysics Grand Challenge grant NNX14AI63G and MMS Theory and modeling team grant NNX14AC396, Solar Probe PLUS/ISIS through SWRI subcontract D99031L, and the Thailand Research Fund. J.A.T. acknowledges the Delaware Space Grant College and Fellowship Program (NASA grant NNX10AN63H).