


ABSTRACT
Titan's atmosphere is opaque in the near-infrared due to gaseous absorptions, mainly by methane, and scattering by aerosols, except in a few "transparency windows." Thus, the composition of Titan's surface remains difficult to access from space and is still poorly constrained. Photochemical models suggest that most of the organic compounds formed in the atmosphere are heavy enough to condense and build up at the surface in liquid and solid states over geological timescales. Acetylene (C2H2) net production in the atmosphere is predicted to be larger than any other compound and C2H2 has been speculated to exist on the surface of Titan. C2H2 was detected as a trace gas sublimated/evaporated from the surface using the Gas Chromatograph Mass Spectrometer after the landing of the Huygens probe. Here we show evidence of C2H2 on the surface of Titan by detecting absorption bands at 1.55 and 4.93 μm using the Cassini Visual and Infrared Mapping Spectrometer at three different equatorial areas—Tui Regio, eastern Shangri La, and Fensal–Aztlan/Quivira. We found that C2H2 is preferentially detected in low-albedo areas, such as sand dunes and near the Huygens landing site. The specific location of the C2H2 detections suggests that C2H2 is mobilized by surface processes, such as surface weathering by liquids through dissolution/evaporation processes.
Export citation and abstract BibTeX RIS
1. INTRODUCTION
Saturn's moon Titan possesses a thick atmosphere that is mainly composed of N2(98%), CH4 (2% overall, but 4.9% close to the surface), and trace species, mostly hydrocarbons (Niemann et al. 2005). According to photochemical models, the dissociation of N2 and CH4 forms a plethora of complex hydrocarbons and nitriles in the atmosphere. In particular, models predict a net creation of C2H2 approximately 125–2000 times larger than for any other hydrocarbon or nitrile produced in the atmosphere (Vuitton et al. 2006, 2008). Most of the photochemical compounds from the atmosphere may settle onto the surface in their solid form (Wilson 2004; Clark et al. 2010). Over geological time, a C2H2 solid layer (or at least a solid C2H2-dominated layer) a few tens of meters thick (∼25 m, Lavvas et al. 2008a, 2008b; 28 m, Wilson 2004; ∼92 m, Yung et al. 1984) could have formed on the surface of Titan (Cordier et al. 2009, 2013; Coustenis et al. 2010).
The identification of specific compounds on the surface is challenging due to the hazy, methane-rich atmosphere which scatters and absorbs solar radiations, veiling the surface of Titan at visible and infrared wavelengths, except at seven atmospheric windows centered at 0.93, 1.08, 1.27, 1.59, 2.01, and 2.7–2.8 μm (where the atmosphere is partially transparent), and 5.0 μm (Sotin et al. 2005) (where the atmosphere is mostly transparent). Thus, the composition of Titan's surface remains difficult to assess from orbit and is still poorly constrained. Possible trace detection of solid benzene (Clark et al. 2010) and carbon dioxide (McCord et al. 2008), two by-products of the photochemistry of secondary abundance, has been reported on Titan's surface using the Cassini Visual and Infrared Mapping Spectrometer (VIMS; Brown et al. 2004, p. 111). In the McCord et al. (2008) study, CO2 frost was suggested in the bright terrains of Titan. However, correction for atmospheric effects suggests a lower 2.8/2.7 μm ratio, which was not consistent with pure CO2. Clark et al. (2010) used the same technique as McCord et al. (2008) to identify benzene within the dark surface unit and cyanoacetylene in the 5 μm atmospheric window. However, these molecules have been observed in the atmosphere in minor quantities compared to C2H2. If minor compounds like benzene and cyanoacetylene can be detected on the surface so should C2H2, unless some physical processes, such as consumption of C2H2, are at work. Due to its predicted higher atmospheric abundance C2H2 should exist and be detected on the surface, however, solid C2H2 has not yet been unambiguously detected.
Numerous hydrocarbons and nitriles are expected to be produced photochemically and could be detected by VIMS in theory. However, most of them condensate in the lower atmosphere, which is confirmed by Gas Chromatograph Mass Sspectrometer (GCMS) measurements that do not show the presence of many heavy molecules (Niemann et al. 2005). On the other hand, mass spectra taken on the surface (dark terrain) by Huygens clearly identified C2H2 on the surface, confirming predictions from photochemical models. Although C2H2 is probably mixed with other hydrocarbons at the surface, if it is produced in the quantities predicted by photochemical models, it should be detectable at the surface by Cassini/VIMS. Here we present an analysis of VIMS infrared spectra of Titan to search for the presence of solid C2H2 on the surface, in equatorial regions.
2. SEARCH FOR C2H2 ON TITAN WITH NEAR-INFRARED SPECTROSCOPY
Laboratory spectra (Clark et al. 2010; Singh et al. 2015a) of solid C2H2 at 90 K exhibit several strong absorption bands (Figure 1(A)). Two of these absorptions can be useful to detect C2H2 with VIMS data, because they fall within Titan's atmospheric windows, they are broad enough to be spectrally resolved by VIMS, and they occur at wavelengths where no other organic or nitrile candidate absorbs as much as C2H2. Figure 1(B) illustrates a strong absorption band at 1.55 μm, within the 1.59 μm atmospheric window, and Figure 1(C) shows a weak absorption at 4.936 μm within the 5 μm atmospheric window.
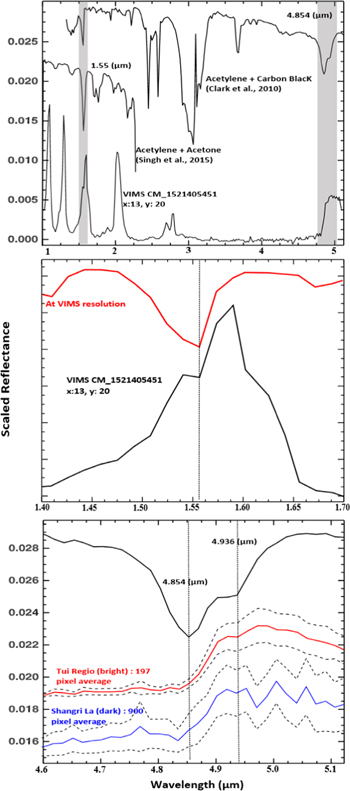
Figure 1. (A) Comparison between a C2H2 laboratory spectrum (Clark et al. 2010; Singh et al. 2015a) and a Cassini/VIMS spectrum of Tui Regio ranging from 1 to 5 μm. The absorption feature of C2H2 at 1.55 μm matches an absorption in Titan's surface spectra. (B) Same figure as (A) but centered on the 1.5 μm atmospheric window. (C) Same figure as (A), centered on the 4.93 μm atmospheric window, compared with VIMS average spectra from Tui Regio and Shangri La. The dashed line represents ±1 sigma for both Tui Regio and Shangri La.
Download figure:
Standard image High-resolution imageWe have also investigated compounds such as di-acetylene and tri-acetylene due to their similar absorption features to C2H2. Di-acetylene and tri-acetylene have been detected in the upper stratosphere by CIRS limb observations (Bezard 2009). However, the vertical abundance profiles of di- and tri-acetylene in Titan's atmosphere show a rapid decrease with altitude. At 40 km the di-acetylene mixing ratio drops by approximately three orders of magnitude compared to the higher altitude at 400 km (Vinatier et al. 2007). Both these compounds have the potential to successfully compete with free radical routes to form of larger and more stable hydrocarbons species in Titan's atmosphere (Zwier & Allen 1996). Assuming that both di-acetylene and tri-acetylene reach the surface, the absorption feature at 1.55 μm is most likely due to C2H2, because Metsälä et al. (2003) noticed a shift in the absorption band of di-acetylene toward shorter wavelength centered at 1.51 μm. In theory, due to the extra carbon di-acetylene should absorb more energy, thus shifting the absorption band toward shorter wavelengths, and does not qualify to produce an absorption band in Titan's surface spectrum at 1.55 μm. Thus, we concluded that acetylene is the only possible compound that matches the 1.55 μm absorption band along with 4.93 μm.
2.1. Proof of Concept for the Detectability of C2H2 at the Surface of Titan
In all VIMS spectra of Titan, a spectral feature exists at 1.55 μm, where C2H2 also absorbs, thus atmospheric absorptions can easily be mistaken for the C2H2 absorption band. In order to evaluate whether solid C2H2 at the surface of Titan contributes significantly to the 1.55 μm spectral feature of VIMS spectra, we used a plane-parallel radiative transfer (RT) model that takes into account the absorptions from atmospheric major gases, including atmospheric C2H2 and the scattering by haze particles in a comprehensive scheme (adapted from Hirtzig et al. 2013).
We use our RT model to simulate Titan's spectra at the VIMS spectral resolution (Figure 2(A)) and thus evaluate the theoretical 1.55 μm absorption band depth in the case of uniform surface albedos, linearly mixed with our laboratory spectrum of solid C2H2 (from 10% to pure C2H2). Those calculations were performed with the nominal model for the atmospheric gases (validated in previous studies; de Bergh et al. 2012; Hirtzig et al. 2013) and aerosols with zero incidence and emergence angles. The atmospheric gases and aerosol content have been fixed to the reference values measured by the Descent Imager-Spectral Radiometer (DISR) above the Huygens landing site (Tomasko et al. 2008). The consequence of the geometry of illumination and observation has also been tested in the limits of validity of the plane-parallel approximation (∼60° in incidence and emergence) for the pure C2H2 case.
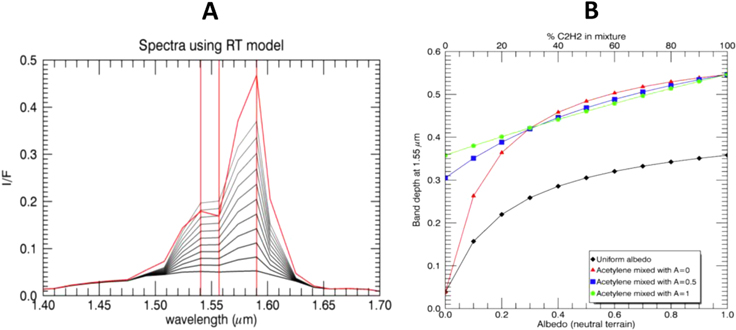
Figure 2. (A) Spectrum of C2H2 compared to spectra of constant albedo ranging from 0 to 1, at the VIMS resolution and seen through the atmosphere of Titan, calculated using an RT model with a nadir viewing geometry (Sotin et al. 2005), centered on the 1.59 μm atmospheric window. (B) Evaluation of the sensitivity of the absorption band depth at 1.55 μm calculated from modeled spectra of a spectrally neutral component mixed with various amounts of acetylene, and convolved with an RT model of Titan's atmosphere. Values above 0.3 can only be reached when acetylene is present in the mixture.
Download figure:
Standard image High-resolution imageThe eleven modeled spectra in Figure 2(A) show that C2H2 contributes significantly more to the absorption band at 1.55 μm than pure atmospheric absorptions. In order to detect C2H2, we calculate an absorption band depth at 1.55 μm with respect to a linear continuum between 1.54 and 1.59 μm. In order to evaluate the sensitivity of this spectral parameter (Figure 2(B)), we simulated a surface composed of a spectrally neutral material with albedos of 0, 0.5, and 1.0 mixed with various amounts of C2H2 ranging from 0% to 100%. As shown in Figure 2(b), the maximum absorption band depth value is 0.05 for a low-albedo surface and is 0.35 for a high-albedo surface, without C2H2 contribution.
We performed a different set of analyses to measure the maximum band depth by the atmosphere at 1.55 μm using VIMS observations. We use several different specular reflection observations over northern lakes with high incidence and emergence angles. Using specular reflection allows us to measure the maximum light absorbed by the atmosphere. In specular reflection lakes acts like a mirror in which incoming light is reflected in the outgoing direction, covering the atmosphere both ways. Some of the light will be absorbed by the lake, but the presence of solid C2H2 in Titan's lakes is highly unlikely and will not affect the 1.55 μm absorption band. After analyzing several observation of specular reflection, we concluded that the maximum absorption due to the atmosphere is ∼7%. Considering 3 times uncertainty, the atmosphere absorption at 1.55 μm is far below the detection threshold band depth of 50%. Absorption band depth values greater than 0.3 can only be reached if some amount of C2H2 is present on the surface, regardless of the albedo.
According to thermodynamic models and Cassini/CIRS observations (e.g., Coustenis et al. 2010), C2H2 gas is present in the atmosphere at ppm levels (Lavvas et al. 2008a, 2008b). C2H2 gas in the atmospheric column along the VIMS viewing path length may produce some effect on the overall spectrum observed. We therefore also tested the effect of the presence of atmospheric C2H2 on the 1.55 μm absorption using the RT model, and observed no changes on the spectral signature from the surface (Figure 3).
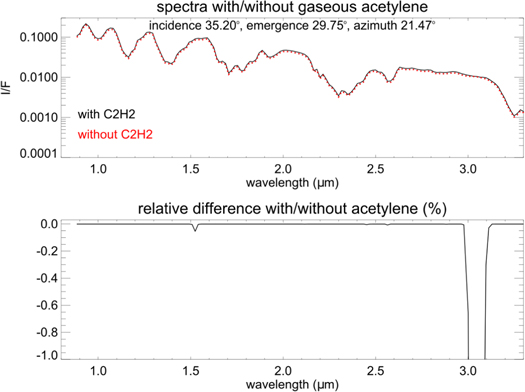
Figure 3. Evidence of atmospheric C2H2 does not contribute to the 1.55 μm band. Top: Titan's spectrum with and without atmospheric C2H2. Bottom: relative difference between the two.
Download figure:
Standard image High-resolution image2.2. Atmospheric Scattering Correction
The results from the RT model show that there is a significant influence of scattered radiation from the atmosphere onto the surface. Nevertheless, it also indicates that if C2H2 is present at Titan's surface, even in small amounts, it can be detected with a high level of confidence thanks to its 1.55 μm band. Thus, in order to increase the likelihood of detection of C2H2 at the surface, we performed an empirical atmospheric and photometric correction similar to Le Mouélic et al. (2012). The objective is to subtract the additive contribution from aerosols scattering to the spectrum measured by VIMS in the atmospheric windows. We assumed a Lambertian surface, i.e., one which scatters isotropically. The cosine of the incidence angle is used to normalize the viewing geometry to first order, and therefore to correct the time and space variation of the scene illumination. At short wavelengths (<3 μm), the averages of the wings of each side of the atmospheric windows, i.e., where the surface albedo features completely disappear, multiplied by a scaling factor (Kcorr) taking into account the scattering by the lowest part of the atmosphere, were used as a proxy to empirically estimate the atmospheric additive term.
After correcting the local cubes for atmospheric scattering using the Kcorr value of 1.60 provided by Le Mouélic et al. (2012) within the 1.6 μm window, we computed the band depth at 1.55 μm over the entire VIMS cubes used here to search for detection (band depth >50%) and possible spatial coherent units. We observed a clear coherency, with a higher absorption band depth in dark areas and a lower band depth in bright areas. Due to the opposite behavior of the band-depth calculation before and after empirical correction, we suspect possible local over correction of atmospheric scattering at 1.55 μm. To reduce the effect of local over correction, we fine-tuned the correction coefficient for regional studies. This approach finds a coefficient value (Kcorr = 1.49) that minimizes the correlation or anti-correlation with albedo, as was done at the global scale by Le Mouélic et al. (2012). The remaining variations still define spatially coherent units and correspond to variations of the surface composition of C2H2. Figure 4 shows the efficiency of the new atmospheric correction coefficient used to find the spatial coherency of pixels where C2H2 is positively detected at 1.55 μm. The Kcorr used does not cause any over/under correction because, if that were the case, Tui Regio (Figure 4(c)) would have appeared dark/bright relative to its surroundings. No correlation with albedo in the entire cube provides evidence that the Kcorr of 1.49 used is just right for the regional cubes used in this study.

Figure 4. (A) I/F at the 2 μm Fensal–Aztlan/Quivira bright region (top) and dark region (bottom). (B) I/F at the 2 μm Fensal–Aztlan/Quivira region after empirical correction for localized cubes adapted from Le Mouélic et al. (2012). (C) Evidence of adjusted correction coefficient (Kcorr = 1.49) with no albedo correlation with absorption band depth.
Download figure:
Standard image High-resolution image2.3. C2H2 Detection Spectral Parameter
The 5 μm window is the least affected by atmospheric scattering of all the infrared windows (Rodriguez et al. 2006), and is appropriate for the detection of the weak C2H2 4.936 μm absorption, even though the signal-to-noise ratios of the VIMS spectra are relatively low in this spectral region where the solar flux decreases. The use of this absorption for detection has been subject to debate, since minor traces of C2H2 may have been identified (Moriconi et al. 2010) on the bright shoreline of Ontario Lacus using this weak absorption, however absence of cross-validation results at low resolution make the identification inconclusive (Clark et al. 2010).
In order to identify the 4.936 μm spectral feature in this noisy part of the VIMS spectra, we first compared spectra extracted from averages of 197 bright pixels from Tui Regio with those of 900 dark pixels from the Shangri La region. Figure 1(C) illustrates that a spectral feature at 4.936 μm can exist on both type of terrains, therefore further interpretation relies on variations of an absorption band depth above the instrument noise level. We calculate an absorption band depth at 4.93 μm with respect to a linear continuum between 4.91 and 4.95 μm. The absorption band depth appears to be larger for dark terrains and weaker for bright terrains (Figures 4 and 5).

Figure 5. (A) Global map of Titan's surface with footprints of the areas studied. (1) The Fensal–Aztlan/Quivira region; (2) and (3) Tui Regio. (B) VIMS images of Tui Regio and eastern Shangri La at 2.0 μm, and absorption band depth at 1.55 and 4.93 μm, respectively. (C) VIMS image of Fensal–Aztlan/Quivira at 2.0 μm and absorption band depth at 1.55 and 4.93 μm, respectively.
Download figure:
Standard image High-resolution image
In order to claim detection of C2H2, we defined a conservative criterion that combines both the 1.55 and 4.93 μm absorption bands:
- 1.The 1.55 μm band depth must be greater than 0.5 (which is above the detection threshold of 3 times the band depth calculated from the pure atmospheric absorption band depth).
- 2.The 4.93 μm absorption band depth has to be greater than the noise level, which we estimate to be 0.3 by calculating 3σ statistics on the 5 μm band over the averaged pixels.
- 3.Both absorption bands have to co-exist in the same spectrum.
- 4.The spatial distribution of the two absorption bands must define spatially coherent units.
- 5.They must not be correlated with the surface albedo.
Thus, we define a spectral detection criterion as (BDλ − 0.51) ∗ (BDλ − 0.3), where BDλ is the absorption band depth at wavelength λ = 1.55 μm and λ = 4.93 μm, respectively. A strictly positive spectral criterion value indicates the presence of both absorption bands at 1.55 and 4.93 μm, and thus a positive detection of C2H2. A spectral criterion value of 0 indicates the absence of one or both of the 1.55 or 4.93 μm absorption bands (Figures 5(B), (C)). We used only spectral data obtained at favorable geometries (incidence and emergence angles generally lower that 60°), thus in the equatorial regions of Titan, because the polar regions usually present extreme observing conditions with a long optical path through the atmosphere.
3. DISTRIBUTION OF C2H2 ON TITAN
We selected three regions on Titan: Shangri La, Tui Regio, and Fensal–Aztlan/Quivira.
Tui Regio is a large equatorial basin including several channels and small depressions, suspected to be an ancient sea (Moore & Howard 2010). It appears bright at all wavelengths and exceptionally bright at 5 μm, which has been interpreted as being due to enrichment in evaporite deposits (MacKenzie et al. 2014). From thermodynamic calculations Cordier et al. (2013, 2015) demonstrated that C2H2 should be a major dissolved component in the lakes and should crystallize mainly in the upper part of evaporite deposits present in dried out depressions, possibly mixed with other organics such as butane due to the high solubility in Titan liquids.
The results from our investigation indicate no detectable C2H2 at Tui Regio (Figure 5(B)). The absence of C2H2 at Tui Regio indicates it may not be an evaporite deposit, whereas it maybe rather consistent with cryovolcanic flows, as suggested by Barnes et al. (2006). Alternatively, Tui Regio could have had an evaporitic origin in the past, which could explain why no lakes have been observed to date, and then C2H2 deposits may have been covered by other products accumulated at the surface.
The evaporation and condensation is suspected to be an important process to shape Titan's landscape and redistribute and/or segregate organics on Titan's surface (Cornet et al. 2015; Cordier et al. 2015; Mckenzie et al. 2014). However, drying-up of a liquid does not always involve the creation of an evaporite. They only form when the solution becomes saturated and the dominant mechanism for liquid removal is evaporation (MacKenzie et al. 2014). Maintaining saturation and evaporation-dominant removal is difficult, especially if the amount of time is less than time required for the saturation to take place. Thus, over the geologic timescales and due to uncertainty in C2H2 saturation at the Tui Regio basin, we cannot put constraints on the presence of C2H2. At Tui Regio, liquids may have been present at some time in Titan's history, but C2H2 may have been buried under a thick enough layer of other dominant 5 μm bright organic compounds to mask its spectral signature. Another possibility is that C2H2 is in fact present on Tui Regio in very low quantities and the spectral signature is beyond the capability of the VIMS spatial resolution and does not pass through our detection criteria.
On the other hand, evaporation in small lakes and ponds is a gentle process and would leave some irregularities like pebbles, evaporitic crusts, macroscopic crystals, that could produce high albedo, and this has been speculated in the case of channels observed by Cassini near the Shangri La region (Le Gall et al. 2010). Shangri La is a large dark dune field located close to the Adiri bright region. The Huygens probe landed in 2005 January at the border between Adiri and Shangri La on a dry lake-bed (Tomasko et al. 2005; Soderblom et al. 2007), in what appears as the dark-blue terrain in VIMS data (Rodriguez et al. 2006, 2014). While the DISR reported an unidentified absorption at 1.54–1.55 μm (Keller et al. 2008; Schröder & Keller 2008), close to the one we report in the present paper, the GCMS detected traces of C2H2 close to the surface (Niemann et al. 2010). The region investigated here is the eastern part of Shangri La that shares a boundary with the bright Xanadu region. Here, our detection of C2H2 is the strongest (Figure 5) and the detection map shows the general presence of C2H2 in the dark terrains.
The Fensal–Aztlan/Quivira region has a high spectral diversity. It comprises the Fensal and Aztlan dune fields (Rodriguez et al. 2014) as well as high-albedo areas such as the Quivira or Sinlap crater (Le Mouélic et al. 2008), where dark-blue infrared units are suspected to be enriched in fine grain water ice compared to to the rest of Titan's surface (Rodriguez et al. 2006). McCord et al. (2008), Soderblom et al. (2007), Barnes et al. (2008), and Rodriguez et al. (2014) showed that the dunes' infrared spectrum is inconsistent with that of water ice. Radar measurements also confirm that the dunes' composition cannot be composed of mainly water ice. Barnes et al. (2008) and Rodriguez et al. (2014) show that the spectrum of this area broadly matches various organics. Our results indicate the presence of the C2H2 absorption band in the dark terrain observed in the Fensal–Aztlan/Quivira region where the dunes are observed. While low-albedo areas exhibit strong C2H2 absorption bands, the detection on high-albedo areas is ambiguous. Therefore, according to our band-depth mapping analysis we conclude that C2H2 is present in most of the dark components in the dune fields, which is consistent with the presence of organics as predicted (Figure 5(C)).
4. DISCUSSION AND CONCLUSIONS
Over geological times, tens of meters thick layers of atmospheric materials may have been accumulated onto Titan's surface (Wilson 2004; Lavvas et al. 2008a, 2008b). The detection of C2H2 on the surface of Titan confirms this hypothesis and opens new paths to understand Titan's surface activity. Refined models for organic and nitrile photochemistry led to estimate depositions of ∼25 m (Lavvas et al. 2008a, 2008b), 28 m (Wilson 2004), and ∼92 m (Yung et al. 1984) of C2H2 over 4.5 Gyr and a 125 times lesser amount of cyanoacetylene and benzene (Yung et al. 1984; Raulin 1987; Vuitton et al. 2006, 2008). If cyanoacetylene and benzene are present in the dark terrains as suggested by Clark et al. (2010), C2H2 should also be present in a greater amount in the same regions. Our detection of C2H2 in dark terrains is consistent with the prediction of C2H2 at the surface from various models. However, over geological time, C2H2 would be expected to migrate away from the equatorial regions to polar regions, unless another process is at work that redistributes C2H2 and is somehow primarily operative in moving material from bright to dark areas. Erosional processes may preferentially transport and concentrate certain compounds such as benzene, as mentioned by Clark et al. (2010), and C2H2 as in this study.
C2H2 is highly soluble in Titan's liquid methane and ethane (Glein & Shock 2013; Cordier et al. 2015; Singh et al. 2015b), intermediate to the solubility of calcite and gypsum in water on Earth's surface. This property implies the existence dynamic surface processes: (1) erosion, through carving of fluvial channels and the formation of karstic lakes at high latitudes on Titan; (2) transport from the surface of continents after a rainstorm by surface runoff; and (3) sedimentation to the bottom of lakes and oceans. The erosion of C2H2 from higher terrains to lower terrains is can occur on Titan and supports our observation of C2H2 on dark terrains (flat areas). C2H2 should be abundant on Titan, which implies that C2H2-rich sedimentary rocks would be susceptible to chemical reaction, and C2H2 evaporites may form on Titan.
Subsequent drainage and evaporation of lakes and oceans could expose sedimentary floors made of C2H2-rich rocks, which would be susceptible to remobilization by chemical reactions and aeolian erosion, compatible with the presence of C2H2 on sand dune regions of Titan. This hypothesis supports the absence of C2H2 on high elevation/bright terrains, because all the C2H2 may have been removed, either to dark terrains or to the bottom of oceans, by dissolving in liquid methane or ethane. This might be the reason for the lack of physical detection of C2H2 until now. Although C2H2 ice has a high albedo (Singh et al. 2015b), and thus was expected to be more abundant on bright, high elevation areas, its presence in low-albedo areas (Figure 5) suggests that C2H2 is mixed with low-albedo materials, such as Titan aerosols and organic compounds. Overall, thermodynamically, C2H2 should migrate and accumulated in the polar regions, but due to the limitations of the RT model and the empirical scattering model, we only limit our observations to equatorial regions.
We acknowledge funding to support this work from the NASA Cassini mission and NASA outer planet research grant # NNX10AE10G. We also acknowledge financial support from the UnivEarthS LabEx program of Sorbonne Paris Cité (ANR-10-LABX-0023 and ANR-11-IDEX-0005-02), the French National Research Agency (ANR-APOSTIC-11-BS56-002 and ANR-12-BS05-001-03/EXO-DUNES), and the CNES.