


ABSTRACT
We use the combined data from the COS-GASS and COS-Halos surveys to characterize the Circum-Galactic Medium (CGM) surrounding typical low-redshift galaxies in the mass range  , and over a range of impact parameters extending to just beyond the halo virial radius (Rvir). We find the radial scale length of the distributions of the equivalent widths of the Lyα and Si iii absorbers to be ∼1 and ∼0.4 Rvir, respectively. The radial distribution of equivalent widths is relatively uniform for the blue galaxies, but highly patchy (i.e., it has a low covering fraction) for the red galaxies. We also find that the Lyα and Si iii equivalent widths show significant positive correlations with the specific star formation rate (sSFR) of the galaxy. We find a surprising lack of correlations between the halo mass (virial velocity) and either the velocity dispersions or velocity offsets of the Lyα lines. The ratio of the velocity offset to the velocity dispersion for the Lyα absorbers has a mean value of ∼4, suggesting that a given line of sight is intersecting a dynamically coherent structure in the CGM, rather than a sea of orbiting clouds. The kinematic properties of the CGM are similar in the blue and red galaxies, although we find that a significantly larger fraction of the blue galaxies have large Lyα velocity offsets (>200 km s−1). We show that—if the CGM clouds represent future fuel for star formation—our new results could imply a large drop in the sSFR across the galaxy mass-range we probe.
Export citation and abstract BibTeX RIS
1. INTRODUCTION
Galaxy growth is fundamentally connected to the cycle of accretion and ejection of matter into and out of galaxies. In the simplest picture, galaxies acquire gas that reaches the central regions via the circum-galactic medium (CGM). There, it condenses into neutral and then molecular gas, some of which is then converted into stars. Young stars, in turn, drive strong winds, outflows, and radiation that deposit mass, metals, energy, and momentum to the CGM, thus significantly influencing its properties (see review by Somerville & Davé 2015; Fielding et al. 2016, and references therein). These linked processes are commonly termed the baryon cycle. The CGM then lies at the heart of this cycle, as it is the interface between the stellar body of the galaxy and the intergalactic medium. It is the primary spatial pathway for the baryon cycle into and out of galaxies (Tumlinson et al. 2013; Brook et al. 2014; Shen et al. 2014; Borthakur et al. 2015; Mitra et al. 2015; Nielsen et al. 2015; Ford et al. 2016, and references therein).
The CGM is also a reservoir of low-density gas that may have as much mass as the stellar component of the galaxy (Tumlinson et al. 2013; Werk et al. 2013, 2014; Peeples et al. 2014; Richter et al. 2016). It extends out from the stellar disk out to the virial radius of the galaxy (Chen et al. 2001a; Borthakur et al. 2013; Stocke et al. 2013). However, due to its low surface-brightness, we have not yet been able to directly image this vast baryonic reservoir. On the other hand, absorption-line spectroscopy provides an avenue to probe the physical conditions in this low-density gaseous medium. Rest-frame ultra-violet (UV) spectroscopy enables us to use various absorption-line transitions, including hydrogen and metal-line species spanning a broad range of ionization states.
Mapping the CGM with the help of a large sample of sightlines probing a range of impact parameters is crucial for understanding its properties and its variations as a function of radius. The radial dependence in the properties of the neutral hydrogen in the CGM has been known for decades, based on observations of the Lyα absorption-line (Lanzetta et al. 1995; Chen et al. 1998; Tripp et al. 1998; Chen et al. 2001b; Bowen et al. 2002; Prochaska et al. 2011; Stocke et al. 2013; Tumlinson et al. 2013; Liang & Chen 2014; Borthakur et al. 2015, and references therein). However, only recently, with the installation of Cosmic Origins Spectrograph (COS) aboard the Hubble Space Telescope (HST), has it become feasible to undertake detailed probes of the CGM properties as a function of other global properties of the central galaxy.
One of the consequences of the accretion of gas passing through the CGM is that it provides the raw material to sustain the growth of the galaxy via star formation (e.g., Bouché et al. 2013). Not all galaxies produce stars at the same rate (Brinchmann et al. 2004; Daddi et al. 2007; Noeske et al. 2007; Salim et al. 2007; Rodighiero et al. 2011; Speagle et al. 2014; Snyder et al. 2015). In particular, galaxies show two distinct populations in terms of their star formation rate (SFR). Although most low-mass galaxies form stars at significant rates, most high-mass galaxies produce stars at negligible levels. This was termed the galaxy color bimodality, defined in terms of "blue" (star-forming) galaxies and "red" (quiescent) galaxies (e.g., Tully et al. 1982; Blanton et al. 2003; Kauffmann et al. 2003; Baldry et al. 2004; Brinchmann et al. 2004).
About a decade ago, cosmological hydrodynamical simulations revealed two distinct ways that galaxies accrete gas into their dark matter halo as a function of halo mass. The predominant mode of gas accretion for low-mass galaxies is believed to be the "cold" mode (Kereš et al. 2005, 2009; Dekel et al. 2009), where gas falls into galaxies as streams or lumps at temperatures much less than that of the virial temperature. For the higher-mass halos, the accretion process is expected to be in the "hot" mode (White & Frenk 1991; Fukugita & Peebles 2006), in which the incoming gas shock heats to the virial temperature. This broadly can explain why high-mass galaxies have little-to-no cold gas reservoirs to fuel star formation (see work on condensation in hydrodynamical simulations by Kaufmann et al. 2006, 2009; Sommer-Larsen 2006). Galaxies also recycle gas from previous generations of star formation that is stored in their CGM (Ford et al. 2013; Fraternali et al. 2015). However, the process of how gas gets into the disk from the CGM is fairly complex. Nonlinear perturbations in the filamentary flows may help the cool accreting gas condense and add cold gas to the disk (Kereš & Hernquist 2009; Joung et al. 2012a). These condensing clouds may contain as much as 25%–75% of the cold gas in the CGM (Fernández et al. 2012).
In addition to accretion, feedback driven by star formation may change the nature and properties of the gas in the CGM (Marasco et al. 2015; Nelson et al. 2015, 2016; Kauffmann et al. 2016; Liang et al. 2016). Massive young stars inject energy and/or momentum into outflows (Veilleux et al. 2005; Heckman et al. 2011; Borthakur et al. 2014; Heckman et al. 2015; Heckman & Borthakur 2016) that may travel into the CGM, enriching it with metals, shock-heating the cooler CGM clouds, and possibly even expelling/unbinding the CGM (Borthakur et al. 2013). Therefore, if feedback provided by massive stars plays a role in the observed bimodality, then we should see a change in the structure, ionization state, and/or kinematics of the CGM as a function of SFR.
To that end, we have selected a subsample of galaxies from the Galaxy Evolution Explorer (GALEX) Arecibo Sloan Digital Sky Survey (SDSS) Survey (GASS; Catinella et al. 2010, 2012, 2013) that have background UV-bright quasi-stellar objects (QSOs) located within a projected distance of 250 kpc in the rest-frame of the galaxy. This yielded the COS-GASS sample (Borthakur et al. 2015) whose members were observed with COS, using the G130M grating. This provided a spectral R = 20,000–24,000 (FWHM ∼ 12 to 15 km s−1). We have multi-band data for these galaxies from the parent GASS survey: 21 cm H i spectroscopic data obtained with the Arecibo telescope, optical images and spectroscopy from the SDSS, UV imaging with the GALEX, molecular gas data from IRAM (COLD GASS; Saintonge et al. 2011), and long-slit optical spectroscopy (Moran et al. 2012) for a portion of the sample. Therefore, we have the stellar mass, SFR, gas-phase metallicity, stellar morphology, and atomic and molecular gas masses for all 45 galaxies from the COS-GASS sample.
Here, we present our study, which utilizes the combined COS-GASS (Borthakur et al. 2015) and COS-Halos (Tumlinson et al. 2013) samples. Detailed descriptions of our sample, the COS observations and data reduction are presented in Section 2. The results are presented in Section 3, and their implications are discussed in Section 4. Finally, we summarize our findings in Section 5. The cosmological parameters used in this study are  (in between the two recent measurements of
  (Riess et al. 2016) and
  (Grieb et al. 2016)) ,
  , and
, and  . We note that varying the Hubble constant value from
  does not affect the conclusions in the paper.
2. OBSERVATIONS
2.1. Sample
We combined the COS-GASS sample (45 galaxies) with the COS-Halos sample (44 galaxies) to get our full sample. The COS-Halos sightlines cover the inner CGM (thoroughly up to ∼0.8 Rvir) whereas the COS-GASS sightlines extend the observations to the outer CGM (∼0.2–1.5 Rvir). The resulting combined sample contains a total of 89 sightlines probing the CGM from 17 to 231 kpc in the rest frame of the target galaxies.
The two programs probe similar stellar mass ranges. The COS-Halos program probes galaxies in the range  at
at  , whereas the COS-GASS program probes galaxies in the range (
 ) at slightly lower redshifts of
  . A comparison of the stellar masses and virial radii (based on the prescription by Kravtsov et al. 2014 and Liang & Chen 2014) for both samples are provided in Figure 1. Recent gravitational-lensing-based results by Mandelbaum et al. (2016) show that blue galaxies of fixed stellar mass are found in lower mass halos than red galaxies of the same stellar mass. Based on their results, we add or subtract 0.15 dex to the halo masses for red or blue galaxies, respectively, with a given stellar mass. The dark matter halo masses of the combined sample range from 11.1 to 13.2 M⊙ dex. We note that the redshift difference between the two samples is ∼0.1. However, the variation in CGM properties during this time is expected to be minimal (Chen 2012). Also, the COS-Halos sample was selected to be all centrals (with a couple of non-centrals Tumlinson et al. 2013, Section 2.5). This is not one of the criteria for COS-GASS, although the mass range of the galaxies ensured that most of the COS-GASS galaxies (34/45) are centrals (based on the group catalog by Yang et al. 2005, 2007). Thus, the combined sample is 85% centrals. We have retained the satellites in our analysis, but verified that they do not affect any of our conclusions.
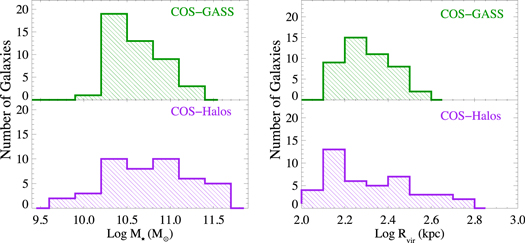
Figure 1. Distribution of galaxy properties for the COS-GASS and COS-Halos samples. The left panel shows the stellar mass distribution, and the right panel shows the virial radius distribution. The Rvir for both samples were estimated using the prescription described by Kravtsov et al. (2014), Mandelbaum et al. (2016), and Liang & Chen (2014), as described in Section 2.1.
Download figure:
Standard image High-resolution imageWe identify galaxies with specific star formation rates (sSFR = SFR/M⋆) > 10−11 yr−1 as blue (star-forming) galaxies, and those below this limit as red (quiescent) galaxies. sSFR values of <10−12 yr−1 can be considered as upper limit. A detailed description of our galaxy color assignment can be found in Borthakur et al. (2015).
For more information on the properties of the target galaxies, including their redshifts, stellar masses, SFRs13 , sSFR, galaxy colors, and impact parameter of the sightlines, we refer the reader to Table 1 presented in this paper (for the COS-GASS sample) and Table 2 from the published work by Tumlinson et al. (2013).
Table 1. Description of Galaxy Properties for the COS-GASS Surveya
| Galaxy | GASS ID | R.A. | Decl. | zgal | M⋆ | Mhalob | Rvirc | sSFR | Colord | vesc,Rvire |
|---|---|---|---|---|---|---|---|---|---|---|
| (Log M⊙) | (Log M⊙) | (kpc) | (Log yr−1) | (km s−1) | ||||||
| J0159+1346 | 3936 | 29.941 | 13.781 | 0.0441 | 10.1 | 11.4 | 153 | −9.5 | Blue | 114 |
| J0808+0512 | 19852 | 122.068 | 5.216 | 0.0308 | 10.8 | 12.2 | 296 | −12.0 | Red | 217 |
| J0852+0309 | 8096 | 133.229 | 3.152 | 0.0345 | 10.3 | 11.5 | 166 | −10.1 | Blue | 122 |
| J0908+3234 | 22391 | 137.232 | 32.576 | 0.0490 | 10.5 | 11.9 | 232 | −12.3 | Red | 174 |
| J0914+0836 | 20042 | 138.684 | 8.601 | 0.0468 | 10.0 | 11.3 | 147 | −9.6 | Blue | 110 |
| J0930+2853 | 32907 | 142.538 | 28.898 | 0.0349 | 10.5 | 11.6 | 184 | −10.7 | Blue | 136 |
| J0931+2632 | 53269 | 142.817 | 26.550 | 0.0458 | 11.0 | 12.4 | 345 | −12.6 | Red | 258 |
| J0936+3204 | 33214 | 144.101 | 32.079 | 0.0269 | 10.3 | 11.8 | 217 | −11.7 | Red | 158 |
| J0937+1658 | 55745 | 144.292 | 16.977 | 0.0278 | 10.9 | 12.0 | 263 | −10.3 | Blue | 192 |
| J0951+3537 | 22822 | 147.937 | 35.622 | 0.0270 | 10.6 | 11.7 | 197 | −10.4 | Blue | 143 |
| J0958+3204 | 33737 | 149.714 | 32.073 | 0.0270 | 10.7 | 12.1 | 272 | −12.7 | Red | 198 |
| J1002+3238 | 33777 | 150.711 | 32.645 | 0.0477 | 10.1 | 11.7 | 191 | −11.9 | Red | 143 |
| J1013+0501 | 8634 | 153.352 | 5.025 | 0.0464 | 10.1 | 11.4 | 153 | −10.8 | Blue | 115 |
| J1032+2112 | 55541 | 158.196 | 21.216 | 0.0429 | 10.6 | 11.7 | 202 | −10.1 | Blue | 150 |
| J1051+1245 | 23419 | 162.827 | 12.757 | 0.0400 | 10.4 | 11.5 | 175 | −10.0 | Blue | 130 |
| J1059+0517 | 9109 | 164.811 | 5.292 | 0.0353 | 11.1 | 12.6 | 387 | −11.9 | Red | 284 |
| J1100+1210 | 23457 | 165.048 | 12.171 | 0.0354 | 10.1 | 11.4 | 154 | −10.7 | Blue | 114 |
| J1100+1043 | 23477 | 165.200 | 10.728 | 0.0360 | 11.1 | 12.3 | 313 | −11.0 | Blue | 231 |
| J1115+0241 | 5701 | 168.789 | 2.699 | 0.0442 | 10.7 | 11.8 | 218 | −10.9 | Blue | 162 |
| J1120+0410 | 12452 | 170.026 | 4.177 | 0.0492 | 10.8 | 12.2 | 296 | −12.1 | Red | 222 |
| J1122+0314 | 5872 | 170.642 | 3.244 | 0.0446 | 10.5 | 11.9 | 239 | −12.0 | Red | 178 |
| J1127+2657 | 48604 | 171.943 | 26.960 | 0.0334 | 10.6 | 11.7 | 201 | −11.0 | Blue | 147 |
| J1131+1553 | 29898 | 172.954 | 15.897 | 0.0364 | 10.2 | 11.7 | 199 | −12.0 | Red | 147 |
| J1132+1329 | 29871 | 173.052 | 13.492 | 0.0342 | 10.2 | 11.4 | 158 | −9.7 | Blue | 116 |
| J1142+3013 | 48994 | 175.575 | 30.230 | 0.0322 | 10.7 | 11.8 | 222 | −10.4 | Blue | 163 |
| J1155+2921 | 49433 | 178.903 | 29.351 | 0.0458 | 10.5 | 11.6 | 180 | −10.3 | Blue | 135 |
| J1241+2847 | 50550 | 190.367 | 28.791 | 0.0350 | 10.3 | 11.5 | 166 | −10.0 | Blue | 123 |
| J1251+0551 | 13074 | 192.894 | 5.864 | 0.0486 | 10.9 | 12.0 | 242 | −10.4 | Blue | 182 |
| J1305+0359 | 13159 | 196.356 | 3.992 | 0.0437 | 10.4 | 11.5 | 172 | −10.8 | Blue | 128 |
| J1315+1525 | 26936 | 198.855 | 15.423 | 0.0266 | 10.7 | 12.1 | 283 | −12.3 | Red | 206 |
| J1317+2629 | 51025 | 199.440 | 26.486 | 0.0450 | 10.3 | 11.4 | 162 | −10.4 | Blue | 121 |
| J1325+2714 | 51161 | 201.345 | 27.249 | 0.0345 | 10.1 | 11.4 | 156 | −9.8 | Blue | 115 |
| J1348+2453 | 38018 | 207.142 | 24.891 | 0.0297 | 10.1 | 11.3 | 153 | −10.5 | Blue | 112 |
| J1354+2433 | 44856 | 208.546 | 24.556 | 0.0286 | 10.1 | 11.6 | 191 | −11.8 | Red | 139 |
| J1404+3357 | 31172 | 211.122 | 33.953 | 0.0264 | 10.3 | 11.8 | 211 | −12.3 | Red | 154 |
| J1406+0154 | 7121 | 211.678 | 1.915 | 0.0472 | 10.2 | 11.7 | 202 | −11.8 | Red | 152 |
| J1427+2629 | 45940 | 216.954 | 26.484 | 0.0325 | 10.4 | 11.9 | 225 | −12.0 | Red | 165 |
| J1430+0323 | 9615 | 217.508 | 3.398 | 0.0333 | 10.2 | 11.7 | 197 | −11.1 | Red | 145 |
| J1431+2440 | 38198 | 217.894 | 24.682 | 0.0378 | 10.7 | 12.1 | 261 | −12.7 | Red | 193 |
| J1454+3050 | 42191 | 223.516 | 30.846 | 0.0320 | 10.1 | 11.4 | 155 | −9.8 | Blue | 114 |
| J1502+0649 | 41743 | 225.517 | 6.823 | 0.0462 | 10.5 | 11.6 | 180 | −10.2 | Blue | 135 |
| J1509+0704 | 41869 | 227.340 | 7.078 | 0.0414 | 10.1 | 11.4 | 155 | −9.6 | Blue | 115 |
| J1515+0701 | 42025 | 228.781 | 7.021 | 0.0367 | 10.9 | 12.3 | 314 | −11.9 | Red | 231 |
| J1541+2813 | 28365 | 235.344 | 28.230 | 0.0321 | 10.4 | 11.5 | 173 | −9.6 | Blue | 127 |
| J1544+2740 | 28317 | 236.034 | 27.673 | 0.0316 | 10.1 | 11.6 | 191 | −12.1 | Red | 140 |
Notes.
aDetails on the COS-Halos survey can be found in the published work by Tumlinson et al. (2013) and Werk et al. (2013). bUsing prescription from Kravtsov et al. (2014) and Mandelbaum et al. (2016). cUsing prescription from Liang & Chen (2014). dGalaxies with sSFR are defined as blue galaxies. Galaxies with sSFR below this value are defined as red galaxies.
eEscape velocity at the virial radii probed by the QSO sightline assuming a NFW profile for the galaxy's dark matter distribution.
are defined as blue galaxies. Galaxies with sSFR below this value are defined as red galaxies.
eEscape velocity at the virial radii probed by the QSO sightline assuming a NFW profile for the galaxy's dark matter distribution.
Download table as: ASCIITypeset image
Table 2. Description of QSO Sightlines and Absorption Line Measurements for the COS-GASS Survey
| QSO | R.A.QSO | Decl.QSO | zQSO | ρ |

|
Θa | WLyαb |
 c
c
|
 d
d
|
 d
d
|

|
 c
c
|
 d
d
|
 d
d
|
|---|---|---|---|---|---|---|---|---|---|---|---|---|---|---|
| (kpc) | (Å) | (km s−1) | (km s−1) | (km s−1) | (Å) | (km s−1) | (km s−1) | |||||||
| J0159+1345 | 29.971 | 13.765 | 0.504 | 102 | 0.7 | 64 | 1.501 ± 0.023 | −150–380 | 93, 358 | 85, 14 | ⋯ | ⋯ | ⋯ | ⋯ |
| J0808+0514 | 122.162 | 5.244 | 0.361 | 215 | 0.7 | 7 | ⋯ | ⋯ | ⋯ | ⋯ | <0.050 | ⋯ | ⋯ | ⋯ |
| J0852+0313 | 133.247 | 3.222 | 0.297 | 178 | 1.1 | 67 | 0.113 ± 0.015 | 0–110 | 50 | 49 | <0.051 | ⋯ | ⋯ | ⋯ |
| J0909+3236 | 137.276 | 32.608 | 0.809 | 170 | 0.7 | 21 | 0.090 ± 0.014 | 50–200 | 101 | 71 | <0.041 | ⋯ | ⋯ | ⋯ |
| J0914+0837 | 138.632 | 8.629 | 0.649 | 189 | 1.3 | 69 | 0.104 ± 0.020 | −50–80 | 30 | 45 | <0.065 | ⋯ | ⋯ | ⋯ |
| J0930+2848 | 142.508 | 28.816 | 0.487 | 214 | 1.2 | 42 | <0.126 | ⋯ | ⋯ | ⋯ | <0.108 | ⋯ | ⋯ | ⋯ |
| J0931+2628 | 142.820 | 26.480 | 0.778 | 226 | 0.7 | 77 | 0.114 ± 0.013 | 150–250 | 200 | 55 | <0.043 | ⋯ | ⋯ | ⋯ |
| J0936+3207 | 144.016 | 32.119 | 1.150 | 160 | 0.7 | 0e | <0.113 | ⋯ | ⋯ | ⋯ | <0.086 | ⋯ | ⋯ | ⋯ |
| J0937+1700 | 144.279 | 17.006 | 0.506 | 63 | 0.2 | 64 | 0.135 ± 0.021 | −300 to −150 | −204 | 67 | <0.056 | ⋯ | ⋯ | ⋯ |
| J0951+3542 | 147.850 | 35.714 | 0.398 | 226 | 1.1 | 3 | 0.839 ± 0.014 | −90–200 | 64 | 59 | ⋯ | ⋯ | ⋯ | ⋯ |
| J0959+3203 | 149.812 | 32.066 | 0.564 | 162 | 0.6 | 0e | 0.420 ± 0.016 | −320 to −100 | −238, −144 | 33,19 | 0.060 ± 0.013 | −300 to −200 | −256 | 12 |
| J1002+3240 | 150.727 | 32.678 | 0.829 | 119 | 0.6 | 40 | <0.063 | ⋯ | ⋯ | ⋯ | <0.062 | ⋯ | ⋯ | ⋯ |
| J1013+0500 | 153.325 | 5.009 | 0.266 | 102 | 0.7 | 0e | 0.445 ± 0.024 | −180–50 | −72 | 49 | 0.088 ± 0.020 | −120–0 | −70 | 20 |
| J1033+2112 | 158.270 | 21.204 | 0.315 | 214 | 1.1 | 45 | 0.437 ± 0.033 | −100–95 | −1 | 50 | <0.065 | ⋯ | ⋯ | ⋯ |
| J1051+1247 | 162.857 | 12.796 | 1.281 | 140 | 0.8 | 73 | 0.781 ± 0.022 | −180–140 | −37 | 75 | ⋯ | ⋯ | ⋯ | ⋯ |
| J1059+0519 | 164.795 | 5.327 | 0.754 | 95 | 0.2 | 30 | 0.270 ± 0.022 | −100–100 | 6 | 44 | <0.062 | ⋯ | ⋯ | ⋯ |
| J1059+1211 | 164.984 | 12.198 | 0.993 | 171 | 1.1 | 61 | 0.225 ± 0.014 | −150–0 | −61 | 26 | <0.045 | ⋯ | ⋯ | ⋯ |
| J1100+1046 | 165.199 | 10.770 | 0.422 | 108 | 0.3 | 0e | ⋯ | ⋯ | ⋯ | ⋯ | ⋯ | ⋯ | ⋯ | ⋯ |
| J1115+0237 | 168.782 | 2.633 | 0.567 | 209 | 1.0 | 83 | 0.195 ± 0.020 | −100–100 | 2 | 37 | 0.065 ± 0.012 | −20–30 | 4 | 20 |
| J1120+0413 | 170.021 | 4.223 | 0.545 | 162 | 0.5 | 78 | 0.830 ± 0.018 | 50–390 | 201, 370 | 73, 21 | 0.172 ± 0.015 | 150–290 | 194 | 26 |
| J1122+0318 | 170.601 | 3.301 | 0.475 | 221 | 0.9 | 0e | 0.110 ± 0.018 | 0–150 | 67 | 58 | ⋯ | ⋯ | ⋯ | ⋯ |
| J1127+2654 | 171.902 | 26.914 | 0.379 | 140 | 0.7 | 26 | 0.705 ± 0.021 | −250–100 | −28, −178 | 54, 30 | 0.051 ± 0.017 | −80–20 | −34 | 12 |
| J1131+1556 | 172.905 | 15.946 | 0.183 | 176 | 0.9 | 0e | ⋯ | ⋯ | ⋯ | ⋯ | ⋯ | ⋯ | ⋯ | ⋯ |
| J1132+1335 | 173.044 | 13.586 | 0.201 | 230 | 1.5 | 5 | 0.319 ± 0.017 | −40–130 | 57 | 55 | <0.043 | ⋯ | ⋯ | ⋯ |
| J1142+3016 | 175.551 | 30.270 | 0.481 | 104 | 0.5 | 50 | 0.886 ± 0.023 | −200–170 | 3 | 67 | 0.227 ± 0.019 | −150–50 | −33 | 53 |
| J1155+2922 | 178.970 | 29.377 | 0.520 | 208 | 1.2 | 1 | 0.742 ± 0.023 | −200–230 | 72, −150 | 60,13 | 0.056 ± 0.015 | 40–160 | 92 | 66 |
| J1241+2852 | 190.374 | 28.870 | 0.589 | 198 | 1.2 | 40 | 0.211 ± 0.020 | −120–170 | 33 | 95 | <0.040 | ⋯ | ⋯ | ⋯ |
| J1251+0554 | 192.853 | 5.906 | 1.377 | 200 | 0.8 | 57 | 0.409 ± 0.021 | −20–180 | 80 | 51 | <0.063 | ⋯ | ⋯ | ⋯ |
| J1305+0357 | 196.351 | 3.959 | 0.545 | 103 | 0.6 | 11 | 0.821 ± 0.016 | −160–180 | 67, −43 | 48, 59 | ⋯ | ⋯ | ⋯ | ⋯ |
| J1315+1525 | 198.938 | 15.432 | 0.448 | 155 | 0.5 | 17 | 0.405 ± 0.018 | −50–170 | 64 | 48 | 0.131 ± 0.017 | 0–150 | 49 | 48 |
| J1318+2628 | 199.508 | 26.475 | 1.234 | 198 | 1.2 | 86 | 0.184 ± 0.032 | −120–120 | 0 | 50 | ⋯ | ⋯ | ⋯ | ⋯ |
| J1325+2717 | 201.266 | 27.289 | 0.522 | 199 | 1.3 | 55 | ⋯ | ⋯ | ⋯ | ⋯ | <0.095 | ⋯ | ⋯ | ⋯ |
| J1348+2456 | 207.093 | 24.947 | 0.293 | 153 | 1.0 | 81 | 0.474 ± 0.035 | −230 − 0 | −97 | 76 | <0.073 | ⋯ | ⋯ | ⋯ |
| J1354+2430 | 208.604 | 24.502 | 1.878 | 155 | 0.8 | 78 | 0.545 ± 0.034 | −170 − 50 | −97, −5 | 37,26 | <0.084 | ⋯ | ⋯ | ⋯ |
| J1404+3353 | 211.118 | 33.895 | 0.549 | 111 | 0.5 | 57 | 0.749 ± 0.027 | −150–150 | −26 | 75 | 0.177 ± 0.024 | 0–150 | 37 | 45 |
| J1406+0157 | 211.732 | 1.954 | 0.427 | 222 | 1.1 | 67 | ⋯ | ⋯ | ⋯ | ⋯ | <0.061 | ⋯ | ⋯ | ⋯ |
| J1427+2632 | 216.898 | 26.537 | 0.364 | 170 | 0.8 | 0e | ⋯ | ⋯ | ⋯ | ⋯ | <0.078 | ⋯ | ⋯ | ⋯ |
| J1429+0321 | 217.420 | 3.357 | 0.253 | 231 | 1.2 | 0e | 0.807 ± 0.027 | −150–250 | −39, 109 | 68, 104 | 0.052 ± 0.017 | −50–50 | −21 | 42 |
| J1431+2442 | 217.858 | 24.706 | 0.407 | 110 | 0.4 | 18 | 0.569 ± 0.015 | 0–220 | 73,156 | 40,28 | <0.048 | ⋯ | ⋯ | ⋯ |
| J1454+3046 | 223.601 | 30.783 | 0.465 | 223 | 1.4 | 37 | 0.472 ± 0.035 | −50–160 | 57 | 47 | <0.079 | ⋯ | ⋯ | ⋯ |
| J1502+0645 | 225.517 | 6.754 | 0.288 | 224 | 1.2 | 80 | 0.438 ± 0.013 | −150–110 | 12, −55 | 38,72 | <0.032 | ⋯ | ⋯ | ⋯ |
| J1509+0702 | 227.368 | 7.043 | 0.418 | 130 | 0.8 | 62 | 0.956 ± 0.022 | −275–130 | 49, −18, −215 | 29, 84, 30 | 0.137 ± 0.011 | −275 to −195 | −239 | 21 |
| J1515+0657 | 228.781 | 6.952 | 0.268 | 180 | 0.6 | 14 | 0.270 ± 0.023 | −500 to −300 | −367 | 43 | <0.061 | ⋯ | ⋯ | ⋯ |
| J1541+2817 | 235.340 | 28.285 | 0.376 | 128 | 0.7 | 0e | 0.864 ± 0.011 | −520 to −250 | −363 | 90 | <0.039 | ⋯ | ⋯ | ⋯ |
| J1544+2743 | 236.114 | 27.723 | 0.163 | 196 | 1.0 | 55 | 0.191 ± 0.022 | 50–210 | 126 | 69 | <0.064 | ⋯ | ⋯ | − |
Notes.
aOrientation of the QSO sightlines with respect to the disk of the galaxies. The values are based on SDSS r-band photometric measurements. bLimiting equivalent width denotes 3σ uncertainity. cFull width of the absorption feature in the rest-frame of the galaxy. dCentroid and b-value of the multiple components of the Lyα and Si iii absorption feature, as estimated via Voigt profile fit. These are printed in the order of each component's strength. Redshift of the absorber zabs = zgal + vtransition/c, where is the systemic redshift of the galaxy (from Table 1) and c is the speed of light in vacuum.
eFace-on galaxies.
is the systemic redshift of the galaxy (from Table 1) and c is the speed of light in vacuum.
eFace-on galaxies.
Download table as: ASCIITypeset image
2.2. Observations and Data Reduction
The data presented in this paper were obtained under the COS-GASS survey (program = 12603; P.I. Heckman) observed with the COS aboard the HST using the high-resolution grating G130M (R = 20,000–24,000 ; FWHM = 12–15 km s−1). The wavelength coverage of the spectrograph is 1140–1470 Å. The galaxies being at lower redshift (maximum redshift of 0.05) allows us to probe a wide variety of far-UV line transitions such as Lyα ( ), Si ii (
 ), Si iii (
 ), Si iv (
 ), C ii (
 ), and O i (
 ).
).
Absorption features that have equivalent widths larger than triple the noise in the spectra were picked out, and then identified both in terms of the transition and redshift. This allowed us to detect any contamination to the absorption associated with the target galaxies. We searched in a velocity window of ±600 km s−1 from the systemic velocity (using optimal redshift from SDSS that is tracing the stars and ionized gas in the central region of the galaxies) for associated absorbers. The absorbers were measured and Voigt profile fits were performed. More information on the data reduction can be found in the previous publication of COS-GASS (Borthakur et al. 2015). This procedure is identical to that followed by Tumlinson et al. (2013) and Werk et al. (2013) for the COS-Halos program.
3. RESULTS
The COS-GASS survey covered a wavelength range of ≈1150–1450 Å for most galaxies. This includes the prominent transitions like H i Lyα λ1216, O i λ1302, C ii λ1334, Si ii λ1260, 1193, 1190, Si iiiλ1206, Si ivλλ 1393, 1402, and N vλ1239. H i Lyα and Si iii λ1206 are the strongest lines detected in our sample. In this paper, we will primarily focus on these, the two most sensitive probes. A paper presenting all the other metal-lines detected in COS-GASS survey is in preparation. Table 2 presents the measurements for Lyα and Si iii for each of the sightlines from the COS-GASS sample. In cases where we do not detect any absorption features, we quote a 3σ equivalent width as the upper limit. The detection limits for the COS-GASS sample are typically ∼50 mÅ, which corresponds to Log N(H i) = 12.96, Log N(Si ii) = 12.55, Log N(Si iii) = 12.37, Log N(Si iv) = 13.05, and Log N(C ii) = 13.39, respectively.
The measurements for COS-Halos sightlines can be found in the published work by Werk et al. (2013).
3.1. Overall Detection Rates
The Lyα absorption-line, produced by neutral Hydrogen, is the strongest transition found in the combined data. Lyα absorption was detected in 75/82 ( ) sightlines where measurements could be made. This detection rate is consistent with those found by Prochaska et al. (2011), Stocke et al. (2013), Liang & Chen (2014). Often, the absorption features are saturated; hence, we use the equivalent width for our analysis, as we are not able to accurately determine the column densities of these absorbers. The Lyα is primarily tracing gas at a temperature of
  (based on the Doppler widths14
).
(based on the Doppler widths14
).
The Si iii λ1206.5 absorption-line is the strongest feature tracing metals in the COS-GASS survey, thus making it the most sensitive tracer of the warm CGM (also see Collins et al. 2009; Shull et al. 2009; Lehner et al. 2012, 2015; Richter et al. 2016). Out of 37 sightlines for the COS-GASS sample, where data were uncontaminated and measurements could be made, we detected Si iii in 11 of them. Thus, the detection rate of Si iii in the outer halo is 30 ± 10%. This is smaller than results for the inner CGM, as found by (COS-Halos survey; Werk et al. 2013), Liang & Chen (2014) and Richter et al. (2016).15
Because our study primarily focuses on the outer CGM ( with the exception of two inner sightlines), a more relevant comparison would be the covering fraction of Si iii of
  % for sightlines with 0.54
  by Liang & Chen (2014). Both the numbers are broadly consistent, given that the error ranges in the estimate do have an overlap. Interestingly, the two inner sightlines in the COS-GASS sample, which one might naively presume are contributing the excess in our detection rate, are devoid of any Si iii absorption. However, in the broad context of metals in the outer CGM, our study find consistently lower metal covering fraction thus suggesting that metals are rarer in the outer CGM similar to conclusions of Liang & Chen (2014) and Bordoloi et al. (2014, for C iv from the COS-Dwarfs survey). The combined sample has a detection rate of Si iii of 49 ± 10%.
The detection rate of C ii, Si ii, and Si iv in the COS-GASS sample is 20 ± 8%, 7 ± 5%, and 9 ± 5% respectively. These are much smaller than that of the detection rate of Si iii, although we note that, in some sightlines, the Si ii λ 1260 Å was corrupted by the geocoronal O i emission feature; hence, they suffer from small number statistics. Our sensitivity is higher for Si iii, as compared to similar columns of Si ii and Si iv. Therefore, a fair comparison is to compare the detection rate at the same column density. For example, we detected 6/31 (16 ± 7%) Si iii absorbers with equivalent widths above the 0.077 Å corresponding to a column density of Log N(Si iii) = 12.55. At this same column density sensitivity, the detection rate of Si ii is less than half that of Si iii. However, the same argument cannot be applied to Si iv, because our sensitivity to Si iv is about an-order-of-magnitude lower, although none of the Si iii absorbers have associated Si iv absorption.
Most of the Si iii absorbers are tracing warm intermediate ionization circumgalactic gas. We find the observed line ratios of Si ii, Si iii, Si iv, and Lyα from the COS-GASS sample to be consistent with photoionization of the CGM by the cosmic ultraviolet background. We expect the CGM in the outer halo, as traced by Si iii, to have an ionization parameter, U, of −2.8 < log U < −1.7, although the exact upper bound is hard to set, given the saturation of Lyα and non-detection of Si iv. Similar ionization parameters were also estimated by Shull et al. (2009) for Si iii associated with the high- and intermediate-velocity clouds (HVC, IVC) in the Milky Way halo.16
This value of ionization parameter is lower that required to produce a substantial amounts of O vi and C iv absorbers for the observed Lyα column densities of  that are seen in our sample. Therefore, it is likely that most of these highly ionized absorbers are different from those detected in various other CGM and QSO-absorption studies (Chen et al. 2001a; Wakker & Savage 2009; Tumlinson et al. 2011; Borthakur et al. 2013; Bordoloi et al. 2014, and references therein). However, as discussed in detail by Werk et al. (2014), Fox et al. (2013), Meiring et al. (2013), Lehner et al. (2013), Tripp et al. (2011), and references therein, O vi may represent a different phase of gas that differs from the ones traced by lower ionization transitions. Because the COS-GASS data do not cover the O vi line, we refrain from further discussion of O vi. Instead, we focus on Lyα and Si iii in the remainder of the paper.
3.2. An Overview of the CGM Properties
We begin by summarizing the basic structural and kinematic properties of the CGM. Later, we will consider the dependence of these properties on the star-forming characteristics of the central galaxy.
3.2.1. Structure
The dark matter halo mass of the galaxy should influence the size and kinematic properties of the CGM (Hummels et al. 2012; Ford et al. 2016, and references therein). For example, it is expected that a galaxy with a larger halo mass could contain a more massive CGM and gravitationally bind it to larger radii (Chen et al. 2001b). In order to explore the radial profile of the CGM while accounting for the large range in halo mass, we use the variable ρ/Rvir, which we refer to as the normalized impact parameter (e.g., Stocke et al. 2013). This parameter scales the impact parameter (ρ) in terms of the size of the dark matter halo (Rvir). By doing so, we standardize the position of the sightlines for galaxies of different halo masses, and consequently, CGM sizes. Similar analyses have been performed on different data sets by Stocke et al. (2013) and Liang & Chen (2014), and on COS-Halos and COS-GASS by Tumlinson et al. (2013) and Borthakur et al. (2015), respectively.
We show the radial distribution of the equivalent width of Lyα normalized with respect to the virial radius of the galaxies in Figure 2. The distribution can be fit as a exponential with a scale-length of 1.1 Rvir, i.e.,  , where the normalization factor, A, is equal to 0.9 Å. The fit was derived using the Buckley–James17
method (Buckley & James 1979) and Expectation-maximization algorithm as implemented in the survival analysis software package, ASURV (Feigelson & Nelson 1985). The equivalent width data presented here are the same as that of Figure 2 of Borthakur et al. (2015), however, the abscissa is different, because we have adopted the Kravtsov et al. (2014), Liang & Chen (2014) formalism with modifications based on the findings of Mandelbaum et al. (2016) for halo masses and virial radii. In addition, the fit presented here takes into account the censored data; hence, it has slightly different parameters.
, where the normalization factor, A, is equal to 0.9 Å. The fit was derived using the Buckley–James17
method (Buckley & James 1979) and Expectation-maximization algorithm as implemented in the survival analysis software package, ASURV (Feigelson & Nelson 1985). The equivalent width data presented here are the same as that of Figure 2 of Borthakur et al. (2015), however, the abscissa is different, because we have adopted the Kravtsov et al. (2014), Liang & Chen (2014) formalism with modifications based on the findings of Mandelbaum et al. (2016) for halo masses and virial radii. In addition, the fit presented here takes into account the censored data; hence, it has slightly different parameters.
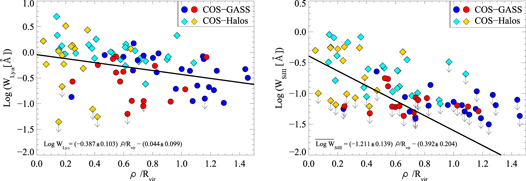
Figure 2. Variation of Lyα and Si iii equivalent width with normalized impact parameter (i.e.,  ) for a combined COS-GASS and COS-Halos sample. The colors blue and cyan indicate "blue" galaxies and red and yellow denote "red" galaxies. The thick, black line denotes the fits to the data using the Buckley–James method. The calculations were performed using the survival analysis software ASURV that takes into account the censored data. The parameters describing the best-fit lines are printed at the bottom left corner. Because the fits presented here take into account the censored data, the parameters of the best fit in the left panel are slightly different from those published by Borthakur et al. (2015).
Download figure:
Standard image High-resolution imageSimilarly, the radial distribution of the equivalent width of Si iii (see right panel of Figure 2) can be fit as a exponential with a scale-length of 0.4 Rvir i.e.,  . Almost all of our Si iii absorbers were detected inward of 0.8 Rvir. The smaller characteristic size scale for the Si iii absorbers compared to Lyα and the lack of Si iii detections beyond about 0.8 Rvir are consistent with the conclusions drawn by Liang & Chen (2014).
Given the systematic radial decline in the strengths of both the Lyα and Si iii absorbers, we define a new parameter: the impact parameter corrected equivalent width (hereafter, the excess equivalent width, [Log W − ![$\overline{\mathrm{Log}\,W}{]}_{\mathrm{ion}}$](https://content.cld.iop.org/journals/0004-637X/833/2/259/revision1/apjaa41f5ieqn39.gif) ). This refers to the offset in log
). This refers to the offset in log  in any individual sightline, with respect to the best-fit exponential for the entire sample. This parameter is then independent of impact parameter biases and allows us to compare all the absorbers in a uniform way.
3.2.2. Kinematics
We turn now to the kinematic properties of the CGM. To begin, a useful way of visualizing these properties is via the one-dimensional cross-correlation function. The cross-correlation function between galaxies and velocity centroids of Lyα absorbers is presented in the Figure 3. The cross-correlation function shows a strong signal for the presence of Lyα absorbers within 120 km s−1 of the galaxy systemic velocity. The systemic velocity is defined as the velocity corresponding to the optical spectroscopic redshift from SDSS that traces the stars that form the bulk of the baryonic material in the central region of the galaxies.
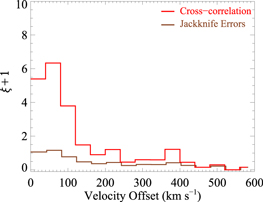
Figure 3. Cross-correlation function between the galaxy systemic velocities and velocity centroids of Lyα absorbers. The cross-correlation function was calculated using the same data analysis criterion as the observations/measurements. For example, the absorbers were randomly distributed within the allowed velocity range of ±600 km s−1. Caution must be applied when comparing these results to those from blind surveys or surveys with different intrinsic resolutions for the spectrograph.
Download figure:
Standard image High-resolution imageThe uncertainties were derived using a Jackknife error estimator, and are indicated as the brown line. They are dominated by small number statistics although the random pairs were generated by using 10,000 Monte Carlo samples. The cross-correlation function also takes into account the same data analysis criteria as the observations. For example, we have taken into account the observational aspect of identifying features by designating absorbers within ±600 km s−1 of the galaxy systemic as associated absorbers. For estimating the cross-correlation function, we randomly distributed the Lyα absorbers within ±600 km s−1 of the galaxy systemic velocity. Therefore, it is not advisable to compare this analysis with blind galaxy-absorber cross-correlation functions, such as those published by Lanzetta et al. (1998), Chen et al. (2005), Ryan-Weber (2006), Wilman et al. (2007), Chen & Mulchaey (2009), Tejos et al. (2012), and others. We also considered each component of the Lyα absorption features as an individual absorber. This should be given due consideration when comparing our results to those from other studies that use spectrographs with significantly different velocity resolution from COS.
Similar conclusions can be drawn for the Si iii transition. The distribution of Si iii is also closely related to that of Lyα absorption, although not all Lyα absorbers have associated Si iii absorption. To illustrate the velocity distribution of Si iii with respect to Lyα, we calculated the cross-correlation function between the velocity offset between Lyα and Si iii. In doing so, we preserved the relationship between distribution of Lyα centroids w.r.t the galaxy systemic—which implies that Lyα is not randomly distributed w.r.t v = 0. The cross-correlation function is presented in Figure 4. The red line indicates the cross-correlation function with the uncertainties shown in brown. The uncertainties were calculated using the same procedure as described previously. The correlation is strongest within ±40 km s−1 of the Lyα absorbers and drops gradually. The signal-to-noise is greater than 3.5σ up to 160 km s−1.

Figure 4. Cross-correlation function between velocity centroids of Lyα and Si iii absorbers. The calculations for the cross-correlation function preserved the distribution of the Lyα absorbers with respect to the galaxy systemic velocity as shown in Figure 3.
Download figure:
Standard image High-resolution imageWe now consider how the CGM kinematics depend upon the halo mass. Figure 5 shows the velocity offset of the absorbers relative to the systemic velocity of the galaxy ( , hereafter
  ) plotted as a function of dark matter halo mass. We find that the velocity distribution of the centroids of majority of the Lyα absorbers (as well as other detected metal absorbers) to typically lie within 200 km s−1 of the systemic velocity of the galaxy. The escape velocities at impact parameters of 100, 200, 300 kpc, and
  are plotted as dashed and solid curves of different colors. The centroids of the strongest component are shown as the filled symbols and the other components are shown as open symbols. The colored vertical lines connecting the strongest component to the other components mark the full-width of the Lyα profiles. Nearly all the strongest Lyα components have velocity centroids within the escape velocity of their host galaxies. Therefore, we expect this material to be bound to the galaxies.

Figure 5. Velocity distribution of Lyα transitions respective to the systemic velocity of the host galaxies for the COS-GASS and COS-Halos samples. The colors of the symbols show the colors of the galaxies (blue and cyan for "blue" galaxies, and red and yellow for "red" galaxies) and the vertical colored bar shows the extent of absorption. The centroids of the strongest component are shown as the filled symbols, and the weaker components are shown as open symbols. The escape velocity required for the gas clouds to escape the halos at impact parameters of 100, 200, and 300 kpc are shown as colored dashed curves, and that at the virial radius as solid black curve. The velocity distribution of metal species is very similar to this plot, although the constraints are weaker due to multiple non-detections.
Download figure:
Standard image High-resolution imageAnother way to characterize the kinematics of the CGM is to use the widths of the absorption features rather than their velocity displacement. In Figure 6, we plot the distribution of line-of-sight velocity dispersion of the strongest component of the Lyα feature ( , where b is the Doppler parameter in our fits). Several features are noteworthy in this pair of figures. First, the lines are generally very narrow (mean σlos ∼ 30 km s−1). Second, there is no trend for these widths to increase as the halo mass (virial velocity) increases (as was also the case for Δv).

Figure 6. Line-of-sight velocity dispersion ( , where b is the Doppler parameter in our fits) for the strongest component of the Lyα absorption line plotted as a function of the halo mass. There is no significant correlation between these parameters.
Download figure:
Standard image High-resolution imageA compact representation of the information in the figures discussed above is given in Figure 7. We define the kinematic parameter  . Here,
  is the velocity dispersion of the distribution of the velocity differences between the Lyα absorber and the galaxy systemic velocities within a given bin in
  . The term
  is the average value of
  of the individual Lyα absorbers in this same bin in halo mass. Again, we see no dependence of CGM kinematics on halo mass. In particular, the low (sub-virial) velocity spread of CGM absorbers in the halos of massive red galaxies has been noted before (Zhu et al. 2014; Huang et al. 2016). We will discuss the possible implications of these results in Section 4.
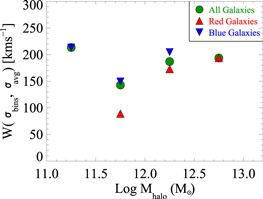
Figure 7. Velocity parameter, W, as a function of halo mass. The parameter W is defined as  , where
  is the dispersion of the centroids within each bin, and the
  is the average velocity dispersion (width) among the absorption features within the bins. The full sample is shown in green, and the red and blue galaxies are shown as red and blue triangles. The value of W does not change significantly between halo masses of
 for the entire sample.
Download figure:
Standard image High-resolution imageWe can also examine the radial dependences of the CGM kinematics. In Figure 8, we plot the Lyα velocity distribution as a function of normalized impact parameter. This figure suggests that the velocity offset of the absorbers from systemic velocity ( ) drops in the outer CGM. The differing kinematic properties of the inner versus the outer CGM are shown in histogram form in Figure 9. An F-test shows that the distributions differ at >99.99% (97.4%) confidence level for the blue (red) galaxies. In Figure 10, we show a similar plot of the radial dependence of the line-of-sight velocity dispersions (
 ) of the Lyα absorbers. This shows that there is a statistically significant (99.6% confidence level) trend for
  to increase with increasing impact parameter.
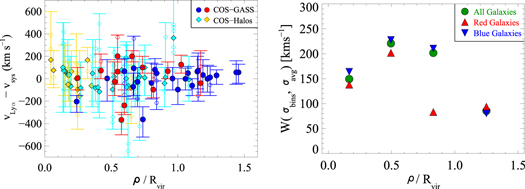
Figure 8. Left: velocity distribution of Lyα transitions respective to the systemic velocity of the host galaxies as a function of normalized impact parameter ( ) for the COS-GASS and COS-Halos samples. The circles represent the COS-GASS sample and the diamonds represent the COS-Halos sample. The color of the symbols indicate the color of the galaxy, i.e., blue and cyan for "blue" galaxies and red and yellow for "red" galaxies Right: velocity parameter, W, as a function of normalized impact parameter. Both the plots indicate that the velocity offset of the absorbers from systemic velocity drops in the outer CGM.
Download figure:
Standard image High-resolution image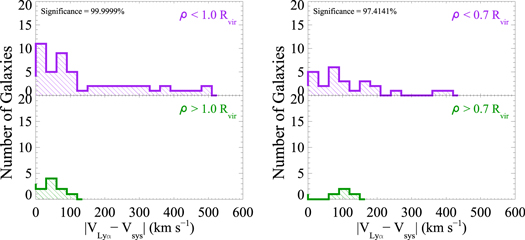
Figure 9. Left: histogram showing the distribution of  for the sightlines probing the CGM of blue galaxies within
  and outside
  . The ANOVA F-statistic test finds the two samples, the inner vs. the outer CGM, to have different Lyα centroid velocities at 99.99% confidence Right: histogram showing the distribution of
  for the sightlines probing the CGM of red galaxies within 0.7 Rvir and outside of 0.7 Rvir. The ANOVA F-statistic test finds the two samples, the inner vs. the outer CGM, to have different Lyα centroid velocities at a 97.4% confidence.
Download figure:
Standard image High-resolution image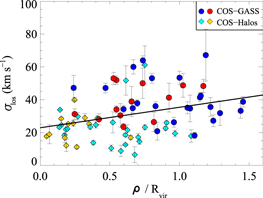
Figure 10. Line-of-sight velocity dispersion of the strongest component of the Lyα absorption line, plotted as a function of normalized impact parameter. The Kendalls τ test indicates a correlation that is significant at the 99.6% confidence level.
Download figure:
Standard image High-resolution image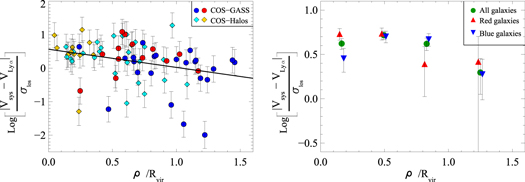
Figure 11. Log of the ratio of  (the velocity difference between the Lyα absorption line and galaxy systemic velocity) and
  (the line-of-sight velocity dispersion) as a function of normalized impact parameter. The Kendalls τ test indicates that the correlation is significant at the 99.9% confidence level. The solid line is the best fit. The right panel shows the same relation but using the mean values in bins of normalized impact parameter. The drop in the ratio in the outer CGM is evident.
Download figure:
Standard image High-resolution imageWe next define the dimensionless quantity  , and plot it in Figure 11 as a function of normalized impact parameter. The most interesting result is that
  has a mean value of about four interior to the virial radius. This figure also shows that the ratio declines in the outer CGM (a result significant at the 99.9% confidence level). This is due to the combined effects of the drop in the
  in the outer CGM and the radial rise in
  that were described above.
3.3. The CGM in Blue versus Red Galaxies
We now compare the radial distributions of the absorbers in the CGM surrounding the blue versus the red galaxies. The radial Lyα profiles as a function of normalized impact parameter ( ) are shown in Figure 12. One clear difference is the dispersion in the data between the two sub-samples. The blue galaxies show a fairly uniform radial distribution with a >95% detection rate of Lyα absorbers out to
  . On the other hand, the red galaxies show a much larger dispersion in the radial distribution (as indicated by weak absorption features, as well as non-detections with very good upper limits). It is worth noting that red galaxies do occasionally exhibit strong Lyα absorbers associated with their CGM, but their detection rate is not as large as in blue galaxies. This is particularly true for the inner CGM, and suggests that the warm CGM is more patchy in the red galaxies (has a smaller areal covering factor).
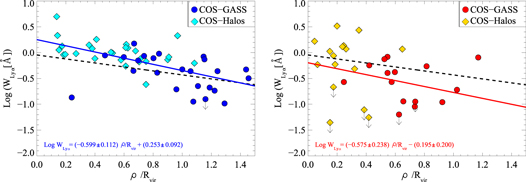
Figure 12. Variation of Lyα equivalent width as a function of normalized impact parameter i.e.,  . The galaxies are divided into two classes, blue galaxies (left panel) and red galaxies (right panel), based on their sSFR being above or below
  . The solid blue and red lines show the best fit to the plotted data using the Buckley–James method. The fits were performed using the survival analysis software ASURV, which takes into account the censored data. The dashed black line denotes the fit to the entire data set as shown in the left panel of Figure 2. The parameters describing the best-fit lines are printed at the bottom left corner.
Download figure:
Standard image High-resolution imageThe dashed black line is the fit to entire sample, whereas the blue and red solid lines are fits to blue and red galaxies respectively. The implied exponential scale-lengths for the blue and red galaxies are similar to one another (0.65 Rvir and 0.75 Rvir respectively). The difference in the normalization of the profiles of 0.45 dex (blue versus red) reflects the patchy nature of the absorbers in the CGM of the red galaxies.
Histogram representations of the excess Lyα equivalent widths for the blue and red galaxies are presented in Figure 13. The dispersion in the red galaxy sub-sample is much higher than in the blue galaxy sub-sample. Again, this signifies the difference in the covering fraction of neutral gas between the two populations. The distribution in the excess Lyα equivalent widths between the blue and red galaxies is significant enough that these two sub-samples can be considered as different populations with 99.9% confidence based on Logrank test statistics, using the software package ASURV.

Figure 13. Distribution of ![${[\mathrm{Log}W-\overline{\mathrm{Log}W}]}_{\mathrm{Ly}\alpha },$](https://content.cld.iop.org/journals/0004-637X/833/2/259/revision1/apjaa41f5ieqn73.gif) i.e., the offset in the Lyα equivalent width from the best-fit line described in Figure 2 for the combined samples of blue and red galaxies. The black arrows refer to the limiting cases included in each bin. The Logrank test, taking into account the censored data, finds the two samples (blue and red galaxies) to differ in their Lyα equivalent width at a confidence level of 99.9%.
i.e., the offset in the Lyα equivalent width from the best-fit line described in Figure 2 for the combined samples of blue and red galaxies. The black arrows refer to the limiting cases included in each bin. The Logrank test, taking into account the censored data, finds the two samples (blue and red galaxies) to differ in their Lyα equivalent width at a confidence level of 99.9%.
Download figure:
Standard image High-resolution imageWe find similar results for Si iii (Figure 14). The exponential scale lengths are similar for the blue and red galaxies (0.33 Rvir and 0.36 Rvir respectively). The normalization of the fit to the equivalent width radial distribution is 0.44 dex higher for the blue galaxies, which again reflects the patchy nature of the absorbers in the CGM of the red galaxies. The histogram showing the distributions of the excess Si iii equivalent widths is shown in Figure 15. The difference in the distribution of the excess Si iii equivalent width between the red and the blue galaxies is significant at the 99.8% confidence level.

Figure 14. Variation of Si iii equivalent width, with normalized impact parameter i.e.,  . The galaxies are divided into two classes, red and blue, depending on whether the sSFR is less or greater than
  . The solid blue and red lines show the best fit to the plotted data using the Buckley–James method. The fits were performed using the survival analysis software ASURV, which takes into account the censored data. The dashed black line denotes the fit to the entire data set, as shown in the right panel of Figure 2. The parameters describing the best-fit lines are printed at the bottom left corner.
Download figure:
Standard image High-resolution image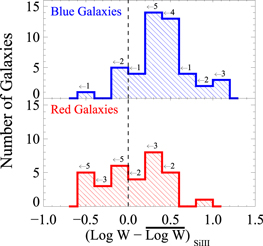
Figure 15. Distribution of ![${[\mathrm{Log}{\text{}}W-\overline{\mathrm{Log}{\text{}}W}]}_{\mathrm{Si}{\rm{III}}1206}$](https://content.cld.iop.org/journals/0004-637X/833/2/259/revision1/apjaa41f5ieqn76.gif) , i.e., the offset in the Si iii equivalent width from the best-fit line described in Figure 2 for the blue and the red galaxies. The black arrows refer to the limiting cases included in each bin. The Logrank test taking into account the censored data finds the two samples, blue and red galaxies, to differ in their Si iii equivalent width at sightly more than 99.8% confidence.
, i.e., the offset in the Si iii equivalent width from the best-fit line described in Figure 2 for the blue and the red galaxies. The black arrows refer to the limiting cases included in each bin. The Logrank test taking into account the censored data finds the two samples, blue and red galaxies, to differ in their Si iii equivalent width at sightly more than 99.8% confidence.
Download figure:
Standard image High-resolution imageBy and large, the kinematic properties of the CGM are quite similar between the blue and red galaxies. However, one notable difference is highlighted in Figure 16, which shows histograms of  for the individual Lyα absorbers. Although the majority of the values for
  are less than 100 km s−1 in both samples, the blue galaxy histogram has a pronounced tail extending out to
  km s−1. An analysis of variance (ANOVA) F-test reveals that the blue and red samples differ at the 98.5% confidence level.

Figure 16. Histogram showing the distribution of  for the blue and the red galaxies. The ANOVA F-statistic test finds the two samples (blue and red galaxies) to have different Lyα centroid velocity distributions at a 98.5% confidence level.
Download figure:
Standard image High-resolution image3.4. Correlation between CGM Properties and SFR
In the discussion above, we have simply classified galaxies as star-forming (blue) or quiescent (red). In this section, we focus on quantitative measures of the SFR and the sSFR. In our recent study, we found a strong correlation between the neutral hydrogen content in the interstellar medium of galaxies (traced by the 21 cm hyperfine transition) and the Lyα equivalent width in the outer CGM probed by the COS-GASS sample (Borthakur et al. 2015). We also found correlations between Lyα strengths and both SFR and sSFR, but these were significantly weaker than those with the H i 21 cm mass or mass fraction. Here, we reinvestigate the correlations with SFR and sSFR, using a much larger combined sample that better covers the full radial range of the CGM.
As seen in Figure 17, we find a positive correlation between the equivalent width of the Lyα absorbers and the SFR at the 99.8% confidence level. We find an even stronger correlation with the excess equivalent width [Log W - ![$\overline{\mathrm{Log}\,W}{]}_{\mathrm{Ly}\alpha }$](https://content.cld.iop.org/journals/0004-637X/833/2/259/revision1/apjaa41f5ieqn81.gif) and the galaxy sSFR (at the 99.99% confidence level.18
We also find similar correlations between SFR and the equivalent width of the Si iii and between the excess Si iii equivalent width
and the galaxy sSFR (at the 99.99% confidence level.18
We also find similar correlations between SFR and the equivalent width of the Si iii and between the excess Si iii equivalent width ![${[\mathrm{Log}W-\overline{\mathrm{Log}W}]}_{\mathrm{Si}{\rm{III}}1206}$](https://content.cld.iop.org/journals/0004-637X/833/2/259/revision1/apjaa41f5ieqn82.gif) and sSFR (see Figure 18).
and sSFR (see Figure 18).
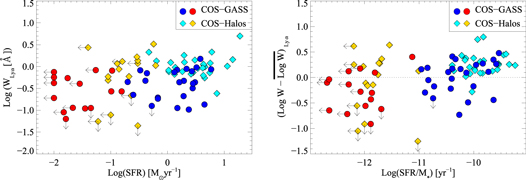
Figure 17. Left: Lyα equivalent width as a function of star formation rate (SFR) of the host galaxy. Right: impact parameter corrected equivalent width (![${[\mathrm{Log}{\text{}}W-\overline{\mathrm{Log}{\text{}}W}]}_{\mathrm{Ly}\alpha }$](https://content.cld.iop.org/journals/0004-637X/833/2/259/revision1/apjaa41f5ieqn83.gif) ) as a function of specific SFR of the galaxies. Excess equivalent width is defined as the ratio of the observed Lyα equivalent width and that predicted by the best-fit line for the entire sample as shown in Figure 2. The correlation between the excess in equivalent width of Lyα and sSFR is measured at the 99.99% confidence level, using the survival analysis code ASURV.
) as a function of specific SFR of the galaxies. Excess equivalent width is defined as the ratio of the observed Lyα equivalent width and that predicted by the best-fit line for the entire sample as shown in Figure 2. The correlation between the excess in equivalent width of Lyα and sSFR is measured at the 99.99% confidence level, using the survival analysis code ASURV.
Download figure:
Standard image High-resolution image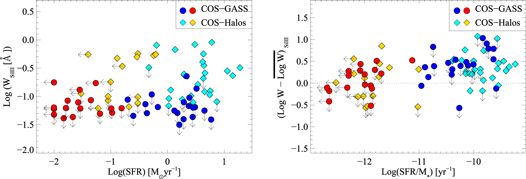
Figure 18. Left: Si iii equivalent width as a function of star formation rate (SFR) of the host galaxy. Right: the excess in Si iii equivalent width (![${[\mathrm{Log}{\text{}}W-\overline{\mathrm{Log}{\text{}}W}]}_{\mathrm{Si}{\rm{III}}1206}$](https://content.cld.iop.org/journals/0004-637X/833/2/259/revision1/apjaa41f5ieqn84.gif) ) as a function of specific SFR of the galaxies. The excess in Si iii equivalent width represents the difference between the observed Si iii equivalent width and that predicted by the best-fit line as shown in Figure 2. The correlation between the excess in equivalent width of Si iii and sSFR is measured at the 99.7% confidence level using survival analysis code ASURV.
) as a function of specific SFR of the galaxies. The excess in Si iii equivalent width represents the difference between the observed Si iii equivalent width and that predicted by the best-fit line as shown in Figure 2. The correlation between the excess in equivalent width of Si iii and sSFR is measured at the 99.7% confidence level using survival analysis code ASURV.
Download figure:
Standard image High-resolution image4. DISCUSSION
We want to highlight a number of the results above, and try to connect them together into a simple picture of the warm ionized phase of the CGM in both the blue (star-forming) and red (quiescent) galaxies.
We have found that the distribution of Si iii absorbers is more compact than that of the Lyα absorbers for both the red and blue galaxies (with exponential length scales of ∼0.35 versus 0.7 Rvir for the respective ions in both the blue and red galaxies). As a consequence, the detection fraction of Si iii for the full sample drops from 67% inside 0.7 Rvir to only 17% outside. This was also seen by Liang & Chen (2014), who interpreted it in terms of a boundary that represents the region that has been significantly enriched by metals expelled from the central galaxy (e.g., affected by stellar feedback at some point in the evolution of the galaxy and its CGM). We also see a change in the distribution of the velocity offsets between the Lyα lines and galaxy systemic velocities in the outer CGM. Although this could be related to feedback processes, it could also be due to line-of-sight projection effects, if the flow pattern in the CGM has a strong radial component (inward and/or outward).
Perhaps the most surprising result is that neither the red nor blue populations shows any trend for either the velocity offset of the Lyα absorbers with respect to the galaxy systemic velocity ( ) or the line-of-sight velocity dispersions (
 ) of the absorption lines to increase with increasing halo mass across a range of about 5 in implied virial velocity. The implied sub-virial velocities in the CGM around massive red galaxies have been noted before (Zhu et al. 2014; Huang et al. 2016), and are particularly mysterious. One possibility is that we are seeing the condensation of thermal instabilities out of a hot volume-filling phase (Voit et al. 2015). The hot gas is supported hydrostatically, and the denser cooler clouds that condense out have not (yet) been accelerated by gravity to the virial velocity of the halo. This would suggest that these clouds in massive red galaxies are transient (lifetimes less than a halo crossing time).
Another possibility is that the flow of the absorbing material in the warm CGM of these galaxies is significantly affected by drag forces associated with a more massive hot volume-filling phase. In any case, it appears that the CGM dynamics are not purely determined by gravitational forces alone. Because we expect that the absorption-line systems we see are imbedded in a multi-phase halo, their dynamics are likely to be influenced by processes such as drag forces, thermal instabilities, turbulent mixing, merger dynamics, and feedback-driven outflows (Maller & Bullock 2004; Santillan et al. 2007; Kwak & Shelton 2010; Kwak et al. 2011; Joung et al. 2012a, 2012b; Stinson et al. 2012; Ford et al. 2014; Suresh et al. 2015; Fielding et al. 2016).
The role of drag forces in reducing the velocities of the CGM clouds in massive halos is particularly interesting to consider. Following Bordoloi et al. (2016), it is straightforward to show that the terminal velocity for a CGM cloud that is significantly affected by drag is given by:

Here, vvir is the virial velocity of the halo, and Mvf and Mcs are the total masses of the volume-filling gas and the system of clouds in the CGM. For drag forces to be important, the volume-filling phase needs to significantly exceed the total cloud mass. The amount of mass in a volume-filling phase is uncertain in typical Milky Way-like galaxies (e.g., Miller & Bregman 2013), but appears to be significant in the halos of more massive galaxies (Planck Collaboration et al. 2013; Greco et al. 2015).
We also find that the ratio  is typically large (mean value of ∼4, see Figure 11) interior to the virial radius. This is true in both the blue and red galaxies. This result is inconsistent with at least one simple, and otherwise plausible, model in which a single line of sight through the CGM intersects many clouds with distinct locations and a wide range of line-of-sight velocities (e.g., a sea of clouds orbiting in the halo potential). Instead it implies that a typical line of sight through the CGM is intersecting a coherent structure (a cloud, sheet, or filament). Current constraints on the size of these structures (which are based on models in which the gas is photoionized by the meta-galactic background) are rather weak, but characteristic path-lengths are of-order 1–10 kpc (Stocke et al. 2013; Werk et al. 2014).
Despite many of the similarities between the CGM in red and blue galaxies noted above, we do find significant differences. First, in terms of the radial distributions of the Lyα and Si iii equivalent widths, the red galaxies have lower normalizations for the exponential fits, reflecting a patchy distribution of absorbers. There is also a significant fraction of the blue galaxies showing large velocity differences between the radial velocity of the absorber and central galaxy ( up to 500 km s−1). Taken together with the COS-Halos results on the presence (absence) of highly ionized gas (seen as O vi absorbers Tumlinson et al. 2011) in blue (red) galaxies, there are therefore real differences between the CGM surrounding star-forming and quiescent galaxies. Unfortunately, as discussed in Section 3.1, the data from the COS-GASS do not cover O vi; thus, we are not able to do the same analysis as done by Tumlinson et al. (2011) for the combined sample.
The interpretation of these differences is not straightforward. The direction of the causal connection between the properties of the CGM and the galaxy could be in either direction (or both). The CGM properties could be influenced by feedback from the galaxy, and the amount and nature of this could be significantly different between the blue and red galaxies (e.g., feedback from massive stars and supernovae versus feedback associated with AGN-driven radio sources ("radio mode"). Alternatively (or in addition) the star-forming properties of the galaxies may be driven by the different observed properties of the CGM.
One the main motivations of this paper is to understand whether and how the properties of the CGM in star-forming and quiescent galaxies relate to the cessation of star formation in the latter. The results we have presented seem to imply rather subtle differences between the two types of galaxies. Here, we will argue that the apparently subtle differences could have significant implications.
Let us consider a simple model in which the star formation rate in a given galaxy is proportional to the total mass of the system of CGM clouds traced by the absorption-lines (Mcs) divided by the timescale for these clouds to be transported from the CGM to the galaxy ( ). The results in Figure 2 imply that
  , where fc is the fraction of the cross-sectional area of the CGM (
 ) covered by these clouds. Empirically, we see no dependence of the cloud kinematics on the mass of the dark matter halo. Hence, we will assume that vin is likewise independent of Mhalo. Taken together, this implies that the sSFR scales as
  . Using our adopted scaling between
  and Rvir, the predicted value of sSFR drops by a factor of ten, with increasing stellar mass over the range in
  to
to 
 , even if fc does not change. Given that fc is a factor of 3 smaller in the red galaxies (Figures 12 and 14), this simple model then predicts a difference in the sSFR between the lowest-mass blue galaxies and highest-mass red galaxies in our sample of a factor of 30.
Of course, this model is purely phenomenological and does not explain the scaling of Mcs with Rvir or the invariance in vin. These relations are simply based on the observations. One possible interpretation would be that the mass of the population of clouds relative to that of the hot diffuse volume-filling CGM phase drops as a function of Mhalo. This reduces the normalized mass of the reservoir of clouds ( ) and increases the transport time of the clouds to the galaxy with increasing mass due to increasing drag forces. Such an idea is, at least qualitatively, consistent with the simple paradigm of a transition from predominantly cold accretion to a quasi-hydrostatic hot CGM as halo and galaxy mass increases.
5. SUMMARY
We have presented the analysis of a comprehensive data set combining the COS-GASS and COS-Halos samples to probe the CGM of low-z galaxies spanning a stellar mass range of almost two orders-of-magnitude centered on the characteristic mass ( ) at which the galaxy population transitions from mostly blue, star-forming galaxies to red, quiescent ones. These two surveys cover similar ranges in stellar masses and dark halo virial radii (Rvir). In addition, the combined sample uniformly samples a large range of radial distances from 0.02 to 1.3 Rvir. The COS-GASS survey primarily samples the outer CGM and COS-Halos survey primarily samples the inner CGM. We characterized the CGM properties, including its radial profile, its kinematics, and its correlation with the global properties of the galaxies. In particular, we have divided the sample into blue galaxies (with sSFR
  ) and red galaxies (with lower sSFR).
In this analysis, we discussed the Lyα λ1215 Å and Si iii λ1206 Å transitions tracing intermediate ionization gas. Si iii was chosen because it is the strongest metal transition detected in the combined data set. The typical detection limit for the COS-GASS sample is ∼50 mÅ corresponding to 3σ uncertainty in the data. In the combined sample, the detection rates of Lyα and Si iii were 91% and ∼50%, respectively.
Based on the analysis of the combined sample, we conclude the following:
- 1.The radial distribution of the equivalent width of Lyα as a function of normalized impact parameter (
 ) can be expressed as an exponential. The scale-lengths are similar for the red and blue galaxies (0.75 and 0.72 Rvir, respectively). The radial distribution of equivalent width of Si iii can also be expressed as an exponential with a scale-length of 0.36 (0.33) Rvir for the red (blue) galaxies. The detection rate of Si iii drops to almost zero beyond about 0.8 Rvir.
 - 2.The blue galaxies show a relatively uniform radial distribution of Lyα absorbers, implying an areal covering fraction of nearly 100% in the CGM. In contrast, the Lyα absorbers have a much less uniform radial distribution in the CGM of the red galaxies, suggesting a patchy distribution with smaller areal covering fractions. These differences are reflected in the overall normalization of the radial distribution of equivalent widths, which is higher for the blue galaxies (by 0.45 dex). Similar results were found for Si iii, but are restricted to the region interior to 0.8 Rvir (where Si iii is detected).
- 3.We found a significant positive correlation between the equivalent width of Lyα and the star formation rate (at the 99.8% confidence level). The correlation is even more significant for normalized quantities: the impact- parameter-corrected equivalent with of Lyα () and the specific SFR (SFR/M⋆) were found to correlate at the 99.99% confidence level. Similar results were found for Si iii.
- 4.We found the velocity distribution of the centroids of the majority of the Lyα and Si iii to generally lie within ∼150 km s−1 of the systemic velocity of the galaxy. These velocities are smaller than the escape velocity, thus suggesting that the gas seen in absorption is the gravitationally bound within the halo. The metal-line transitions are also found mostly within ±100 km s−1 of Lyα absorbers, although not all strong (>0.3 Å) Lyα absorbers showed associated Si iii.
- 5.We find that the velocity offset between the Lyα centroid and the systemic velocity () is usually significantly larger than the line-of-sight velocity dispersion of the Lyα line (). The mean ratio .
- 6.We find no dependence of the kinematic properties of the CGM ( or ) on the galaxy halo mass (virial velocity). This is surprising, because the sample spans ranges of about 102 in halo mass and ∼5 in vvir.
- 7.We found that the kinematic properties of the CGM are generally similar between the blue and red galaxies. However, although the majority of both the blue and red galaxies have Δv < 100 km s−1, the distribution of for the blue galaxies shows a pronounced tail out to values as high as 500 km s−1.
- 8.We found a significant change in the CGM kinematics at about a radius of 1.0 (0.7) Rvir for the blue (red) galaxies. In the outer CGM, for the Lyα absorbers is always less than 150 km s−1, whereas the distributions of show tails out to values as high as 500 km s−1 in the inner CGM. In addition, is higher, on average, in the outer CGM for both the blue and red galaxies. These two results lead to a corresponding decrease in in the outer CGM.

![${[\mathrm{Log}W-\overline{\mathrm{Log}{\text{}}W}]}_{\mathrm{Ly}\alpha }$](https://content.cld.iop.org/journals/0004-637X/833/2/259/revision1/apjaa41f5ieqn101.gif)


The combined COS-GASS and COS-Halos sample has allowed us to conduct a comprehensive study of the connection of the properties of the CGM with those of the stellar body of the galaxy. We think that three of the specific results from above are particularly noteworthy. First, the differences in the radial distributions of the Lyα, versus the Si iii absorbers, suggest that the inner CGM is being (or has at some time been) affected by feedback associated with massive stars and supernovae. This feedback has chemically enriched the CGM. It is interesting that the kinematics of the inner and outer CGM also show differences, although it is not clear that these are related to feedback or to projection effects.
Second, the fact that the typical ratio of the velocity offset to the line-of-sight velocity dispersion for the Lyα absorption-lines is so large is an important clue as to the structure of the CGM. It implies that a line of sight through the CGM does not intersect a whole sea of many clouds orbiting in the halo, but is rather passing through a coherent structure (cloud, sheet, filament). Model-dependent estimates imply a path-length of order 1–10 kpc for these structures.
Third, the independence of the kinematic properties of the warm CGM on the halo mass is quite remarkable. This implies that, even though the observed absorption-line systems are mostly gravitationally bound to the halo, simple gravitational forces alone do not adequately explain the CGM dynamics. For the massive red galaxies, the "sub-virial" velocities could be understood if the absorbers represent material cooling and condensing out of (or suffering drag as they move through) a hot volume-filling phase that is supported hydrostatically against gravity.
A major motivation of this study is to understand how and why galaxies in this stellar mass regime exhibit the color bimodality stemming from a suppression/cessation of star formation in some of them. Because the CGM is the interface through which galaxies could exchange gas and energy that is required to form stars (or is expelled as a result of star formation), CGM properties could hold clues as to how this process of gas delivery may be disrupted leaving some galaxies deprived of fuel to form stars. We have explored a simple scenario in which the star formation rate in a galaxy is proportional to the total mass of CGM clouds divided by an inflow time. We then show that the empirical results on the independence of CGM kinematic properties on halo mass and the smaller covering factor in the CGM in the red galaxies would imply a drop in the sSFR by about a factor of 30 over the stellar mass range from 1010 to 1011.5 M⊙.
In any event, we believe the data we have presented here provide a valuable observational resource for ongoing and future numerical simulations that try to reproduce CGM properties such as Lyα and metal-line column density profiles, covering fraction, and dynamics, such as line-widths and velocity spreads (for example Hummels et al. 2012; Stinson et al. 2012; Ford et al. 2013, 2014, 2016; Shen et al. 2013; Fielding et al. 2016; Kauffmann et al. 2016; Liang et al. 2016, and references therein). The ultimate goal is understanding the role of the CGM in the evolution of galaxies.
We thank the referee for his/her useful comments. We thank Hsiao-Wen Chen, Cameron Hummels, Colin Norman, Josh Peek, Molly Peeples, Jason X. Prochaska, John Stocke, and Jessica Werk for helpful discussions. This work is based on observations with the NASA/ESA Hubble Space Telescope, which is operated by the Association of Universities for Research in Astronomy, Inc., under NASA contract NAS5-26555. S.B. and T.H. were supported by grant HST GO 12603. B.C. gratefully acknowledges support from the Australian Research Council's Future Fellowship (FT120100660) and Discovery Project (DP150101734) funding schemes."
This project also made use of SDSS data. Funding for the SDSS and SDSS-II has been provided by the Alfred P. Sloan Foundation, the Participating Institutions, the National Science Foundation, the U.S. Department of Energy, the National Aeronautics and Space Administration, the Japanese Monbukagakusho, the Max Planck Society, and the Higher Education Funding Council for England. The SDSS Web Site is http://www.sdss.org/. The SDSS is managed by the Astrophysical Research Consortium for the Participating Institutions. The Participating Institutions are the American Museum of Natural History, Astrophysical Institute Potsdam, University of Basel, University of Cambridge, Case Western Reserve University, University of Chicago, Drexel University, Fermilab, the Institute for Advanced Study, the Japan Participation Group, Johns Hopkins University, the Joint Institute for Nuclear Astrophysics, the Kavli Institute for Particle Astrophysics and Cosmology, the Korean Scientist Group, the Chinese Academy of Sciences (LAMOST), Los Alamos National Laboratory, the Max-Planck-Institute for Astronomy (MPIA), the Max-Planck-Institute for Astrophysics (MPA), New Mexico State University, Ohio State University, University of Pittsburgh, University of Portsmouth, Princeton University, the United States Naval Observatory, and the University of Washington.
Facilities: Sloan - Sloan Digital Sky Survey Telescope, HST (COS). - Hubble Space Telescope satellite
Footnotes
- 13
The SFR for the GASS sample was derived by combining GALEX FUV and NUV and SDSS
photometry and SDSS spectral-line indices. - 14
This does not rule out the presence of a substantial "hot" medium at temperatures of
that may be traced by species like O vii. - 15
It is worth noting that the study by Richter et al. (2016) is a statistical study of the Si iii toward 303 QSO sightlines that may be associated with galaxies (instead of a targeted study of the CGM).
- 16
- 17
The Buckley–James method is a semi-parametric regression method.
- 18
The test was performed on our censored data using the astronomy survival analysis code ASURV (Feigelson & Nelson 1985). ASURV is capable of handling single- and double-censored data. The accuracy of these probabilities can be affected by larger numbers of censored values and other conditions. Because less than a quarter of our sample has censored values, we do not expect substantial inaccuracies. However, caution is appropriate, as it is for results from Kendall's test on any sample (Wang & Wells 2000).

