


ABSTRACT
Voyager 1 (V1) crossed the heliopause into the local interstellar medium (LISM) in 2012. The LISM is a dynamic region periodically disturbed by solar transients with outward-propagating shocks, cosmic-ray intensity changes and anisotropies, and plasma wave oscillations. Voyager 2 (V2) trails V1 and thus may observe the solar transients that are later observed at V1. V2 crossed the termination shock in 2007 and is now in the heliosheath. Starting in 2012, when solar maximum conditions reached V2, five possible merged interaction regions (MIRs) have been observed by V2 in the heliosheath. The timing is consistent with these MIRs driving the transients observed by V1 in the LISM. The largest heliosheath MIR was observed by V2 in late 2015 and should reach V1 in 2018.
Export citation and abstract BibTeX RIS
1. INTRODUCTION
The Voyager spacecraft are making the first in situ observations of the local interstellar medium (LISM) and heliosheath. Both are headed roughly toward the nose of the heliosphere, with V1 at 35° N heliolatitude and V2 at 31° S heliolatitude. They are separated by 43° in longitude. In mid-2016 V1 was at 135 au and V2 at 111 au. V1 has been in the LISM since 2012 (Gurnett et al. 2013) and V2 in the heliosheath since 2007 (Richardson et al. 2008).
The crossing of the heliopause had many surprises; one was the lack of rotation of the magnetic field at the boundary (Burlaga et al. 2013b). The crossing of the heliopause was only confirmed after plasma waves were observed and indicated that the densities outside the heliopause were those expected in the LISM (Gurnett et al. 2013).
Heliospheric radio waves were first observed by the Voyagers in 1983 and have been observed after every subsequent solar maximum (Gurnett et al. 2013). The first two events, in 1983–84 and 1992–94, occurred about 400 days after intense solar activity caused two of the largest Forbush decreases ever observed (Gurnett et al. 1993). The generally accepted scenario for the generation of the radio waves was that large solar transients form merged interaction regions (MIRs) that pass through the heliosheath, collide with the heliopause, and drive shocks that propagate in the LISM. Electron beams ahead of the shocks generate plasma oscillations and radio waves. The rising frequencies often observed in these events were attributed to an increase in the LISM density away from the heliopause (Gurnett et al. 1993).
These hypotheses have generally proven correct. V1 has observed four plasma wave events associated with radio emissions (Gurnett et al. 2015). In three of these cases the waves are associated with shocks in the LISM, two forward shocks and one reverse shock. These shocks are very weak, with compression ratios near 1.1 (Burlaga & Ness 2016), consistent with predictions (Zank & Muller 2003). The frequencies and thus plasma densities increase away from the heliopause. The wave events are usually preceded by increases in the cosmic-ray intensities and may be associated with cosmic-ray anisotropies in which the perpendicular cosmic-ray intensities decrease (Gurnett et al. 2015).
Model predictions are also consistent with this interpretation; large ram pressure increases in the solar wind drive the termination shock outward and generate high ram and thermal pressure pulses that propagate through the heliosheath (Steinolfson & Gurnett 1995; Story & Zank 1997; Zank & Muller 2003; Washimi et al. 2007, 2011, 2012; Zank 2015). These pressure pulses may be partially reflected near the heliopause and again encounter the termination shock, moving it inward (Washimi et al. 2007, 2011). They also drive weak shock waves into the LISM (Zank & Muller 2003).
Several papers tie individual LISM wave events to CMEs on the Sun. The 2013 April–May plasma wave event is linked to a series of CMEs in 2012 March (Gurnett et al. 2013; Liu et al. 2014). These attempts are hampered by the distance from 1 au data to the V1 location and the uncertainties in the transient propagation speeds, particularly in the heliosheath. In this paper we report that during solar maximum MIRs are common in the heliosheath. These V2 MIRs are investigated to see whether they drive the transients observed by V1 in the LISM.
2. OBSERVATIONS
2.1. MIRs
MIRs are characterized by large increases in the magnetic field magnitude formed by the coalescence of multiple interplanetary coronal mass ejections (Burlaga 1995). MIRs generally are associated with increases in the plasma speed, density, and dynamic pressure and a decrease in the galactic cosmic-ray (GCR) intensity. MIRs dominate the structure of the solar wind in the outer heliosphere near solar maximum (Richardson et al. 2003). The Voyager mission allows study of how these features effect the heliosheath and LISM.
The plasma data are available at the MIT Space Plasma Group Voyager Plasma Science Experiment Web site (http://web.mit.edu/space/www/voyager.html), the magnetic field data are from the NASA Space Physics Data Facility (spdf.gsfc.nasa.gov), and the Cosmic Ray Subsystem data are from voyager.gsfc.nasa.gov. We first show the MIRs observed near solar maximum in the solar wind upstream of the termination shock. Figure 1 shows the dynamic pressure (P) at V2 from 2000 to the termination shock at 2007.7, the monthly sunspot number, the magnetic field magnitude (B), and the GCR counting rate. We do not shift the sunspot numbers to account for the propagation time from the Sun; for the large MIR in 2006 the propagation time is about 6 months (Richardson et al. 2007), while for 400 km s−1 solar wind it is almost a year. The region from 2000 to 2004.5 roughly corresponds to solar maximum and the descending phase of the solar cycle at V2 and is dominated by MIRs. These MIRs show simultaneous increases in B and P. Most of the MIRs produce decreases in the GCR counting rates since the enhanced B field reduces inward transport. The GCR rates initially rise ahead of the MIR (or peak field) as reflection concentrates GCRs ahead of the shock, the snow plow effect (McDonald et al. 2000). The GCR intensities generally peak just before the maximum in magnetic field and then decrease as transport across the high field region is reduced. Starting in mid-2004, the effects of solar minimum are apparent; the average B is less, the GCR counts increase, and the number of MIRs is greatly reduced. The only significant MIR after 2004.5 is in 2006 March.

Figure 1. MIRs in the supersonic solar wind from 2000 to the V2 termination shock crossing. The top panel shows the solar wind dynamic pressure in black and the monthly sunspot number in red. The bottom panel shows the magnetic field magnitude in black and the GCR counting rate in red.
Download figure:
Standard image High-resolution imageThe Voyager spacecraft entered the heliosheath near solar minimum at a time of low solar activity. Only one MIR was reported at V1 in the heliosheath (Burlaga et al. 2008), in mid-2006 at 99 au. An extended period of high B, >0.2 nT, persisted for 3–4 months and was accompanied by a cosmic-ray intensity decrease. As discussed below, this MIR was likely the the same event observed by V2 in 2006 March.
Figure 2 shows the V2 heliosheath data in the same format as Figure 1. We label the six broad dynamic pressure increases after 2011 from A to G. The first V2 MIR (C in Figure 2) was observed in 2012 (Burlaga et al. 2016); Figure 2 shows that B and P increase in the MIR and the GCR flux decreases. Burlaga et al. (2016) show that the plasma density, speed, and temperature all increase in this MIR. Note that while V1 was in the heliosheath, V2 observed few large dynamic pressure pulses except those near to, and likely associated with, the termination shock. These increases (from 2007.7 to 2008.7) are much narrower than the MIRs and do not show the same correlation between B and P. The two dynamic pressure increases at 2011.5 (A) and 2012.0 (B) do not have corresponding B increases or GCR intensity decreases, so these events are not MIRs. The magnetic field data are not yet available after 2012, so we use the P increases and GCR intensity decreases as proxies to identify potential MIRs. At 2013.5 (D) and 2014.2 (E) the dynamic pressure increases by 75% and 50%, respectively, and small GCR intensity decreases are observed. Near 2015.8 P increases by almost a factor of three and the GCR intensity drops by 10%. This event (F) is the largest MIR observed to date in the heliosheath. Another double-peaked MIR is observed near 2016.3 (G), with a 75% increase in P and a GCR decrease. The top panel of Figure 2 shows that the sunspot number jumps upward in 2011; since the transit time of the solar wind to V2 is of the order of a year, the onset of these MIRs is likely due to the solar cycle increase in solar activity as occurred in the last solar maximum (Figure 1).
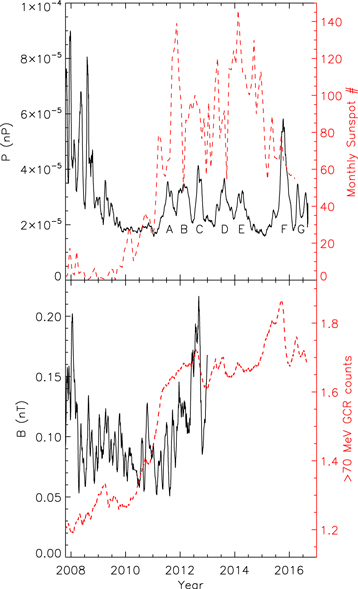
Figure 2. MIRS observed by V2 in the heliosheath from the termination shock crossing to mid-2016. The top panel shows the solar wind dynamic pressure in black and the monthly sunspot number in red. The bottom panel shows the magnetic field magnitude in black and the GCR counting rate in red. Pressure pulses in the heliosheath are labeled A–G.
Download figure:
Standard image High-resolution imageFigure 3 compares the plasma parameters in two MIRs from 2002 in the supersonic solar wind in the last solar maximum to those in two MIRs in the heliosheath in the current solar maximum. The left panel shows daily averages of plasma radial speed VR, density N, temperature T, and P for the 2015.8 and 2016.3 V2 MIRs, and the right panel shows the same parameters for the two 2002 MIRs. As in the 2012 MIR (Burlaga et al. 2016), the plasma VR, N, T, and P all increase in the heliosheath MIRs, consistent with model predictions (Steinolfson & Gurnett 1995; Story & Zank 1997; Zank & Muller 2003; Washimi et al. 2007, 2011). In the 2002 MIRs VR, N, and P increase but T does not. In the heliosheath the increases and decreases in solar wind parameters are gradual; there are no sudden jumps suggestive of a shock. In contrast, the supersonic solar wind MIRs are often initiated with shocks. In the supersonic solar wind at solar maximum eight MIRs are observed from 2000 to 2004. In the heliosheath five possible MIRs are observed from 2012.5 to 2016.5. Changes in the plasma parameters are less in the heliosheath than in the supersonic solar wind. VR increases by 20% in the biggest heliosheath MIR and up to 30% in the supersonic solar wind, N increases by a factor of 2 in the heliosheath and a factor of 4 in the supersonic solar wind, and P increases by a factor of up to 3 in the heliosheath and by a factor of 10 in the supersonic solar wind. Assuming that the supersonic solar wind MIRs were similar in both solar maxima, the termination shock has reduced the plasma variations and made the transitions smoother in the heliosheath.

Figure 3. Comparison of MIRs observed in the heliosheath (left) and supersonic solar wind (right). The panels show the radial speed VR, the density N, the temperature T, and the dynamic pressure P.
Download figure:
Standard image High-resolution image2.2. V2 MIRs and V1 Observations
The arrival of solar maximum at V2 coincided with the observation of MIRs propagating through the heliosheath. In this section we try to connect the V2 MIRs in the solar wind and heliosheath to the V1 MIR in the heliosheath and to the V1 transients in the LISM. Propagation of V2 events outward through the heliosheath and LISM to V1 has many uncertainties. The propagation speed of shocks in the solar wind is measured, so we know the speed out to the termination shock. The termination shock location, however, is a function of time and location. At V1 it was crossed at 94 au and at V2 at 84 au; this 10 au difference is probably partly due to the heliosphere being asymmetric and partly to time dependence (Richardson et al. 2008; Washimi et al. 2011). For the 2006 event, where V2 observes an MIR in the supersonic solar wind, we use a model of the termination shock location based on solar wind pressure at 1 au (Richardson & Wang 2012).
We assume that disturbances propagate through the solar wind at the fast-mode speed (Washimi et al. 2007). Thus, their total speed is the solar wind speed plus the fast-mode speed. The fast-mode speed in the heliosheath is determined by the pickup ions that dominate the thermal pressure (Richardson et al. 2008) but are not directly measured, so this speed is uncertain. Previous work gives heliosheath speeds for these pressure pulses that range from a dramatic slowing at the termination shock (Zank & Muller 2003) to a small decrease in speed (Steinolfson & Gurnett 1995; Washimi et al. 2012; Zank 2015). Studies of solar wind shocks hitting Earth's bow shock suggest that the propagation speed through Earth's magnetosheath is 0.7–1 times the upstream shock speed (Szabo et al. 2003; Koval et al. 2006; Pallocchia et al. 2010). Based on Earth observations and heliosheath models, for a 400 km s−1 upstream speed the heliosheath shock speed is probably 280–400 km s−1. We use a value of 320 km s−1 in the calculations below.
The next uncertainty is in the heliopause location. Models show that the steady-state heliopause moves by only a few au over a solar cycle and that pressure changes on shorter timescales have even less effect (Liewer et al. 1996; Wang & Belcher 1998, 1999; Zank & Muller 2003; Pogorelov et al. 2014). V1 crossed the heliopause at 121.7 au, 28 au beyond the termination shock. V2 was 28 au beyond the termination shock in late 2016 but has observed no heliopause precursors. This difference could be temporal or spatial or both. The V1 heliosheath was thinner than expected and had a very different flow profile than expected; heliopause instabilities may provide an explanation of these observations. Some models predict that these instabilities could produce large (tens of au) shifts in the heliopause position (Borovikov et al. 2012). Since the propagation speed is much lower in the LISM than in the heliosheath, the uncertainty in the heliopause position is probably the greatest source of error in propagating events from V2 to V1. In the calculations shown below we put the heliopause at the observed value in the V1 direction, 121.7 au.
In the LISM the fast-mode speed is determined mainly by the Alfvén speed and is about 40 km s−1 (Burlaga et al. 2013a). V1 moves outward at about 17 km s−1. The undisturbed LISM moves toward the nose of the heliosphere at about 26 km s−1, but near the heliopause it slows and is deflected around the heliosphere. The speeds in the LISM are not measured by V1. In the calculations below we assume that the transients move through the heliosheath at the fast-mode speed.
The other major assumption in these propagation calculations is that the MIRs are large compared to the Voyager separations. The initial discovery of the heliospheric radio emissions linked them to large MIRs in the inner heliosphere, implying a large angular extent. A 3D model of the 2003 Halloween CMEs shows that the effects of this event cover longitude and latitude ranges larger than the Voyager separations (Intriligator et al. 2005). We expect the MIRs to be large to survive into the heliosheath, but speeds could be different toward each spacecraft.
The V1 heliosheath MIR was observed near 2006.5 at 99 au (Burlaga et al. 2008), about 100 days after the MIR observed in 2006.2 by V2 in the solar wind at 79 au. The speed of the shock leading this V2 MIR was near 500 km s−1. If the termination shock were at 90 au in the V1 direction as predicted (Richardson & Wang 2012), it would take 35 days to reach the termination shock. At 320 km s−1 in the heliosheath the MIR would take another 45 days to reach V1, or 80 days total. Given the large uncertainties and spacecraft separations, a 20-day difference between predicted (80 days) and observed (100 days) times is consistent with these MIRs being the same event.
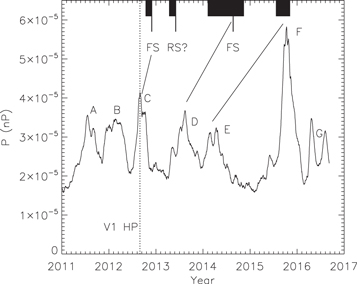
V1 observed four plasma wave events in the LISM in less than four years after crossing the heliopause. The thick lines in Figure 4 show the times of the plasma wave events (Gurnett et al. 2015). These waves are thought to be driven by electron beams that move ahead of shocks (Gurnett et al. 2013). Forward shocks are observed at the end of the first event and in the middle of the third event; these shocks are weak (Burlaga et al. 2016). A possible reverse shock (RS) with a sharp speed decrease was observed at the end of the second event (Figure 4). The forward shocks are presumably driven by solar transients that push the heliopause rapidly outward and generate outward-moving shocks (Zank & Muller 2003). V2 is in the heliosheath when the wave events are detected, so we look at the V2 pressure profile for events that could drive the V1 shocks. The first two heliosheath dynamic pressure pulses at V2 peak at 2011.6 (A) and 2012.1 (B), before V1 enters the heliopause even allowing for the propagation time from V2 to V1. These two features do not seem to be MIRs as discussed above. The next peak, the first V2 MIR (C), started at about day 180 (2012.5) at 99 au, about 50 days before V1 crossed the heliopause. V1 observed a shock associated with the first plasma wave event at day 335, 155 days later. If the heliopause were at 121 au, the shock must travel 22 au through the heliosheath, which at 320 km s−1 would take 110 days. In the LISM the fast-mode speed is about 40 km s−1 (Burlaga et al. 2013a), so the shock travel time between the heliopause and V1 (a distance of about 1 au) should be about 40 days and the total (heliosheath plus LISM) transit time from V2 to V1 should be about 150 days. Given the large uncertainties, the calculated (150 days) and observed times (155 days) are remarkably close and are consistent with these two features being manifestations of the same event.
Figure 4. Labeled dynamic pressure peaks observed by V2 in the heliosheath juxtaposed to the locations of the plasma wave events and shocks observed by V1 in the LISM. The dashed vertical line is where V1 crossed the heliopause. The thick black lines are the times of the plasma wave events, and the thinner lines are the times of the forward (FS) and possible reverse (RS) shocks observed by V1. The diagonal lines match V2 MIRs with V1 plasma wave events.
Download figure:
Standard image High-resolution image
The next V2 pressure pulse (D) starts at 2013.5, about a year later. The next forward shock at V1 is on day 235 in 2014 at 129 au and is associated with the third plasma wave event. Considering only the fast-mode speed, the propagation time from V2 at 102 au to 129 au would be about 95 (heliosheath) + 320 (LISM) days, or 415 days, compared with the observed lag time between these events of 422 days, again remarkably close given the large uncertainties.
Another V2 pressure increase occurred at 2014.1 (E) at 104 au; the last radio emission in Figure 4 ended on day 305 of 2015 at 133 au. No shock was observed at this wave event, but we calculate the propagation time to the end of this event assuming that a shock was nearby and generated the plasma waves but did not cross V2. The time to the heliopause at 121 au is 85 days, and the time to pass through the 12 au of LISM is 480 days, for a total of 565 days. This compares to the observed time of 639 days, so we predict a 70-day too early arrival. We note that the flow in the LISM is neglected. In the undisturbed LISM the inward speed toward the nose is about 26 km s−1. V1 is about 35° from the nose and V2 about 45°, so the radial flow component is reduced. Also, the radial flow speed near the heliopause will be slowed at the bow shock/wave and/or as the flow diverts around the heliopause. As a rough estimate, if the LISM VR were reduced by 1/3 on average between the heliopause and V1 owing to its flow around the heliopause and this decrease were combined with the 35° angle from the nose, the average LISM VR would be 14 km s−1. This reduces the shock propagation speed to 26 km s−1 and increases time for MIR (E) to propagate through the LISM propagation time to 738 days, for a total time of 823 days, much longer than observed. If these two features were the same event, the propagation speed in the LISM must be between these two values.
The largest pressure pulse (F) observed by V2 in the heliosheath was at 2015.7 at 109 au and had a factor of three increase in pressure. If this pressure pulse were a global event, this MIR could produce the strongest shock and plasma wave event at V1 to date. Again we calculate the time at which it is expected to arrive at V1. The 12 au to the heliopause would take 60 days, at which time V1 would be at 134 au, 13 au ahead of V2. If we ignore the LISM speed, the shock speed is about 40 km s−1 and the V1 speed 17 km s−1, so the MIR overtakes V1 at 23 km s−1 and will catch up 900 days after it crosses the heliopause. Thus, we do not expect to see effects of this MIR until early 2018. If the LISM VR is significant, the time for this event to reach V1 would be longer.
Table 1 summarizes these results for the one predicted and four observed plasma wave events. Each row shows the wave event start and end time and the time and type of shock, if any, associated with each event. Also listed is the time of the V2 MIR we think may drive each event, the time between the V2 MIR and the shock at V1, and the predicted propagation time. The uncertainties in the predicted propagation times are large as discussed above. A change in the heliopause position means more (or less) propagation distance at the slow speeds in the LISM plasma. The uncertainty of the propagation speed through the heliosheath is at least 30%. The assumption that the MIRs are global and have similar properties in the V1 and V2 directions could easily be invalid. The flow speed in the LISM is also uncertain. We acknowledge these uncertainties, but with reasonable assumptions we are able to correlate the plasma events with V2 pressure pulses. Moreover, we make a prediction of a large plasma wave event that will occur in or after the beginning of 2018 when the largest heliosheath MIR observed reaches V1.
Table 1. Summary of Results for the One Predicted and Four Observed Plasma Wave Events
| Event | Start | End | Shock | V2 MIR | Time (days) | Pred. (days) |
|---|---|---|---|---|---|---|
| 1 | 2012.78 | 2012.91 | FS: 2012.91 | 2012.66 (C) | 155 | 150 |
| 2 | 2013.28 | 2013.42 | RS: 2013.68 | ⋯ | ⋯ | ⋯ |
| 3 | 2014.1 | 2014.87 | FS: 2014.64 | 2013.50 (D) | 415 | 422 |
| 4 | 2015.55 | 2015.85 | None | 2014.10 (E) | 639 | >565 |
| 5 | ⋯ | ⋯ | ⋯ | 2015.75 (F) | ⋯ | >900 |
Note. The table gives the start and end times of the event, the times of forward (FS) and reverse (RS) shocks related to each event (when observed), the time of the V2 MIR that drives each event, the observed time from the V2 MIR to the V1 shock (or, if no shock, to the end of the event), and the predicted propagation time.
Download table as: ASCIITypeset image
3. SUMMARY
The arrival of solar maximum in the heliosheath has been accompanied by the observations by V2 of five possible MIRs in the 4 yr period 2012.5–2016.5. These MIRs have pressure increases ranging from 50% to 300% and are accompanied by GCR intensity decreases, implying B (not yet available after 2012) increases. These pressure increases occur at a similar frequency to the transients observed in the LISM by V1. Although V1 and V2 are far apart in azimuth and latitude and the uncertainties in propagation speeds of these MIRs through the heliosheath and LISM are large, the data seem consistent with the hypothesis that the pressure pulses observed at V2 are driving the transients observed in the LISM by V1.
We wish to acknowledge support from the International Space Science Institute for the team "Facing the Most Pressing Challenges to Our Understanding of the Heliosheath and Its Outer Boundaries," which spurred this work. We thank SPDF for the MAG data and CRS for providing GCR data through their Web site. J.D.R. was supported under NASA contract 959203 from the Jet Propulsion Laboratory to the Massachusetts Institute of Technology. J.S. and Z.N. thank the Czech Ministry of Education for support from grant LH15136. The research at the University of Iowa was supported by NASA through contract 1279980 with JPL.