


ABSTRACT
New detections of HNC have been made toward 11 planetary nebulae (PNe), including K4-47, K3-58, K3-17, M3-28, and M4-14. These sources, which represent a wide range of ages and morphologies, had previously been observed in HCN by Schmidt & Ziurys. Measurements of the  and
and  transitions of HNC near 90 and 271 GHz were conducted using the new 12 m and the Sub-Millimeter Telescope of the Arizona Radio Observatory. HCN and HNC were also identified via their
  lines toward eight positions across the Helix Nebula (NGC 7293). Column densities for HNC, determined from radiative transfer modeling, were Ntot(HNC) ∼ (0.06–4.0) × 1013 cm−2, corresponding to fractional abundances with respect to H2 of f ∼ (0.02–1.4) × 10−7. The HCN and HNC column densities across the Helix were found to be
  ∼ (0.2–2.4) × 1012 cm−2 and
  ∼ (0.07–1.6) × 1012 cm−2, with fractional abundances of (0.2–3.2) × 10−7 and (0.09–2.2) × 10−7. The [HCN]/[HNC] ratio varied between ∼1–8 for all PNe, with [HCN]/[HNC] ∼1–4 across the Helix. These values are greatly reduced from what has been found in asymptotic giant branch stars, where the ratio is typically >100. Both the abundance of HNC and the [HCN]/[HNC] ratio do not appear to vary significantly with nebular age across a time span of ∼10,000 years, in contrast to predictions of chemical models. The increase in HNC appears to arise in the proto-planetary stage, but becomes "frozen" once the PN phase is reached.
Export citation and abstract BibTeX RIS
1. INTRODUCTION
Planetary nebulae (PNe) form from intermediate mass (∼0.5–8 Msol) stars as they leave the asymptotic giant branch (AGB). While in the AGB phase, these stars experience extensive mass loss, sometimes as high as ∼10−4 Msol yr−1. Atomic and molecular material is stripped from the surface of the star in the form of a superwind, leading to the creation of a circumstellar envelope (e.g., Kwok 2000). Once the stellar core, known as a white dwarf, reaches a temperature of ∼30,000 K, mass loss ceases and the core is hot enough to ionize the surrounding remnant shell material, resulting in a PN.
The PN central white dwarf generates a significant ultraviolet (UV) radiation field during its transition from the proto-PN stage to the PN stage, typically ∼105 times that of the general interstellar medium (ISM), but decreasing to 10–100 as the remnant envelope expands and the luminosity of the white dwarf declines (Cox 1997). The copious amount of UV photons penetrating the nebula is predicted to photodissociate the remnant molecular material from the AGB stage within a thousand years (e.g., Redman et al. 2003). Indeed, the first molecular searches of PNe turned up negative (e.g., Penzias et al. 1971; Wilson et al. 1974). Subsequently, both CO and H2 have been detected in numerous PNe (e.g., Huggins & Healy 1989; Huggins et al. 1996, 2005; Hora et al. 1999; Likkel et al. 2006). More recent studies have identified other molecules in planetary nebulae with ever increasing complexity. Toward the young PNe NGC 7027 and NGC 6537, for example, HCN, HNC, CCH, CS, SO, H2CO, HCO+, and N2H+ have been identified (Zhang et al. 2008; Edwards & Ziurys 2013). In more evolved nebulae, species such as HCN, HNC, HCO+, CS, and CN have been found (e.g., Cox et al. 1992; Bachiller et al. 1997; Edwards et al. 2014). The very old Helix Nebula (age ∼12,000 years.) has an assortment of interesting molecules, including HCO+, CN, HCN, H2CO, CCH, c-C3H2, and HNC (Bachiller et al. 1997; Tenenbaum et al. 2009), and mapping data have shown that the molecular material is distributed throughout the PN (Zack & Ziurys 2013; Zeigler et al. 2013). SiO, SO, and SO2 have recently been found in M2-48 (age ∼5000 years.) as well (Edwards & Ziurys 2014). Perhaps even more striking is the identification of C60 in several PNe with low central star temperatures (Cami et al. 2010; García-Hernández et al. 2010, 2011, 2012; Otsuka et al. 2013). The presence of long-lived molecular material is believed to arise from shielding by high-density clumps (Howe et al. 1994), as seen in images of the Helix and the Ring (e.g., Meaburn et al. 1992; Speck et al. 2003; Meixner et al. 2005).
Very recently, Schmidt & Ziurys (2016) conducted a search for HCN and HCO+ in a set of 17 nebulae that had previously only been detected in CO. The target sources spanned a range of ages, angular sizes, and morphologies. Of the 17 target objects, 13 were detected in either HCN or HCO+, with both molecules common to most sources. HCN and HCO+ abundances, relative to H2, were found to be in the range ∼(0.1–9.1) × 10−7 and ∼(0.04–7.4) × 10−7, respectively (Schmidt & Ziurys 2016).
With this new target list in hand, we undertook a search for HNC, the metastable isomer of hydrogen cyanide, with the goal of measuring [HCN]/[HNC] ratios. Models predict that this ratio should be near unity in PNe (e.g., Kimura et al. 2012), because the formation mechanism of both molecules is thought to occur through the dissociative recombination of HCNH+:

Theory indicates that this process produces HCN and HNC in equal amounts (Talbi 1999). Temperature also influences the ratio; values as high as ∼80 are observed toward the warm, star-forming region Orion KL (Schilke et al. 1992), but drop to near unity in the cold gas in TMC-1 (e.g., Irvine & Schloerb 1984). In AGB stars, the ratio is far from unity, because hot, LTE chemistry in the inner envelope favors the more stable HCN. HNC is created in the outer envelope from HCNH+, a product of cosmic-ray ion-molecule chemistry (e.g., Daniel et al. 2012). The [HCN]/[HNC] ratio is thought to decrease from the AGB into the protoplanetary nebula and PN stages. HNC and HCN have been detected in a very limited number of PNe, however, and therefore accurate values of the [HCN]/[HNC] ratio in these objects are rare. It is thus unclear how this ratio evolves over the lifetime of a PN.
Here we report the results of our search for HNC in PNe. A set of 11 nebulae were studied in the  and 3 → 2 transitions of this molecule using the facilities of the Arizona Radio Observatory (ARO). We also present measurements of both HCN and HNC at eight new positions in the Helix Nebula. In this paper we describe the details of our observations, results, and analysis, and examine the evolution of the [HCN]/[HNC] ratio with nebular age.
2. OBSERVATIONS
Measurements of the  and
and  transitions of HNC, as well as the
  transition of HCN in the Helix, were performed between 2013 February and 2016 June using the facilities of the ARO. Details of the observations, including line frequencies, beam sizes, and beam efficiencies, can be found in Table 1. The 3 mm measurements (J = 1 → 0 transitions of HNC and HCN) were conducted with the new 12 m "European" ALMA prototype antenna at Kitt Peak. The dual-polarization receiver on the 12 m consists of ALMA Band 3 sideband-separating (SBS) mixers. Data were obtained in the lower sideband, with the image rejection, intrinsic in the mixer architecture, typically greater than 15 dB. The temperature scale,
  , was determined by the chopper wheel method, and is related to the main beam brightness temperature, TR, by the equation TR =
  /
/ , where
  is the main beam efficiency. The estimated calibration accuracy of the temperature scale is ∼20%. Three 256-channel filter banks with 1 MHz, 250 kHz, and 500 kHz resolutions, respectively, and the Millimeter Autocorrelator (MAC), were employed as backends. The MAC has 2048 channels with 781.2 kHz spectral resolution. All backends were operated in parallel mode.
Table 1. Transition Frequencies and Telescope Parameters
| Molecule | Transition | Frequency (MHz) | Telescope |
 ('') ('') |

|
|---|---|---|---|---|---|
| HNC |

|
90,663.6 | 12 m | 69 | 0.88 |

|
271,981.1 | SMT | 28 | 0.75 | |
| HCN |

|
88,631.8 | 12 m | 71 | 0.88 |
Download table as: ASCIITypeset image
Observations of the  transition of HNC were made using the 1.3 mm receiver at the ARO 10 m Sub-Millimeter Telescope (SMT) on Mt. Graham, AZ. This receiver employs ALMA Band 6 SBS mixers. These observations were performed in upper sideband (USB), with average image rejections of 25 dB and 16 dB in horizontal and vertical polarizations, respectively. The temperature scale was determined using the chopper wheel method, and is given as
  . These observations had an estimated calibration accuracy of 20%. Two filter banks were employed as backends, both operated in parallel mode: one with 2048 channels and 1 MHz resolution, and the other with 512 channels and 250 kHz resolution.
Summaries of the sources, including estimates for ages and sizes, are provided in Table 2. An in-depth discussion of nebular ages, how they were derived, and their uncertainties is given in Schmidt & Ziurys (2016). The average age uncertainty is ∼30%. Positions observed in the Helix were those used by Zack & Ziurys (2013); see their Table 1 (offsets are from the central star in R.A. and decl.). Observations were conducted in either position-switching or beam-switching mode, as determined by the source size. For most objects for which position switching was required, an offset of +30' in azimuth was used. In the case of Hb 5, an offset of −30' in azimuth was utilized because of Galactic contamination. Beam-switching was performed using a throw of ±2'. Local oscillator shifts were made to test for image contamination, and pointing was checked hourly using nearby strong continuum sources (ideally Jupiter or Mars when available). The average rms for these observations was ∼3 mK.
Table 2. Target List of Planetary Nebulae
| Source | α (J2000) (h m s) | δ (J2000) (° ' '') | θS ('') | Age (years) | Morphology | C/O° |
|---|---|---|---|---|---|---|
| Hb 5 | 17:47:56.2 | −29:59:41.9 | 31a | 1500b | bipolar | C-rich (?) |
| K3-17 | 18:56:18.2 | +07:07:25.9 | 8c | 970d | bipolar | C-rich (?) |
| K3-45 | 19:46:15.6 | +24:11:03.7 | 7e | 830f | bipolar | ... |
| K3-58 | 20:21:58.3 | +29:59:21.1 | 17g | 11070g | bipolar | ... |
| M1-7 | 06:37:21.0 | +24:00:36.6 | 11c | 6000c | bipolar | 1.1h |
| M3-28 | 18:32:41.3 | −10:05:50.0 | 17a | 7700c | quadrupolar | ... |
| M3-55 | 18:33:14.8 | −10:15:19.5 | 10g | 5040g | bipolar | ... |
| M4-14 | 19:21:00.7 | +07:36:52.4 | 15g | 5550g | quadrupolar | ... |
| NGC 2440 | 07:41:54.9 | −18:12:29.7 | 38a | 2960i | quadrupolar (?) | C-richj |
| NGC 6772am | 19:14:37.3 | −02:42:19.8 | 76a | 10900k | elliptical | ... |
| NGC 6772bn | 19:14:35.4 | −02:42:25.0 | ⋯ | ⋯ | ⋯ | ⋯ |
| K4-47 | 04:20:45.2 | +56:18:12.1 | 8c | 900l | bipolar | C-rich (?) |
Notes.
aTylenda et al. (2003). bLópez et al. (2012). cPhillips & Márquez-Lugo (2011). dBased on distance from Phillips & Márquez-Lugo (2011). eAcker et al. (1992). fGiammanco et al. (2011). gDobrinčić et al. (2008). hPatriarchi & Perinotto (1994). iGórny et al. (1997). jPottasch & Bernard-Salas (2010), Dufour et al. (2015). kAli et al. (2012). lCorradi et al. (2000). mMilne (1973), converted to J2000.0 coordinates. nKerber et al. (2003). osee Schmidt & Ziurys (2016).Download table as: ASCIITypeset image
3. RESULTS
HNC was detected in all of the 11 sources studied, typically in both transitions. Figures 1(a)–(d) display the spectra, while Table 3 summarizes the corresponding measured line parameters: peak antenna temperatures  , LSR velocities, and FWHM line widths, determined by Gaussian or shell fits to the line profiles. Note that HNC has no appreciable hyperfine structure in either transition studied. Observed line intensities for HNC were in the range ∼2–12 mK. LSR velocities and line widths were strikingly similar to those found for HCN in these sources, as highlighted in Figure 1(a) for K4-47 (also c.f. Schmidt & Ziurys 2016).
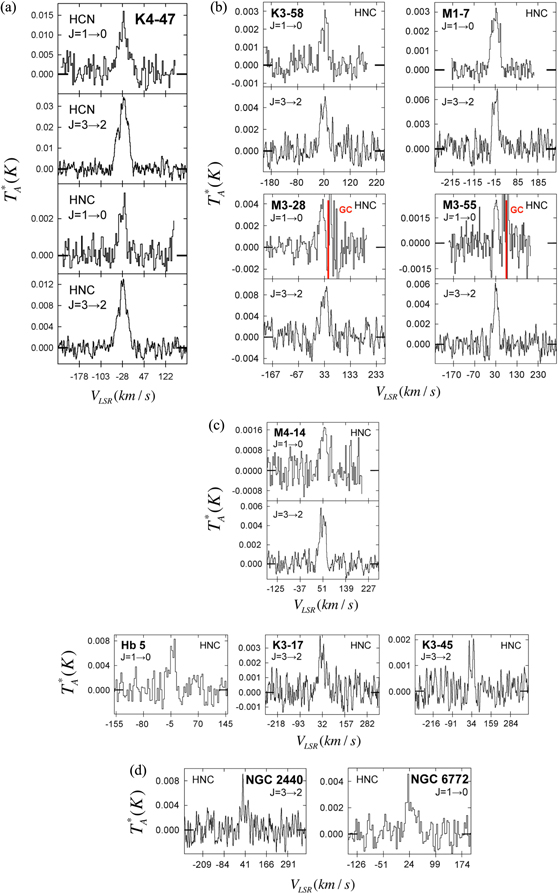
Figure 1. Spectra of the  and/or
  transitions of HNC observed toward PNe using the ARO ALMA prototype 12 m (J = 1 → 0; 90 GHz) and SMT (J = 3 → 2; 271 GHz). Spectral resolution is 1 MHz, and the temperature scale is
  . (a) The HNC lines measured toward K4-47, shown with the
  and
and  lines of HCN from Schmidt & Ziurys (2016). The HCN and HNC line profiles are very similar, indicating that both molecules arise from the same gas in this source. The
  lines of both HCN and HNC appear to contain a "plateau" component, which may result from an outflow linked to bullets of gas ejected by the central star. (b)–(d) Spectral lines of HNC detected in the PNe: (b) K3-58, M1-7, M3-28, and M3-55, (c) M4-14, Hb 5, K3-17, and K3-45, (d) NGC 2440 and NGC 6772. Galactic contamination is indicated by "GC." Some spectra appear to consist of multiple velocity components (K3-17, M1-7: see text), and that of K3-45, a bipolar nebula, is clearly double-peaked.
Download figure:
Standard image High-resolution imageTable 3. Observations of HNC: J = 1 → 0 and J = 3 → 2 Toward Planetary Nebula
| Name | Transition |
 (mK) (mK) |
VLSR (km s−1) | ΔV1/2 (km s−1) |
|---|---|---|---|---|
| Hb 5 | J = 1 → 0 | 6.9 ± 1.2 | −4.6 ± 3.3 | 33.1 ± 6.6 |
| J = 3 → 2 | <5 | ... | ... | |
| K3-17 | J = 1 → 0 | <1 | ... | ... |
| J = 3 → 2 | 2.6 ± 1.1 | 32.0 ± 4.4 | 49.9 ± 6.6 | |
| K3-45 | J = 1 → 0 | <2 | ... | ... |
| J = 3 → 2a | 1.8 ± 0.5 | 33.9 ± 2.2 | 34.2 ± 2.2 | |
| K3-58 | J = 1 → 0 | 2.8 ± 0.3 | 20.7 ± 3.3 | 30.5 ± 6.6 |
| J = 3 → 2 | 4.0 ± 1.3 | 20.2 ± 2.2 | 33.8 ± 3.3 | |
| M1-7 | J = 1 → 0 | 2.8 ± 0.9 | −16.6 ± 6.6 | 42.2 ± 6.6 |
| J = 3 → 2 | 6.0 ± 2.0 | −13.6 ± 2.2 | 31.2 ± 4.4 | |
| M3-28 | J = 1 → 0b | 4.6 ± 0.7 | ∼33 | ∼35 |
| J = 3 → 2 | 8.5 ± 1.5 | 33.5 ± 2.2 | 36.0 ± 3.3 | |
| M3-55 | J = 1 → 0b | 2.7 ± 0.4 | 29.2 ± 3.3 | 20.3 ± 3.3 |
| J = 3 → 2 | 5.6 ± 1.0 | 30.3 ± 2.2 | 23.1 ± 2.2 | |
| M4-14 | J = 1 → 0 | 1.6 ± 0.5 | 52.9 ± 3.3 | 26.9 ± 3.3 |
| J = 3 → 2 | 5.0 ± 1.1 | 48.8 ± 2.2 | 26.1 ± 2.2 | |
| NGC 2440 | J = 1 → 0 | <1 | ... | ... |
| J = 3 → 2 | ∼7 | 40.7 ± 4.4 | ∼50 | |
| NGC 6772a | J = 1 → 0 | 2.7 ± 1.2 | 24.2 ± 6.6 | 31.3 ± 6.6 |
| J = 3 → 2 | <10 | ... | ... | |
| NGC 6772b | J = 3 → 2 | <7 | ... | ... |
| K4-47 | J = 1 → 0 | 2.9 ± 1.0 | −28.4 ± 3.3 | 29.8 ± 3.3 |
| J = 3 → 2 | 11.5 ± 2.0 | −27.8 ± 2.2 | 36.9 ± 3.3 |
Notes.
aFit with shell profile. bStrong galactic contamination.Download table as: ASCIITypeset image
The  transitions of both HCN and HNC were detected at all eight positions in the Helix. Bachiller et al. (1997) had detected both molecules at the (−372'', 0'') position, which was not included in our set. Figure 2 displays the spectra as a function of position in the Helix. The (130'', −180'') position shows the HCN hyperfine pattern underneath one feature. As the figure illustrates, multiple velocity components are present at nearly every position, and the three quadrupole hyperfine lines of HCN are often visible. The line profiles also closely resemble those measured in CO, HCO+, and H2CO by Zack & Ziurys (2013).
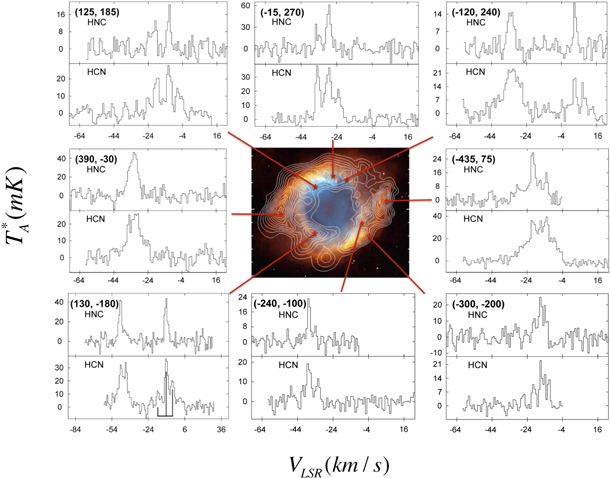
Figure 2. Spectra of the  transitions of HNC (upper panel: 90 GHz) and HCN (lower panel: 88 GHz) observed toward eight positions in the Helix Nebula, using the ARO ALMA prototype 12 m. Spectral resolution is 250 kHz. The R.A. and decl. offsets for each position (in arcseconds from the central star: J2000.0: α = 22h29m38s.6, δ = −20°50'18'') are displayed in the top left corner of each panel. The HCN LTE hyperfine pattern is shown beneath the −10 km s−1 velocity component of the (130'', −180'') spectrum. Positions are indicated on an optical image of the Helix (NASA et al. 2003). Overlaid contours on the image indicate the peak brightness temperature of the
  transition of HCO+ (Zeigler et al. 2013). Both molecules are clearly visible in all positions, often with a complex velocity structure.
Download figure:
Standard image High-resolution imageTable 4 lists the line intensities ( ), LSR velocities, and line widths for each velocity component and the individual hyperfine lines of HCN, when visible, for the Helix. The peak temperatures ranged between ∼5–35 mK for the main hyperfine line (F = 2 → 1) of HCN and ∼8–60 mK for HNC. These parameters were determined from Gaussian fits to the line profiles, and assuming an LTE hyperfine intensity ratio of 3:5:1 (F = 1 → 1:2 → 1:1 → 0) for the HCN data—a reasonable assumption on examining the line profiles. Often the hyperfine and velocity components were intermixed for this molecule, but the HNC line profiles provided a good template for the velocity structure at each position, as did previous data (Zack & Ziurys 2013). Examples of the fitted HCN line profiles are shown in Figure 3. Here, spectra with overlaid fits (in green or grayscale) from the (−15'', 270'') and (−435'', 75'') positions are shown. At first glance, the (−15'', 270'') data give the impression of non-LTE hyperfine intensities in HCN, but this is actually the result of two closely spaced velocity components (see Table 4). The complexity in the (−435'', +75'') spectrum is a product of three velocity features.

Figure 3. Representative Gaussian modeling (green or grayscale) of the velocity and hyperfine structure of the HCN (J = 1 → 0) line profiles at positions (−15'', 270'') and (−435'', 75'') in the Helix Nebula (upper and lower panels). The modeling assumes LTE ratios for the three hyperfine lines (see Figure 2). The (−15'', 270'') spectrum was fit with two velocity components at −29 and −35 km s−1; the (−435'', 75'') data were analyzed with three such components at −29, −21, and −14 km s−1. Velocity components were deduced from HNC and previous CO and HCO+ data from Zack & Ziurys (2013).
Download figure:
Standard image High-resolution imageTable 4. Observations of HCN and HNC (J = 1 → 0) Toward the Helix Nebula
| Position | Molecule | Transition | VLSR(km s−1) |
 (mK) (mK) |
ΔV1/2(km s−1) |
|---|---|---|---|---|---|
| (130'', −180'') | HCN |

|
−47.0 ± 1.8 | ||
| F = 1 → 1 | ∼20 | ∼3 | |||
| F = 2 → 1 | 30 ± 3 | 3.5 ± 1.8 | |||

|
−10.0 ± 1.8 | ||||
| F = 1 → 1 | 21 ± 3 | 3.4 ± 1.8 | |||
| F = 2 → 1 | 35 ± 3 | 3.1 ± 1.8 | |||
| F = 1 → 0 | ∼10 | ∼3 | |||
| HNC |

|
−47.4 ± 0.8 | 40 ± 2 | 3.4 ± 0.8 | |

|
−9.8 ± 0.8 | 41 ± 3 | 2.9 ± 0.8 | ||
| (390'', −30'') | HCN |

|
−33.0 ± 1.8 | ||
| F = 1 → 1 | ∼13 | ∼6 | |||
| F = 2 → 1 | 22 ± 3 | 6.5 ± 1.8 | |||
| F = 1 → 0 | ∼4 | ∼6 | |||
| HNC |

|
−32.9 ± 1.7 | 44 ± 5 | 6.2 ± 1.7 | |
| (−240'', −100'') | HCN |

|
−38.0 ± 0.9 | ||
| F = 1 → 1 | 12 ± 3 | 2.8 ± 0.9 | |||
| F = 2 → 1 | 19 ± 3 | 2.8 ± 0.9 | |||
| HNC |

|
−38.0 ± 0.8 | 23 ± 5 | 1.9 ± 0.8 | |
| (−15'', 270'') | HCN |
 a
a
|
−35.0 ± 0.9 | ||
| F = 1 → 1 | ∼15 | 3.1 ± 1.8 | |||
| F = 2 → 1 | 26 ± 6 | 3.1 ± 1.8 | |||
| F = 1 → 0 | ∼5 | ∼3 | |||
 a
a
|
−29.0 ± 0.8 | ||||
| F = 1 → 1 | 16 ± 3 | ∼3 | |||
| F = 2 → 1 | 26 ± 4 | 2.6 ± 1.8 | |||
| F = 1 → 0 | ∼5 | ∼3 | |||
| HNC |

|
−35.0 ± 0.8 | 22 ± 10 | 3.2 ± 0.8 | |

|
−28.8 ± 0.8 | 60 ± 10 | 2.7 ± 0.8 | ||
| (−120'', 240'') | HCN |

|
−34.1 ± 1.8 | ||
| F = 1 → 1 | ∼13 | ∼5 | |||
| F = 2 → 1 | 21 ± 3 | 5.4 ± 1.8 | |||
| F = 1 → 0 | ∼4 | ∼5 | |||

|
2.9 ± 0.9 | ||||
| F = 1 → 1 | 11 ± 3 | 2.4 ± 0.9 | |||
| F = 2 → 1 | 18 ± 3 | 2.4 ± 0.9 | |||
| F = 1 → 0 | 4 ± 3 | 2.1 ± 0.9 | |||
| HNC |

|
−33.6 ± 1.7 | 16 ± 3 | 5.8 ± 1.7 | |

|
3.2 ± 0.8 | 18 ± 3 | 1.9 ± 0.8 | ||
| (125'', 185'') | HCN |
 a
a
|
−25.0 ± 1.8 | ||
| F = 2 → 1 | 8 ± 4 | 2.6 ± 0.9 | |||
 a
a
|
−20.0 ± 0.9 | ||||
| F = 1 → 1 | ∼6 | ∼3 | |||
| F = 2 → 1 | 11 ± 4 | 3.3 ± 0.9 | |||
 a
a
|
−12.5 ± 0.9 | ||||
| F = 1 → 1 | 16 ± 4 | ∼3 | |||
| F = 2 → 1 | 26 ± 4 | 2.6 ± 0.9 | |||
| HNC |
 b
b
|
−24.5 ± 1.7 | 8 ± 3 | ∼3 | |
 b
b
|
−20.5 ± 1.7 | 13 ± 3 | 3.1 ± 0.8 | ||

|
−12.5 ± 0.8 | 20 ± 3 | 2.6 ± 0.8 | ||
| (−435'', 75'') | HCN |
 a
a
|
−29.0 ± 1.7 | ||
| F = 1 → 1 | ∼5 | ∼4 | |||
| F = 2 → 1 | 8 ± 3 | 3.9 ± 0.8 | |||
 a
a
|
−21.0 ± 1.7 | ||||
| F = 1 → 1 | ∼18 | ∼5 | |||
| F = 2 → 1 | 32 ± 3 | 5.2 ± 1.7 | |||
| F = 1 → 0 | ∼6 | ∼5 | |||
 a
a
|
−14.0 ± 1.7 | ||||
| F = 1 → 1 | ∼12 | ∼5 | |||
| F = 2 → 1 | 20 ± 3 | 4.7 ± 1.7 | |||
| HNC |
 b
b
|
−30.0 ± 3.3 | 8 ± 4 | ∼4 | |
 b
b
|
−21.5 ± 1.7 | 26 ± 4 | 5.2 ± 1.7 | ||
 b
b
|
−14.0 ± 3.3 | 14 ± 4 | ∼5 | ||
| (−300'', −200'') | HCN |
 (?) (?) |
−26.8 ± 0.9 | ||
| F = 2 → 1 | 5 ± 3 | 2.6 ± 0.9 | |||
 a (?)
a (?) |
−21.0 ± 1.7 | ||||
| F = 2 → 1 | ∼6 | ∼3 | |||
 a
a
|
−16. 4 ± 3.3 | ||||
| F = 1 → 1 | 12 ± 3 | ∼3 | |||
| F = 2 → 1 | 21 ± 3 | 3.4 ± 1.7 | |||
| F = 1 → 0 | ∼4 | ∼3 | |||
| HNC |
 b (?)
b (?) |
∼−21 | ∼10 | ∼2.5 | |
 b
b
|
−16.7 ± 1.7 | 24 ± 5 | 6.8 ± 3.3 |
Notes.
aHyperfine and velocity components blended. bBlended velocity components.3.1. Survey Sources
Hb 5: The  transition of HNC was detected with a central velocity of −4.6 km s−1 in this PN, close to the systemic velocity of the star, which is −7 km s−1 (López et al. 2012). As for HCN and HCO+, no obvious Galactic contamination was present in the spectrum. The line profile appears asymmetric, and the line width of ∼33 km s−1 is comparable to that of the
  transition of HCN (∼40 km s−1). López et al. (2012) calculated a kinematic age of 1500 years for this source, based on the radial expansion velocity.
K3-17: HNC was detected in the  transition of this source, with VLSR ∼ 32 km s−1 and ΔV1/2 ∼ 50 km s−1, consistent with the
  lines of both HCN and HCO+. The nebula is small (8'') and multi-polar with several secondary loops. Multiple narrow velocity components at ∼20, 30, 39, and 57 km s−1 appear to be visible in the spectra of HNC, HCN, and HCO+, indicative of this complex geometry. An age of ∼1000 years was derived for K3-17 from the expansion velocity inferred from CO (Schmidt & Ziurys 2016).
K3-45: Only the  transition of HNC was detected in this small (6
 8: Acker et al. 1992) bipolar object. The observed VLSR of ∼34 km s−1 and ΔV1/2 of ∼34 km s−1 are comparable to those seen in HCN. The HNC line profile is clearly double-peaked, with maxima at ∼18 km s−1 and ∼45 km s−1, as also seen in the HCN
  transition. Schmidt & Ziurys (2016) calculated an age estimate of ∼800 years for this nebula.
K3-58: Both the  and 3 → 2 transitions of HNC were observed in this small (17'') bipolar nebula. The LSR velocities of ∼20 km s−1 and line widths of ∼30 km s−1 are consistent with the HCN and HCO+ spectra. An age of ∼11,000 years was estimated for this source by Dobrinčić et al. (2008) from their spatio-kinematical study.
M1-7: The  and 3 → 2 transitions of HNC were both detected in this small, older, compact (∼11'') bipolar PN. The line widths and LSR velocities are consistent with what is seen for HCN and HCO+ within the uncertainties. There may be additional velocity structure in the spectra near −29 km s−1 and −7 km s−1. Schmidt & Ziurys (2016) derived an age of ∼6000 years for M1-7.
M3-28: HNC was detected in both transitions in this small (∼17'') quadrupolar nebula. As was the case for both HCN and HCO+, the  transition of HNC was contaminated by Galactic emission toward redshifted velocities. Thus, the VLSR and ΔV1/2 of the
  transition (∼33 km s−1 and ∼35 km s−1 respectively) are estimates. The line parameters of the
  transition match reasonably well with those observed for the HCN and HCO+ transitions (VLSR ∼ 33 km s−1 and ΔV1/2 ∼ 36–42 km s−1). An adopted age of ∼7700 years was obtained by Schmidt & Ziurys (2016).
M3-55: While both transitions were detected in this small (∼95) bipolar PN, the  spectrum was partially obscured by Galactic contamination, making estimates of the line parameters less reliable. The VLSR and ΔV1/2 of the
  transition, ∼30 km s−1 and ∼23 km s−1 respectively, are comparable to those seen for the
  transition of both HCN and HCO+. An age of ∼5000 years is given by Dobrinčić et al. (2008).
M4-14: In this 15'' quadrupolar nebula, both transitions of HNC were detected. The VLSR of ∼49–53 km s−1 and ΔV1/2 of ∼26–27 km s−1 are consistent with those seen in the  spectra of HCN and HCO+ , although the HNC lines are slightly narrower. From spatio-kinematic modeling, Dobrinčić et al. (2008) assign an age of ∼5500 years to this source.
NGC 2440: A detection of the  transition was made toward this source (age ∼3000 years: Górny et al. 1997). The line appears to have a peak temperature of ∼7 mK and a width of ∼50 km s−1, and is centered at ∼41 km s−1. This is consistent with what was seen in HCN and HCO+. Several sharp, narrow features may be seen near ∼27, 41, and 57 km s−1, which are also present in HCN and HCO+.
NGC 6772 a/b: The  transition of HNC was detected in this large (756: Tylenda et al. 2003) nebula at the central position (19h 14m 37
 3: −2°42' 198 J2000.0) provided by Milne (1973), hereafter referred to as "NGC 6772a." The observed position differs from that used by Schmidt & Ziurys (2016) for HCN and HCO+ (19h 14m 364 in R.A., −2°42' 25'' J2000.0 from Kerber et al. (2003), hereafter known as "NGC 6772b"). This position was also observed, but no positive detections were made. The line intensity for NGC 6772a is
  mK; the line width of ∼31 km s−1 and LSR velocity of ∼24 km s−1 are comparable to what is seen in HCN and CO. Ali et al. (2012) calculated a dynamical age of ∼11,000 years.
K4-47: This young bipolar source contains two diametrically opposed bullets or jets of gas, which have been observed in low-ionization atomic lines. The  and 3 → 2 HNC lines were both detected in K4-47, with the VLSR of ∼−28 km s−1 closely matching that seen in HCN and HCO+, although the line widths may be slightly narrower. As in the case of other molecules (e.g., Edwards et al. 2014), the
  spectrum of HNC appears to contain both a central and a plateau component, with line widths near 22 km s−1 and 37 km s−1, respectively. As described in Schmidt & Ziurys (2016), the plateau feature may be the result of an outflow associated with bullets of gas ejected from the central star. An age of ∼900 years was estimated by Corradi et al. (2000).
3.2. Helix Positions
(130'', −180''): Two distinct velocity components are clearly visible in both the HNC and HCN  spectra, one at −10 km s−1 and the other at −47 km s−1, as also seen in CO, HCO+, and H2CO. The HNC and HCN line widths of 2.9–3.5 km s−1 are consistent with those of these other molecules. The HCN line profiles appear noticeably wider because of the nitrogen hyperfine structure.
(390'', −30''): One velocity component can be seen in both the HCN and the HNC spectra, with a central velocity of about −33 km s−1. The line widths for both molecules are ∼6 km s−1, thus blending the hyperfine components in HCN.
(−240'', −100''): A single velocity component, centered at ∼−38 km s−1, is visible in both the HNC and HCN spectra. This feature is particularly narrow, with a ΔV1/2 of ∼2–3 km s−1.
(−15'', 270''): Two closely spaced velocity components can clearly be distinguished in the HNC spectrum, one centered at −35 km s−1 and one at −29 km s−1. The widths of each component are ∼3 km s−1. These velocity components are also present in the HCN spectrum, but are interwoven with the hyperfine structure, creating a line profile that at first glance appears to have non-LTE intensities. This profile is more accurately explained by the two velocity components, as shown in Figure 3.
(−120'', 240''): Two widely spaced velocity components are present in both the HCN and HNC spectra, at ∼−34 and 3 km s−1, respectively. The ΔV1/2 is ∼5–6 km s−1 for the −33 km s−1 component, and around 2 km s−1 for the 3 km s−1 component. Hyperfine splitting in HCN is discernable in the 3 km s−1 component but the lines are completely blended in the −34 km s−1 feature.
(125'', 185''): Three velocity components are apparent in the HNC spectrum, at −12.5, −20, and −25 km s−1, respectively, with line widths ∼3 km s−1. Due to their relative proximity, the −20 and −25 km s−1 features are blended. These components also appear to be present in the HCN spectrum, but the hyperfine structure complicates the line profile and the individual components are difficult to distinguish. The widths in the HCN spectrum appear to be around 3 km s−1 as well.
(−435'', 75''): Three velocity components are present in both the HCN and HNC spectra, at ∼−14, −21, and −29 km s−1, respectively. These are partially blended together, creating one broad feature. The line widths range around 4–5 km s−1 for each component. The complex appearance of the HCN line profile is readily accounted for by these three components superimposed on the hyperfine structure; see Figure 3.
(−300'', −200''): A component near 16–17 km s−1 is evident in both the HNC and HCN spectra, consistent with what is seen in CO, HCO+, and H2CO by Zack & Ziurys (2013). However, to adequately model the HCN spectrum, an additional velocity component at ∼21 km s−1 was included. There is a tentative detection of this component in the HNC spectrum as well. In addition, there may be a third component in HCN near −27 km s−1, as also observed in CO. The line widths are typically ∼3 km s−1 for each component, as best can be established, though the ∼−17 km s−1 component in HNC appears to have a broader line width of ∼7 km s−1.
4. ANALYSIS
HCN and HNC column densities were determined using the non-LTE molecular radiative transfer code, RADEX (Van der Tak et al. 2007). RADEX utilizes the Sobolev escape probability method to solve the equation of radiative transfer in order to produce line intensities for a particular molecule based on an assumed gas kinetic temperature, H2 density, and molecular column density. Considering that, at best, only two transitions were detected in a given source, the H2 density and column density were varied while the kinetic temperature was held constant at TK = 20 K, a typical temperature for molecular gas in PNe (see Zack & Ziurys 2013; Edwards & Ziurys 2014; Edwards et al. 2014). For the remaining sources for which only a single transition had been measured, the H2 density was set to that determined from HCN by Schmidt & Ziurys (2016). For the Helix data, both the kinetic temperature and H2 values were held fixed to those found for CO by Zack & Ziurys (see their Table 5).
In the case of the Helix observations, there was no need to correct for beam dilution, as the source filled the beam at each position. For the other 11 survey nebulae, source filling factors were estimated in two separate ways. First, the line temperatures were corrected for beam dilution based on the nebular size estimated from the optical image, assuming a Gaussian source distribution coupled to a Gaussian beam (see Table 2). However, molecular material in PNe is believed to exist in dense clumps of gas and dust, not spread uniformly throughout the nebula (see, e.g., Huggins et al. 1992; Meaburn et al. 1992; Huggins & Mauron 2002; Meixner et al. 2005). Thus, the column densities derived from these calculations apply to these knots of material, not the entirety of the PN. Therefore, as described in Schmidt & Ziurys (2016), we also applied a "clump volume filling factor" to the data for the 11 survey PNe, which ranged from 0.2 to 0.33, depending on the source. The results of both calculations can be found in Table 5 for the survey sources, and those for the Helix nebula are shown in Table 6.
Table 5. Column Densities and Fractional Abundances for Survey PNe
| Source | n(H2) (cm−3) | Ntot (cm−2) | Ntot (CO) (cm−2) | Xi/H2 | [HCN]/[HNC] | |
|---|---|---|---|---|---|---|
| Hb 5 | Clump | 4.3e5 | 5.3 ± 2.0 × 10¹² | 4.3 ± 1.5 × 10¹⁵ | 1.2 ± 0.3 × 10⁻⁷ | 7.4 |
| Non-clump | 7.6e5 | 1.7 ± 0.7 × 10¹² | 2.5 ± 2.4 × 10¹⁵ | 6.8 ± 3.6 × 10⁻⁸ | 7.1 | |
| K3-17 | Clump | 1.2e6 | 3.4 ± 1.9 × 10¹³ | 3.9 ± 2.0 × 10¹⁷ | 8.7 ± 3.3 × 10⁻⁹ | 7.9 |
| Non-clump | 1.7e6 | 5.0 ± 2.8 × 10¹² | 6.5 ± 5.0 × 10¹⁶ | 7.7 ± 3.7 × 10⁻⁹ | 4.8 | |
| K3-45 | Clump | 1.1e6 | 1.4 ± 0.5 × 10¹³ | 2.9 ± 1.6 × 10¹⁷ | 4.8 ± 1.6 × 10⁻⁹ | 3.8 |
| Non-clump | 9.4e5 | 5.3 ± 1.8 × 10¹² | 6.7 ± 1.9 × 10¹⁶ | 7.9 ± 1.7 × 10⁻⁹ | 3.2 | |
| K3-58 | Clump | 7.5e5 | 1.2 ± 0.3 × 10¹³ | ... | 1.1 ± 0.1 × 10⁻⁷ | 2.1 |
| Non-clump | 1.0e6 | 2.4 ± 0.7 × 10¹² | ... | 2.2 ± 0.3 × 10⁻⁸ | 2.1 | |
| M1-7 | Clump | 1.1e6 | 2.0 ± 1.0 × 10¹³ | 8.3 ± 7.4 × 10¹⁷ | 2.4 ± 1.2 × 10⁻⁹ | 5.8 |
| Non-clump | 1.1e6 | 6.6 ± 3.2 × 10¹² | 1.1 ± 0.2 × 10¹⁷ | 6.0 ± 1.6 × 10⁻⁹ | 5.5 | |
| M3-28 | Clump | 9.5e5 | 2.2 ± 0.5 × 10¹³ | 9.3 ± 7.5 × 10¹⁷ | 2.4 ± 1.0 × 10⁻⁹ | 4.1 |
| Non-clump | 1.3e6 | 4.4 ± 1.0 × 10¹² | 1.3 ± 0.3 × 10¹⁷ | 3.4 ± 0.6 × 10⁻⁹ | 4.1 | |
| M3-55 | Clump | 1.1e6 | 2.3 ± 0.7 × 10¹³ | 1.1 ± 0.5 × 10¹⁷ | 2.1 ± 0.6 × 10⁻⁸ | 2.0 |
| Non-clump | 1.1e6 | 4.5 ± 1.3 × 10¹² | 2.7 ± 2.1 × 10¹⁶ | 1.7 ± 0.7 × 10⁻⁸ | 1.0 | |
| M4-14 | Clump | 1.6e6 | 7.7 ± 3.0 × 10¹² | 3.6 ± 1.2 × 10¹⁶ | 2.1 ± 0.5 × 10⁻⁸ | 5.1 |
| Non-clump | 2.1e6 | 1.6 ± 0.7 × 10¹² | 1.3 ± 0.8 × 10¹⁶ | 1.2 ± 0.4 × 10⁻⁸ | 3.0 | |
| NGC 2440 | Clump | 3.2e6 | 2.6 ± 1.3 × 10¹² | 7.2 ± 4.8 × 10¹⁵ | 3.6 ± 1.5 × 10⁻⁸ | 4.7 |
| Non-clump | 6.2e6 | 7.9 ± 3.7 × 10¹¹ | 7.2 ± 6.7 × 10¹⁵ | 1.1 ± 0.6 × 10⁻⁸ | 4.6 | |
| NGC 6772a | Clump | 1.2e6 | 5.6 ± 3.7 × 10¹¹ | 2.5 ± 1.1 × 10¹⁵ | 2.2 ± 0.9 × 10⁻⁸ | 4.1 |
| Non-clump | 2.9e6 | 2.9 ± 1.9 × 10¹¹ | 1.5 ± 0.3 × 10¹⁵ | 1.9 ± 0.7 × 10⁻⁸ | 3.5 | |
| K4-47 | Clump | 2.1e6 | 4.0 ± 1.7 × 10¹³ | ... | 1.4 ± 0.2 × 10⁻⁷ | 5.5 |
| Non-clump | 2.1e6 | 1.3 ± 0.6 × 10¹³ | ... | 4.5 ± 0.7 × 10⁻⁸ | 4.9 |
Download table as: ASCIITypeset image
Table 6. Column Densities and Fractional Abundances for Helix Positions
| Position | VLSR (km s−1) | Ntot(HCN) (1011 cm−2) | Ntot(HNC) (1011 cm−2) | Xi/H2(HCN) (10−8) | Xi/H2(HNC) (10−8) | [HCN]/[HNC] |
|---|---|---|---|---|---|---|
| (130'', −180'') | −47 | 3.7 ± 1.2 | 2.3 ± 0.2 | 4.9 ± 0.9 | 3.1 ± 0.3 | 1.6 |
| −10 | 3.8 ± 2.1 | 2.0 ± 0.6 | 5.1 ± 1.4 | 2.7 ± 0.4 | 1.9 | |
| (390'', −30'') | −33 | 9.0 ± 0.9 | 6.6 ± 1.3 | 12.0 ± 1.0 | 8.8 ± 1.0 | 1.4 |
| (−240'', −100'') | −38 | 1.8 ± 0.6 | 0.7 ± 0.4 | 2.4 ± 0.4 | 0.9 ± 0.3 | 2.7 |
| (−15'', 270'') | −35 | 4.4 ± 2.2 | 1.6 ± 0.8 | 5.9 ± 1.5 | 2.1 ± 0.5 | 2.8 |
| −29 | 1.9 ± 1.4 | 2.5 ± 0.9 | 2.5 ± 0.9 | 3.3 ± 0.6 | 0.8 | |
| (−120'', 240'') | −33 | 6.2 ± 2.4 | 2.1 ± 0.9 | 8.3 ± 1.7 | 2.8 ± 0.6 | 3.0 |
| 4 | 2.6 ± 1.1 | 0.9 ± 0.4 | 3.5 ± 0.8 | 1.2 ± 0.3 | 2.9 | |
| (125'', 185'') | −25 | 13.0 ± 6.8 | 3.9 ± 1.1 | 17.3 ± 4.6 | 5.2 ± 0.8 | 3.3 |
| −20 | 22.9 ± 9.4 | 6.6 ± 2.2 | 30.5 ± 6.7 | 8.8 ± 1.6 | 3.5 | |
| −13 | 11.7 ± 1.4 | 2.9 ± 0.4 | 15.6 ± 1.4 | 3.9 ± 0.4 | 4.0 | |
| (−435'', 75'') | −29 | 1.6 ± 0.4 | 0.7 ± 0.2 | 2.1 ± 0.3 | 0.9 ± 0.1 | 2.3 |
| −21 | 18.3 ± 4.0 | 5.0 ± 1.7 | 24.4 ± 3.1 | 6.7 ± 1.2 | 3.7 | |
| −13 | 16.1 ± 1.6 | 3.8 ± 0.2 | 21.4 ± 1.7 | 5.1 ± 0.4 | 4.2 | |
| (−300'', −200'') | −27 | 4.2 ± 1.3 | ⋯ | 5.6 ± 0.9 | ⋯ | ⋯ |
| −21 | 5.8 ± 2.4 | 2.5 ± 0.3 | 7.7 ± 1.7 | 3.3 ± 0.3 | 2.3 | |
| −17 | 23.9 ± 3.6 | 16.4 ± 4.7 | 31.9 ± 3.2 | 21.8 ± 3.5 | 1.5 |
Download table as: ASCIITypeset image
As shown in Table 5, the H2 densities derived from the HNC analysis for the clump ((0.4–3.2) × 106 cm−3) and non-clump ((0.8–6.2) × 106 cm−3) assumptions agree to within a factor of 2, and to within a factor of 3 with the values determined from HCN by Schmidt & Ziurys (2016). These densities are consistent with the large dipole moment of HNC (∼3.05 Debye) and are close to the values determined from CO, H2CO, and CS in other PNe (Zack & Ziurys 2013; Edwards et al. 2014; Edwards & Ziurys 2014). The derived column densities for HNC range between Ntot (HNC) ∼ (0.03–1.3) × 1013 cm−2 and Ntot (HNC) ∼ (0.06–4.0) × 1013 cm−2 for the non-clump and clump calculations—a factor of 2–7 difference. For any source for which two transitions of HNC were available, a rotational diagram was also constructed. All column densities determined from this method were within a factor of ∼1.4 of their corresponding RADEX value. For the Helix, column densities fell in the range ∼(0.2–2.4) × 1012 cm−2 for HCN and (0.07–1.6) × 1012 cm−2 for HNC. Errors for the column density measurements were calculated through propagation of errors in the line temperatures and widths.
Using these column densities, fractional abundances with respect to H2 were calculated. H2 column densities were derived from the intensities of the v = 1 → 0 S(1) transition at 2.12 microns for K4-47, K3-58, and the Helix, as such data were available (see Schmidt & Ziurys 2016 and Zack & Ziurys 2013). Respectively, these values are Ntot (H2) ∼ 2.9 × 1020 cm−2, ∼1.1 × 1020 cm−2, and ∼7.5 × 1018 cm−2. For the remaining survey sources, the H2 column densities were determined from those of CO, assuming CO/H2 ∼ 10−4—a number consistent with other PNe (e.g., Healy & Huggins 1990; Huggins et al. 2002; Zack & Ziurys 2013; Edwards et al. 2014). CO column densities were taken from measurements of Schmidt & Ziurys (2016); see their Table 4 and our Table 5.
Fractional abundances for the survey PNe were determined to be f(HNC) ∼ (0.02–1.4) × 10−7 (or (0.3–6.8) × 10−8 for the non-clump assumption—within a factor of five). For the Helix, fractional abundances for HNC and HCN were f(HNC) ∼(0.09–2.2) × 10−7 and f(HCN) ∼ (0.2–3.2) × 10−7. These values result in [HCN]/[HNC] ∼ 2–8 (assuming clumping) for the survey sources (see Table 5) and [HCN]/[HNC] ∼ 1–4 for the Helix (see Table 6).
5. DISCUSSION
5.1. HNC Abundance and Distribution in Planetary Nebulae
The detection of HNC in all observed targets, which represent a somewhat random sampling of the PN population, is striking, particularly considering that, just as in the case with HCN and HCO+, the abundance is not negligible. The average HNC fractional abundance is ∼4.5 × 10⁻⁸, including both the survey sources (assuming clumping) and the Helix positions. Furthermore, the HNC and HCN abundances across the Helix vary only by a factor of about 23 and 15, respectively. For the (−372'', 0'') position in the Helix, the data from Bachiller et al. (1997) suggest f(HNC/H2) ∼ 3.2 × 10⁻⁸ and f(HCN/H2) ∼ 5.4 × 10⁻⁸—in line with those seen at our positions. Their measurements also suggest HNC abundances with respect to H2 of 3.5 × 10⁻⁸, 1.1 × 10⁻⁸, and 2.2 × 10⁻⁸ for NGC 6781, M4-9, and NGC 6720, scaling by their 12CO/13CO ratios. In NGC 6072 and IC 4406, HNC abundances of 1.9 × 10⁻⁸ and 1.4 × 10⁻⁸ were determined from the data of Cox et al. (1992). Previous values for the HNC abundances are comparable to those established here.
Of the Schmidt & Ziurys (2016) survey sources, the abundance of HNC appears to be highest in K4-47 and lowest in M3-28 (assuming clumping). Similarly, K4-47 possesses a high abundance of HCN of ∼7.6 × 10⁻⁷, while that in M3-28 is considerably lower at 9.8 × 10⁻⁹. In the Helix, the VLSR = −17 km s−1 component at position (−300'', −200'') has the highest HNC and HCN abundances, with f(HNC) ∼ 3.2 × 10⁻⁷ and f(HCN) ∼ 2.2 × 10⁻⁷. Thus, the abundances of HCN and HNC generally appear to correlate.
The common precursor to both HCN and HNC in PNe is thought to be HCNH+ (e.g., Kimura et al. 2012), as mentioned previously. This species is created by different routes, triggered by ions generated by photons or by cosmic rays. The correlation of HCN with HNC in PNe thus supports this hypothesis. HCNH+ has yet to be detected in PNe.
Several chemical models of PNe predict abundances of HNC. For example, Redman et al. (2003) estimate the fractional abundance of HNC to be ∼1.4 × 10⁻⁸ at 2550 years, decreasing significantly to 2.7 × 10⁻¹² at 6300 years and further dropping to 2.2 × 10⁻¹² at 10,050 years. While the abundance at 2550 years is on par with the average observed values, the predictions of Redman et al. at 6300 and 10,050 years fall far below any of the fractional abundances determined for the PNe studied here. Kimura et al. (2012) predict HNC abundances as high as 10−9, in somewhat better agreement, though they did not study evolution with age.
Our data also indicate that there is no strong variation of HNC abundance with nebular age, as illustrated in Figure 4. This figure plots the HNC abundance (cyan circles), assuming clumping, as a function of source age, along with those for HCN and HCO+ from Schmidt & Ziurys (in red and blue circles, respectively). Also plotted are abundances in other sources, indicated by stars. Model predictions from Redman et al. are represented as triangles. As shown in the figure, the observed values fall in the range ∼10−8−10−7, and do not change significantly from about 1000 to 11,000 years. Although there are uncertainties in the ages of the nebulae, the trend is very clear. The models predict a sharp decrease of 104 by 6000 years for HNC, with a steady abundance of 10−12 thereafter. Indeed, these findings support the idea that clumped material shields the molecules from incoming radiation more effectively than predicted by models, and/or that there is more active chemical production ongoing in PNe than expected, as noted by Schmidt & Ziurys (2016).

Figure 4. Plot of fractional abundances of HCN (red), HCO+ (blue), and HNC (cyan) relative to H2 in PNe vs. nebular age in years. All abundances assume clumping. Circles represent data from this work (HNC) and Schmidt & Ziurys (2016): HCN, HCO+. Red and blue stars indicate measurements for HCN and HCO+ for NGC 7027, NGC 6537, M2-48, NGC 6853, and NGC 6720 from previous works (see text and Schmidt & Ziurys 2016). The cyan stars designate HNC abundances for NGC 6720, M4-9, and NGC 6781 from Bachiller et al. (1997) (see text for details). The red, blue, and cyan triangles (dashed lines) designate the fractional abundances for HCN, HCO+, and HNC, respectively, from the model of Redman et al. (2003). The model predicts a sharp decrease in the fractional abundances of HNC and HCN as a function of time, and significantly lower values than observed. The measured abundances of all three molecules appear to stay relatively constant across the ∼10,000 year lifetime of PNe.
Download figure:
Standard image High-resolution imageHNC is a prominent molecule in C-rich AGB envelopes, including IRC+10216, IRAS 15194-5115, IRAS 15082-4808, IRAS 07454-7112, CIT 6, AFGL 3068, and IRC+40540 (Woods et al. 2003). The abundances of HNC in these objects ranged from (0.2–3.3) × 10−7. In contrast, Smith et al. (2015) found f(HNC/H2) ≤ (0.5–2.9) × 10−8 for the envelopes of C-stars II Lup, RAFGL 4211, and AI Vol. HNC has also been identified in a number of proto-planetary nebulae (PPNe). Morris et al. (1987) derived an HNC abundance of 1.8 × 10⁻⁷ for the protoplanetary Calabash Nebula, while in CRL 2688, Zhang et al. (2013) found f(HNC/H2) ∼ 5.7 × 10⁻⁷—higher than those of the PNe observed here. For CRL 618, the abundance is estimated to be in the range 1.9 × 10⁻⁷–1.9 × 10⁻⁶ (Sopka et al. 1989; Bujarrabal et al. 1994). Comparing these HNC abundances with those measured in PNe, the values on average decrease slightly from the AGB stage through the PN phase.
5.2. [HNC]/[HCN] Ratio with Nebular Age
The [HCN]/[HNC] ratios established here fall within the range 1–8 for all sources. The ratio appears to be highest in K3-17, a young PN, and lowest in M3-55, which is middle-aged. These values are consistent with those found in other PNe. Using the data of Bachiller et al. (1997), NGC 6720, M4-9, and NGC 6781 have ratios ranging from ∼1.4–4.5, while several compact PNe are estimated to have [HCN]/[HNC] ∼ 2.5 (Josselin & Bachiller 2003). The HNC data in the latter case have limited sensitivity. Regardless, it is clear that the ratio is remarkably constant, given the different types of nebulae and their physical characteristics.
There may be a slight correlation of the [HCN]/[HNC] ratio with stellar temperature, which in principle could convert some HNC to HCN. Hb 5 has a ratio of 7 and a high temperature for its central star of  K (Pottasch & Surendiranath 2007). On the other hand, NGC 2440 and M3-28 both have ratios near 4, with respective stellar temperatures of
  K (Heap 1987) and
  K (Preite-Martinez et al. 1989). Temperatures for the other sources are not known. Therefore, it is difficult to determine such a correlation. More data are clearly needed.
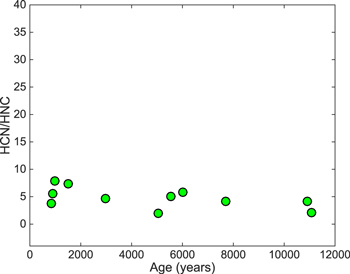
Figure 5 shows a plot of [HCN]/[HNC] versus nebular age. There does not appear to be any significant variation in the ratio with age. There are no sharp deviations in the general trend.
Figure 5. Plot of [HCN]/[HNC] ratio (assuming clumping) vs. PN age in years. The ratio appears to be relatively stable over ∼10,000 years, indicating that, by the PN stage, the abundances of HCN and HNC have "frozen out" from those generated in the PPNe phase.
Download figure:
Standard image High-resolution image
The [HCN]/[HNC] ratios found in this work are lower than those typically seen in AGB stars. Woods et al. (2003) measured [HCN]/[HNC] ratios of ∼40–300 for the seven carbon stars observed. The value for IRC+10215 is near 300. The ratio apparently drops in the PPN stage. The ratio for CRL2688 is ∼1 (Zhang et al. 2013), while the value in PPN IRAS 16594-4656 is about 3.4 (Woods et al. 2005). Herpin & Cernicharo (2000) found relatively equal column densities for HCN and HNC in the PPN CRL618, implying [HCN]/[HNC] ∼ 1, while Morris et al. (1987) found a ratio of ∼2.2 for the Calabash Nebula.
The rise in HNC with respect to HCN in the PPN phase has been attributed to an increase in ionization. As discussed, HCN is effectively produced by LTE chemistry in the inner envelope of AGB stars, while HNC is not, thereby producing the high [HCN]/[HNC] ratios often observed. In the PPN stage, the increase in ionization drives reactions that lead to the formation of HNC through the effective intermediate, HCNH+. The ion HCNH+ can form from several different ion-neutral reactions (e.g., Daniel et al. 2012):


HNC is then produced via dissociative electron recombination, Equation (1), where the branching ratio is estimated to be unity (Talbi 1999). Additionally, increased UV radiation in the PPN and PN phases is effective in creating radical species (Daniel et al. 2012). HNC may also form through the reaction

Over time, these reactions skew the [HCN]/[HNC] ratio toward unity. Observations indicate that the rise of HNC over HCN occurs principally in PPNe. The ratio then appears to "freeze out" into the PN phase. The striking consistency of the [HCN]/[HNC] ratio across the Helix Nebula is evidence of such a freeze-out.
5.3. Comparison with Diffuse Cloud Abundances
Liszt & Lucas (2001) and Liszt et al. (2006) observed both HCN and HNC (among other molecules) in a set of seven diffuse clouds observed against background extragalactic sources. The HCN abundances ranged from (0.14–0.5) × 10−8 with respect to H2, while the HNC abundances fell between (0.03–0.10) × 10−8. The authors noted both HCN and HNC were much more plentiful in diffuse clouds than predicted by models of quiescent low-density gas-phase chemistry. The reaction rates necessary to form CN-bearing molecules are simply too slow to explain the observed abundances. Based on their measurements, Liszt et al. (2006) estimated an average [HCN]/[HNC] ratio of 5.
The abundances for HNC in diffuse clouds are 1–2 orders of magnitude lower than the abundances measured for PNe. Furthermore, the average [HCN]/[HNC] ratio found for diffuse clouds is remarkably close to that found in PNe: 5 versus 1–8. These results bolster the argument made in Schmidt & Ziurys (2016) and Ziurys et al. (2015, 2016) that the polyatomic molecules observed in diffuse clouds originate in PNe ejecta. The clumps of molecular material, mixed with dust, disperse into the diffuse ISM and later coalesce into clouds.
6. CONCLUSIONS
This work, in conjunction with past observations, has demonstrated that HNC is prevalent in many PNe, as has been also found for HCN and HCO+. Both HNC abundances and the [HCN]/[HNC] ratio measured in PNe are comparable to those found in PPNe, suggesting that much of the chemistry altering AGB abundances occurs in the protoplanetary phase. The lack of variation in the [HCN]/[HNC] ratio across eight positions in the Helix is further evidence for the predominance of PPNe synthesis. This study also strongly bolsters the concept that molecular abundances appear to remain relatively constant across the ∼10,000 year lifespan of PNe, as argued in Schmidt & Ziurys (2016). Finally, fractional abundances for HNC were found to be 1–2 magnitudes higher than those seen in diffuse clouds, supporting the idea that PNe provide molecular material to the ISM.
This research was supported by NSF grants AST-1515568, AST-1140030, and by the NASA NExSS program via grant NNX13ZDA017C. The Kitt Peak 12 m and the SMT are operated by the Arizona Radio Observatory (ARO), University of Arizona, with partial support through the NSF University Radio Observatories (URO) program (AST-1140030).