


Abstract
The structural isomers ethanol (CH3CH2OH) and dimethyl ether (CH3OCH3) were detected in several low-, intermediate-, and high-mass star-forming regions, including Sgr B2, Orion, and W33A, with the relative abundance ratios of ethanol/dimethyl ether varying from about 0.03 to 3.4. Until now, no experimental data regarding the formation mechanisms and branching ratios of these two species in laboratory simulation experiments could be provided. Here, we exploit tunable photoionization reflectron time-of-flight mass spectrometry (PI-ReTOF-MS) to detect and analyze the production of complex organic molecules (COMs) resulting from the exposure of water/methane (H2O/CH4) ices to energetic electrons. The main goal is to understand the formation mechanisms in star-forming regions of two C2H6O isomers: ethanol (CH3CH2OH) and dimethyl ether (CH3OCH3). The results show that the experimental branching ratios favor the synthesis of ethanol versus dimethyl ether (31 ± 11:1). This finding diverges from the abundances observed toward most star-forming regions, suggesting that production routes on interstellar grains to form dimethyl ether might be missing; alternatively, ethanol can be overproduced in the present simulation experiments, such as via radical–radical recombination pathways involving ethyl and hydroxyl radicals. Finally, the PI-ReTOF-MS data suggest the formation of methylacetylene (C3H4), ketene (CH2CO), propene (C3H6), vinyl alcohol (CH2CHOH), acetaldehyde (CH3CHO), and methyl hydroperoxide (CH3OOH), in addition to ethane (C2H6), methanol (CH3OH), and CO2 detected from infrared spectroscopy. The yield of all the confirmed species is also determined.
Export citation and abstract BibTeX RIS
1. Introduction
Complex organic molecules (COMs)—organic molecules containing several atoms of carbon, hydrogen, oxygen, and nitrogen, such as aldehydes (HCOR), ketones (RCOR'), carboxylic acids (RCOOH), esters (RCOOR'), amides (RCONH2), and nitriles (RCN), with R and R' being an alkyl group—are ubiquitous in the interstellar medium (ISM). An understanding of the abiotic formation pathways of these key classes of COMs is of core significance to the laboratory astrophysics and astrochemistry communities to rationalize the astrochemical and astrobiological evolution of the ISM. The formation of COMs has been associated with the processing of low-temperature (10 K) ice-coated interstellar grains by ionizing radiation, such as energetic galactic cosmic rays (Prasad & Tarafdar 1983; Kaplan & Miterev 1987) and the internal ultraviolet photon field (Prasad & Tarafdar 1983) in molecular clouds—the nurseries of stars and planetary systems—and star-forming regions (Herbst 2006). Laboratory studies provided compelling evidence that the interaction of ionizing radiation with interstellar ices can lead to a broad spectrum of COMs (Herbst 2005), including carboxylic acids such as acetic acid (CH3COOH; Bennett & Kaiser 2007a), aldehydes such as acetaldehyde (CH3CHO; Bennett et al. 2005b), the sugar glycolaldehyde (HCOCH2OH; Maity et al. 2014a), amino acids (Holtom et al. 2005), glycerol (Kaiser et al. 2015), and even dipeptides (Kaiser et al. 2013). These interstellar ices in molecular clouds consist mainly of water (H2O), methanol (CH3OH), carbon monoxide (CO), carbon dioxide (CO2), methane (CH4), and ammonia (NH3; Allamandola et al. 1999; Gibb et al. 2004). Accretion of the densest parts of cold molecular clouds ultimately leads to gravitational collapse followed by luminosity outbursts in the early stages of star formation (Taquet et al. 2016). In this case, heating can raise the temperatures of the star envelope to up to 300 K, thus leading to a sublimation of the molecules from ice-coated, processed grains into the gas phase, where they can be searched for and detected by radio telescopes (Cummins et al. 1986). Since the transition from a cold molecular cloud to star-forming regions depends on the molecular composition (Myers & Benson 1983; Myers 1983), it is imperative to unravel the basic chemical processes of how COMs are formed. A detailed understanding of the formation of key classes of COMs is crucial to test chemical models of molecular clouds and star-forming regions.
A comprehensive unraveling of the synthesis of structural isomers—molecules with the same molecular formula but different connectivities of atoms—of COMs is of particular importance, as these molecules are utilized as key tracers to determine the physical and chemical conditions of interstellar environments and to test chemical models of molecular clouds and star-forming regions. Even the formation of the chemically simplest isomer pair ethanol (CH3CH2OH; also known as ethyl alcohol) and dimethyl ether (CH3OCH3; also called methoxymethane) has not been resolved to date.
Dimethyl ether was first observed in 1974 in emission toward the Orion Nebula through transitions at 90.9, 86.2, and 31.1 GHz (Snyder et al. 1974). One year later, ethanol (CH3CH2OH) was detected in the trans-conformation toward the Sagittarius B2 (Sgr B2) molecular cloud through transitions at 85.2, 90.1, and 104.8 MHz (Zuckerman et al. 1975). The detection of the gauche conformation of ethanol was made in 1997 by Pearson et al. (1997) toward the Orion KL nebula. Recent observations of both ethanol and dimethyl ether in the same source include detections made toward the high-mass star-forming regions NGC 6334 IRS1, G24.78, W3(H2O), W33A (Bisschop et al. 2007), W51 e2, G34.3+0.2 (Lykke et al. 2015), G31.41+0.31 (Rivilla et al. 2017), and Orion KL (White et al. 2003; Crockett et al. 2014). Detections of both molecules were also made toward the intermediate-mass star-forming region NGC 7129 FIRS2 (Fuente et al. 2014) and low-mass star-forming regions NGC 1333 IRAS 2A and IRAS 4A (Taquet et al. 2015). Requena-Torres et al. (2006) reported the detection of the two C2H6O isomers in 23 molecular clouds toward the Galactic center, including Sgr B2N, Sgr B2M, MC G+0.20-0.03 (Sickle), and MC G+0.13+0.02 (Thermal Radio Arches; TRA). Detections of at least one of the two isomers include the detection of ethanol toward Orion KL (Comito et al. 2005; Brouillet et al. 2013), W51 M (Millar et al. 1988), NGC 7538 IRS1 (Bisschop et al. 2007), and the molecular cloud associated with the ultra-compact H ii region G34.3+0.15 (Millar et al. 1995), and the detection of dimethyl ether toward the low-mass protostar IRAS 16293-2422 (Cazaux et al. 2003; Richard et al. 2013) and the high-mass star-forming regions G327.3-0.6 (Bisschop et al. 2013) and G75.78 (Bisschop et al. 2007). Overall, in the sources in which both C2H6O isomers were detected, the relative abundances of ethanol to dimethyl ether are low, varying from a minimum of 0.03 toward NGC 6334 IRS1 (Bisschop et al. 2007) to a maximum of 3.46 toward Orion KL (White et al. 2003).
So far, no conclusive pathway has been presented on the formation mechanism of ethanol and dimethyl ether (Bennett & Kaiser 2007b; Lykke et al. 2017). Models of gas-phase-only chemistry involving complex networks of ion-molecule reactions (Charnley et al. 1995) yield fractional abundances of both isomers that are several orders of magnitude less than observed (Herbst & Leung 1989; Millar et al. 1991; Charnley et al. 1995; Wakelam et al. 2010). The literature suggests an alternative to gas-phase reactions, proposing that species such as dimethyl ether and ethanol are first formed on interstellar grains in cold molecular clouds at temperatures around 10 K and then injected into the gas phase in star-forming regions once the temperature of the grains increases and the molecules sublime (e.g., Tielens & Hagen 1982; van Dishoeck 2009; Brouillet et al. 2013). But even these refined models do not fit the observed abundances of ethanol or dimethyl ether (Peeters et al. 2006). Therefore, the outcome of these models suggests that key production routes to ethanol and dimethyl ether are missing. Current astrochemical models simulating the formation of COMs on interstellar grains postulate that the ice mantle is chemically inert and that only the ice surface takes part in the synthesis of newly formed molecules. This dramatically limits the validity of currently existing models, since it is well established that an interaction of ionizing radiation with ices of a few 100 nm thickness can lead to the formation of COMs via nonequilibrium processes (Bennett et al. 2005b; Abplanalp et al. 2016b). However, these cosmic-ray-triggered nonequilibrium processes have only recently been incorporated into astrochemical reaction networks modeling the formation of the ethanol-dimethyl ether isomer pair (Drozdovskaya et al. 2015).
The present study explores, via laboratory simulation experiments, the effects of the interaction of energetic electrons with astrophysically relevant water/methane ices in order to better understand the formation mechanisms of COMs in the ISM, with particular interest in the synthesis of ethanol and dimethyl ether. The energetic electrons were employed in these experiments to mimic the effects of secondary electrons generated in the track of energetic galactic cosmic-ray particles interacting with ice-coated interstellar grains (Kaiser & Roessler 1998; Bennett et al. 2005a; Alizadeh et al. 2015; Abplanalp et al. 2016b). The water/methane mixture was chosen because of the ubiquity of these species in star-forming regions where both ethanol and dimethyl ether were detected. Water was observed toward multiple lines of sight (e.g., Willner et al. 1982; Murakawa et al. 2000; Gibb et al. 2004), and it represents the dominating component of interstellar ices, whereas methane (CH4)—the simplest fully saturated hydrocarbon—has been detected at levels of a few percent toward molecular clouds such as NGC 7538:IRS9, W33A (Lacy et al. 1991; Boogert et al. 1996), and Orion KL (Womack et al. 1996). It should be noted that the interaction of water/methane mixtures with ionizing radiation in terms of photons (e.g., Hodyss et al. 2009; Weber et al. 2009) and charged particles (e.g., Moore & Hudson 1998) at temperatures from 20 to 60 K and doses up to 17 eV molecule–1 has been investigated over five decades (e.g., Stief et al. 1965; Weber et al. 2009; Öberg et al. 2010). Species commonly detected in these studies are carbon monoxide (CO), carbon dioxide (CO2), formaldehyde (H2CO), methanol (CH3OH), and ethane (C2H6; Hodyss et al. 2009), plus a tentative detection of ethanol (Moore & Hudson 1998). However, these studies rely entirely on Fourier transform infrared spectroscopy (FTIR) and quadrupole mass spectrometry (QMS) coupled with electron impact ionization (EI) to reveal their results. Although FTIR is very sensitive and efficient for identifying small molecules and functional groups, it is known to have severe limitations regarding the identification of even moderately complex molecules whose absorptions of the functional groups are convoluted (e.g., Bergantini et al. 2014; Abplanalp et al. 2016a). The irradiation of small molecules bearing elements such as hydrogen (H), carbon (C), and oxygen (O) leads to nonequilibrium reactions that output more complex species that simply cannot be discerned by FTIR spectroscopy due to often-overlapping absorption bands from common functional groups. By contrast, reflectron time-of-flight mass spectrometry (ReTOF-MS) coupled with tunable soft photoionization (PI), as exploited in the present study, has been shown to be capable of filling the crucial gaps left by FTIR spectroscopy (e.g., Jones & Kaiser 2013; Abplanalp et al. 2016a). This is especially notable when synthesizing COMs, which often present multiple overlapped features in the infrared region, making the analysis of individual species virtually impossible. In this sense, previous studies from the literature have provided no more than a glimpse of the entangled outcome from the nonequilibrium reactions involving water (H2O) and methane (CH4), as this work will show. Additional fully deuterated (D2O/CD4) experiments were carried out under the same conditions as the natural isotope experiments in order to verify the assignments of the PI-ReTOF-MS via the mass shifts of the newly synthesized molecules.
2. Experimental Methods
The experiments were carried out in a contamination-free stainless-steel ultrahigh-vacuum chamber (UHV) evacuated to a base pressure of a few 10−11 Torr using oil-free magnetically suspended turbomolecular pumps and dry scroll backing pumps. The ice mixtures were produced via deposition of the gases on a polished silver (Ag) substrate coupled to a cold finger at a temperature of 5.5 ± 0.2 K. The cold finger, machined from oxygen-free high-conductivity copper, was connected to a closed-cycle helium cryostat (Sumitomo Heavy Industries, RDK-415E) interfaced to the UHV chamber in a way that allowed it to be rotated in the horizontal plane and translated in the vertical plane, as required during the different stages of the experiment. Indium foil was placed between the silver substrate and the cold finger in order to firmly attach the substrate and ensure efficient thermal conductivity. The gases used in the experiment—water (H2O, Fischer Chemical, HPLC grade; D2O, Cambridge Isotope Laboratories, 99.96% atom D) and methane (CH4, 99.999%, Specialty Gases of America; CD4, Aldrich, 99%+ atom D)—were premixed in a gas-mixing chamber (GMC) otherwise kept at a pressure of 10−8 Torr. The gas mixture was deposited using a glass capillary array located 30.0 ± 0.5 mm away from the silver substrate. A leak valve was used to control the gas flow into the chamber during deposition at pressures in the main chamber of (2.0 ± 0.2) × 10−8 Torr until the intended ice thickness of 700 ± 50 nm was achieved.
In order to prevent the electrons from reaching the silver substrate, the ice samples were condensed at a 700 ± 50 nm thickness, since the maximum penetration depth of the 5 keV electrons in the H2O/CH4 ice was determined to be 550 ± 50 nm. This calculation was carried out via Monte Carlo simulations using the CASINO software (version 2.42; Drouin et al. 2007). The thickness of the ice sample was extracted online and in situ by the interference pattern (fringes) produced by a 632.8 nm HeNe laser (CVI Melles Griot, 25-LHP-230) as the laser beam was being reflected off the substrate into a photodiode during the deposition of the gas mixture (Turner et al. 2015). The ice thickness (d) is related to the number of observed fringes (m), the wavelength (λ) and angle of incidence (θ) of the HeNe laser, and the refractive index (η) of the ice, according to Equation (1) (Turner et al. 2015; Förstel et al. 2016). The refractive index of 1.3 for the H2O/CH4 9/1 mixture was applied based on data from the literature (Satorre et al. 2008; Luna et al. 2012):

To achieve the intended 9/1 ratio of H2O/CH4, a series of calibration experiments were performed prior to the irradiation experiments. In the calibration experiments, neat ices with 250 ± 25, 375 ± 37, and 500 ± 50 nm of thickness were individually deposited in the substrate at 5.5 ± 0.2 K and then heated at a rate of 1 K minute−1 until complete sublimation. The samples were constantly monitored by Fourier-transformed FTIR (Nicolet 6700) in the 6000–600 cm−1 (1.66–16.6 μm) range, 4 cm−1 resolution; the subliming molecules were analyzed by a quadrupole mass spectrometer (EI-QMS; Extrel, Model 5221) operating in residual-gas analyzer (RGA) mode in the mass-to-charge (m/z) range of 10–100 amu. The number of molecules in each sample (n#) was determined by the relation between the mass (m) of the sample, Avogadro's constant (Na), and the molar mass (M) of the species:

The mass (m) of the ice sample can be calculated by the relation between the volume of the sample, a cylinder with base area A = 0.8 cm2, the sample thickness (d), and the density (ρ) of the ice:

The density of the methane ice considered was 0.48 ± 0.02 g cm−3 (Satorre et al. 2008; Luna et al. 2012), and the density of the amorphous water ice considered was 0.93 ± 0.04 g cm−3 (Jenniskens et al. 1998). Since the integrated ion current of the molecular and fragment peaks of water and methane (accounting for overlapping ion counts such as O+ and  at m/z = 16) in the RGA is directly proportional to the thickness of the ices (and the number of molecules in the ices) as obtained via laser interferometry, a ratio of the thickness and hence of the molecular composition can be obtained by relating the number of counts in the RGA data in each calibration experiment to the number of counts of water and methane during the sublimation of the nonirradiated H2O/CH4 ice mixture (see Appendix). Finally, the (9.4 ±1.5)–to–1 (nominally 9/1) water/methane ratio in the ice was achieved with partial pressures of 18.1 ± 0.1 and 1.2 ± 0.1 Torr for water and methane, respectively, in the GMC.
The ice samples were monitored by the RGA and FTIR spectrometers before, during, and after the irradiation. The irradiation was carried out using 5 keV electrons at 96 ± 5 nA of current for 1 hr at an angle of 70° relative to the surface normal of the Ag substrate. Based on CASINO simulations (Drouin et al. 2007), this yields a dose of 9.27 ± 0.64 eV molecule−1 using the parameters compiled in Table 1 (Förstel et al. 2015; Abplanalp & Kaiser 2017). After irradiation, the sample was kept isothermally at 5.5 ± 0.2 K for 1 hr until the beginning of the temperature-programmed desorption (TPD) phase. The TPD consists of warming the sample from 5.5 K (irradiation temperature) to 300 K at a rate of 0.5 K minute−1. During the TPD, the subliming molecules are continuously monitored by the RGA, and the ice contents are analyzed by a tunable vacuum-ultraviolet (VUV) source coupled with PI-ReTOF-MS. In this technique, pulsed (30 Hz) coherent VUV light is used to softly ionize the molecules as they desorb from the ice into the gas phase. The VUV source is comprised of two neodymium-doped yttrium aluminum garnet lasers (Nd:YAG; Spectra Physics), two dye lasers (tunable from 350 to 900 nm; Sirah Lasertechnik), and a pulsed rare gas jet used as a nonlinear medium for the resonance-enhanced VUV generation (Jones & Kaiser 2013). Since the source of the VUV light is tunable, experiments can be done using specific wavelengths/energies in order to ionize only species that have an ionization energy (IE) above a certain threshold, allowing selective photoionization of the species synthesized in the processed ice. The setup is capable of generating photons in the 6.4–11.8 eV (194–105 nm) range; in this particular study, photons with 10.49 eV (118.19 nm), 10.25 eV (120.96 nm), 9.92 eV (125.00 nm), and 9.70 eV (127.80 nm) were exploited. A blank experiment was performed by collecting a background PI-ReTOF-MS spectrum to be used as a reference for the irradiation experiments. The blank experiment was conducted following the same procedures as the irradiation experiments, except for the fact that the sample was not electron-irradiated. The ice composition, thickness, dose of irradiation, and photoionization energies exploited in the experiments are given in Table 2.
Table 1. Data Applied to Calculate the Irradiation Dose per Molecule in the H2O/CH4 Ice
| Initial kinetic energy of the electrons, Einit (keV)a | 5 |
| Irradiation current, I (nA)a | 96 ± 5 |
| Total number of electronsa | (2.15 ± 0.22) × 1015 |
| Average penetration depth, l (cm)a | (2.66 ± 0.52) × 10−5 |
| Average kinetic energy of backscattered electrons, Ebs (keV)a | 3.48 ± 0.32 |
| Fraction of backscattered electrons, fbsa | 0.41 ± 0.10 |
| Average kinetic energy of transmitted electrons, Etrans (eV)a | 0 |
| Fraction of transmitted electrons, ftransa | 0 |
| Density of the ice, ρ (g cm−3) | 0.92 ± 0.10 |
| Irradiated area, A (cm2) | 1.0 ± 0.1 |
| Total # of molecules processed | (8.28 ± 0.21) × 1017 |
Note.
aParameters obtained from CASINO.Download table as: ASCIITypeset image
As mentioned, VUV light is exploited to softly ionize the molecules as they sublime from the sample during TPD; the ionized species are repelled, accelerated by an electrical field, and then detected. Briefly, the 10.49 eV light is generated by the third harmonic (354.66 nm) of the fundamental (1064 nm) of an Nd:YAG laser (Spectra Physics, PRO-250; 30 mJ per pulse) via frequency tripling (ωVUV = 3ω1) in 2.0 × 10⁻⁴ Torr xenon (Xe) gas (99.999%, Specialty Gases of America) as the nonlinear medium. The VUV light is separated from the fundamental by an off-axis, differentially pumped, lithium fluoride (LiF) biconvex lens (ISP Optics) and then directed to 1 mm above the sample surface, where the sublimating molecules are photoionized. In the second tunable experiment, 10.25 eV (120.96 nm) VUV light was generated by resonant four-wave mixing (ωVUV = 2ω1 − ω2) in 1.2 × 10⁻⁴ Torr of krypton (99.999%, Specialty Gases of America) as the nonlinear medium.
Table 2. Ice Composition, Thickness, Dose, and Photoionization Energies Exploited in the Experiments
| Ice Sample (composition) | Thickness (nm) (±10%) | Dose (eV molecule–1) | Tunable VUV Energy (eV)a | Obs. |
|---|---|---|---|---|
| CH4 (pure) | 250, 375, 500 | 0 | ⋯ | b |
| H2O (pure) | 250, 375, 500 | 0 | ⋯ | b |
| CH3OCH3 (pure) | 700 | 0 | ⋯ | c |
| C2H5OH (pure) | 700 | 0 | ⋯ | c |
| H2O/CH4 (9/1) | 250, 500 | 0 | ⋯ | b |
| H2O/CH4/CH3OCH3 (9/1/0.1) | 700 | 0 | ⋯ | d |
| H2O/CH4/C2H5OH (9/1/0.1) | 700 | 0 | ⋯ | d |
| H2O/CH4 (9/1) | 700 | 0 | 10.49 | e |
| H2O/CH4 (9/1) | 700 | 9.27 ± 0.64 | 10.49 | ... |
| D2O/CD4 (9/1) | 700 | 9.27 ± 0.64 | 10.49 | ... |
| H2O/CH4 (9/1) | 700 | 9.27 ± 0.64 | 10.25 | ... |
| H2O/CH4 (9/1) | 700 | 9.27 ± 0.64 | 9.92 | ... |
| H2O/CH4 (9/1) | 700 | 9.27 ± 0.64 | 9.70 | ... |
Notes.
aEnergy of the VUV light used during the TPD for selective photoionization and detection by the PI-ReTOF-MS of the species desorbing from the sample. bCalibration experiments to determine the partial pressure of each gas needed in the GMC in order to get the intended astrophysically relevant 9/1 ratio of H2O/CH4 ice. cCalibration experiments: neat ices were used in the determination of the infrared features of the parent species. dCalibration experiments to analyze the desorption profile of CH3OCH3 (dimethyl ether) and C2H5OH (ethanol) during the TPD for comparison purposes with the irradiation experiments. eBlank experiment: the ice is not processed by electron irradiation; the PI-ReTOF-MS spectrum collected is used as a reference for the irradiation experiments.Download table as: ASCIITypeset image
For this purpose, 606.948 nm (2.04 eV) light was generated by the first dye laser (Sirah Lasertechnik, Cobra-Stretch) using Rhodamine 640 and Rhodamine 610 dyes (Exciton) and was pumped by the second harmonic (532 nm, 2.33 eV) of the fundamental of an Nd:YAG laser (1064 nm, 1.17 eV; Spectra Physics, PRO-270-30) and frequency tripling of the dye laser output (606.948 nm) using β-BaB2O4 (BBO) crystals (44° and 77°), resulting in the ω1 6.128 eV (202.316 nm) photons. These were mixed with the ω2 2.00 eV (617.92 nm) light produced by the second dye laser (Sirah Lasertechnik, PrecisionScan) using Rhodamine 640 and Rhodamine 610 dyes as the second dye laser was pumped by the second harmonic (532 nm, 2.33 eV) of the fundamental of the second Nd:YAG laser. The VUV light was separated by the LiF biconvex lens and directed to the main chamber. The third tunable experiment was done by producing 9.92 eV (125 nm) VUV light and exploiting resonant four-wave mixing (ωVUV = 2ω1 − ω2) in krypton utilizing the same procedure described above for the generation of the ω1 202.316 nm (6.128 eV) photons, which were combined with the second harmonic (ω2 532 nm, 2.33 eV) of the fundamental of the second Nd:YAG laser and then separated by the LiF biconvex lens and directed to the main chamber. Resonant four-wave mixing (ωVUV = 2ω1 − ω2) in krypton was also applied in the fourth tunable experiment, as 9.70 eV (127.8 nm) VUV light was generated by mixing ω1 6.128 eV (202.316 nm) photons with the ω2 2.55 eV (484.98 nm) photons generated by the second dye laser using Coumarin 480 (Exciton) dye. Table 3 summarizes the parameters of the two-photon resonance-enhanced VUV generation for each of the energies employed in the experiments. The photon flux of the VUV light was measured online and in situ by a National Institute of Standards and Technology (NIST)-calibrated photodiode.
Table 3. Parameters of the VUV Generation in the Experiments
| Photoionization energy (eV) | 10.49 | 10.25 | 9.92 | 9.70 | |
| Wavelength (nm) | 118.19 | 120.96 | 125.00 | 127.80 | |
| ω1 | Wavelength (nm)—Nd:YAG laser #1 | 354.66 | 532 | 532 | 532 |
| Wavelength (nm)—dye laser #1 | ⋯ | 606.948 | 606.948 | 606.948 | |
| ω2 | Wavelength (nm)—Nd:YAG laser #2 | ⋯ | 532 | 532 | 354.66 |
| Wavelength (nm)—dye laser #2 | ⋯ | 617.92 | ⋯ | 484.98 | |
| Nonlinear medium | Xe | Kr | Kr | Kr | |
| VUV photon flux (×1013 photons s−1) | 2.6 ± 0.5 | 3.1 ± 0.6 | 1.7 ± 0.3 | 1.3 ± 0.2 | |
Download table as: ASCIITypeset image
After the irradiation, TPD studies were conducted by heating the ices to 300 K at a rate of 0.5 K minute−1. The sublimed products were monitored, after single-photon ionization by VUV light, by a customized PI-ReTOF-MS. The ions were detected by a multichannel plate in a dual chevron configuration. The signals were amplified by a fast preamplifier (Ortec 9305) and shaped with a 100 MHz discriminator. The spectra were recorded with a personal-computer-based multichannel scalar (FAST ComTec, P7888-1 E) with a bin width of 4 ns, which was triggered at 30 Hz (Quantum Composers, 9518) and 3600 sweeps per mass spectrum at every 1 K change in temperature.
3. Results
3.1. Infrared Spectroscopy
The infrared spectra of the binary ice consisting of water (H2O) and methane (CH4) before and after 1 hr of irradiation by energetic electrons are shown in Figure 1. Zoomed views of the infrared regions highlighting the formation of new species in the processed ice are given in Figure 1(b) (2970–2760 cm−1), Figure 1(c) (2400–2300 cm−1), and Figure 1(d) (1200–950 cm−1). The full features of the infrared spectra are assigned in Table 4. Several absorption bands of methane (CH4) are observed in the infrared spectrum of the unirradiated ice, including bands at 4299, 4203, 3849, 3008, 2903, 2817, 2595, and 1301 cm−1. The water (H2O) bands observed in the unirradiated ice are identified at 3245, 1659, and 800 cm−1, along with the dangling O–H bonds at 3717, 3688, and 3657 cm−1 showing that the ice has amorphous structure. Amorphous water ice occurs when water vapor is slowly deposited at low temperatures (T < 100 K), and this is the form in which astrophysical water ice is often observed (Jenniskens & Blake 1996).
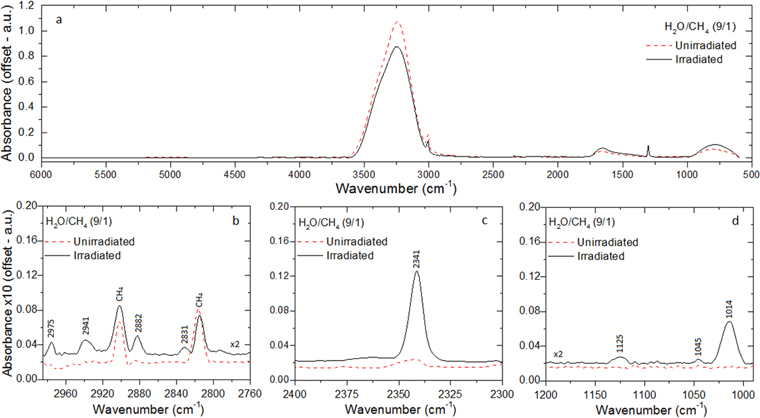
Figure 1. (a) Infrared spectrum of the H2O/CH4 (9/1) ice in the 6000–600 cm−1 (1.66–16.6 μm) region before (red dashed line) and after (black solid line) irradiation. (b) The 2970–2760 cm−1 region zoomed in. (c) The 2400–2300 cm−1 region. (d) The 1200–950 cm−1 region. The assignments of the bands are compiled in Table 4.
Download figure:
Standard image High-resolution imageTable 4. Infrared Absorption Features Recorded Before and After the Irradiation of Water/Methane (H2O/CH4)
| Absorptions Before Irradiation (cm−1) | Absorptions After Irradiation (cm−1) | Assignment | Carrier | References |
|---|---|---|---|---|
| 4299 | ν3 + ν4 (CH4) | Combination | Hodyss et al. (2009) | |
| 4203 | ν1 + ν4 (CH4) | Combination | Hodyss et al. (2009) | |
| 3849 | 3ν4 (CH4) | Overtone | Bennett et al. (2006) | |
| Ennis et al. (2011) | ||||
| 3717, 3688, 3657 | H2O | Dangling O–H bond | Zondlo et al. (1997) | |
| 3245 | ν1 (H2O) | O–H stretch | d'Hendecourt & Allamandola (1986) | |
| Gerakines et al. (1995) | ||||
| 3008 | ν3 (CH4) | Degenerate stretch | Hodyss et al. (2009) | |
| 2975 | ν10 (C2H6) | CH2 symmetric stretch/CH3 degenerate stretch/CH3 asymmetric stretch | Kaiser et al. (2014) | |
| νas (C3H8) | Abplanalp & Kaiser (2016c) | |||
| 2941 | ν8 + ν11 (C2H6) | Combination | Boudin et al. (1998) | |
| Hudson et al. (2014) | ||||
| 2882 | ν5 (C2H6) | CH3 stretch | Zhou et al. (2014) | |
| 2831 | ν3 (CH3OH) | C–H stretch | Wen et al. (1998) | |
| Bennett et al. (2007) | ||||
| 2903 | ν1 (CH4) | Symmetric stretch | Hodyss et al. (2009) | |
| 2817 | ν2 + ν4 (CH4) | Combination | Hodyss et al. (2009) | |
| Abplanalp & Kaiser (2016c) | ||||
| 2595 | 2ν4 (CH4) | Hodyss et al. (2009) | ||
| 2341 | ν3 (CO2) | C=O asymmetric stretch | Bennett et al. (2010) | |
| Oancea et al. (2012) | ||||
| Bergantini et al. (2014) | ||||
| 1659 | ν2 (H2O) | O–H bend | d'Hendecourt & Allamandola (1986) | |
| 1301 | ν4 (CH4) | Degenerate deformation | Hodyss et al. (2009) | |
| Abplanalp & Kaiser (2016c) | ||||
| Kaiser et al. (2014) | ||||
| 1125 | ν7 (CH3OH) | CH3 rock | Wen et al. (1998) | |
| Bennett et al. (2007) | ||||
| 1045 | Alcohola | CH3 deformation, C–C stretch, C–C–O stretch | Tong et al. (2010) | |
| Schriver et al. (2007) | ||||
| Moore & Hudson (2005) | ||||
| Plyler (1952) | ||||
| 1014 | ν8 (CH3OH) | C–O stretch | Wen et al. (1998) | |
| Bennett et al. (2007) | ||||
| 800 | νR (H2O) | H2O libration | d'Hendecourt & Allamandola (1986) | |
Note.
aTentative assignment. Tong et al. (2010) assigned the 1049 cm−1 band to 1-propanol dissolved in water, Schriver et al. (2007) assigned the 1046 cm−1 band to ethanol, Moore & Hudson (2005) assigned the 1046 cm−1 band to ethylene glycol dissolved in water, and Plyler (1952) assigned the 1047 cm−1 band to n-propanol.Download table as: ASCIITypeset image
The comparison of the spectrum of the unirradiated with the irradiated ices (Figure 1) shows a decrease in the area of the 3245 cm−1 H2O band, as well as in the 3008 cm−1 CH4 band, as a function of the irradiation time. However, for some water bands, such as the 3657 cm−1 (dangling O–H bonds), 1659 cm−1 (O–H bend), and 800 cm−1 (libration), as well as for the 1301 cm−1 (deformation) CH4 band, the area increases in the first 15 minutes of irradiation, steadily decreasing shortly thereafter until the end of the irradiation. This could be explained by changes in the structure of the ice, such as the case in which it loses some of its porosity, as seen by Strazzulla et al. (1992) and Jenniskens & Blake (1996). This would affect the infrared absorption coefficient (A-value) of the infrared bands, consequently changing the morphology and area in the infrared spectrum. Additionally, the production of new species with vibrational features in the same region as the features of the parent species, such as hydrogen peroxide (H2O2; Zheng et al. 2006, 2007), may also contribute to the observed changes in the infrared. The infrared spectra also show that multiple new absorption features arise as the result of the formation of new species in the ice. The new bands at 2975, 2941, and 2882 cm−1 match the features of ethane (C2H6), although the 2975 cm−1 band might have some contribution from propane (C3H8; Bennett et al. 2006; Hodyss et al. 2009; Abplanalp et al. 2015). The bands at 2831, 1125, and 1014 cm−1 are typical of methanol (CH3OH), as detected in previous works (e.g., Bennett et al. 2007; Bergantini et al. 2014; Maity et al. 2015). The peak at 2341 cm−1 is attributed to carbon dioxide (CO2). Finally, based on results from the literature, the band at 1045 cm−1 is assigned C–C and/or C–O vibrational modes of alcohols other than methanol.
3.2. PI-ReTOF-MS
During the TPD, the sublimating species from the irradiated ice are probed via PI-ReTOF-MS. Selective photoionization of the species synthesized in the processed ice is carried out by exploiting specific VUV photon energies, thus narrowing the range of possible candidates for the detected signals based on their IEs. Figure 2 shows the ion count from the PI-ReTOF-MS signals exploiting 10.49, 10.25, 9.92, and 9.70 eV photons. The overall ion counts of the products in the PI-ReTOF-MS spectra decrease as the photoionization energy is lowered from 10.49 to 9.70 eV because the photoionization cross section of the molecules decreases as the photoionization energy is lowered. The experiment with tunable VUV light at 10.49 eV (118.19 nm) was carried out to ionize and detect the highest possible number of species in our experiment, particularly ethanol (CH3CH2OH, IE = 10.48 eV). The experiment at 10.25 eV was performed to resolve the signal at m/z = 46, since this energy is lower than the IE of ethanol but higher than the IE of dimethyl ether (CH3OCH3, IE = 10.02 eV). The experiment at 9.92 eV (125.0 nm) was conducted to confirm the disappearance of the signal of dimethyl ether, reassuring the assignment of this species; the experiment at 9.70 eV (127.8 nm) was carried out to resolve the detection of methylethyl ether (IE = 9.72 eV) versus ethen-1, 2-diol (IE = 9.62 eV; Section 3.2.7). It is worth mentioning that the IEs of water (IE = 12.62 eV) and methane (IE = 12.61 eV) are higher than the highest energy used in the experiments; therefore, the parent species were not detected by the PI-ReTOF-MS instrument. Figure 3 reveals that significant ion counts were detected in the TPD phase from 140 to 160 K, i.e., the temperature range in which water desorbs. This suggests that a good fraction of the newly formed molecules were trapped in the porous water. In detail, the following findings shall be highlighted.
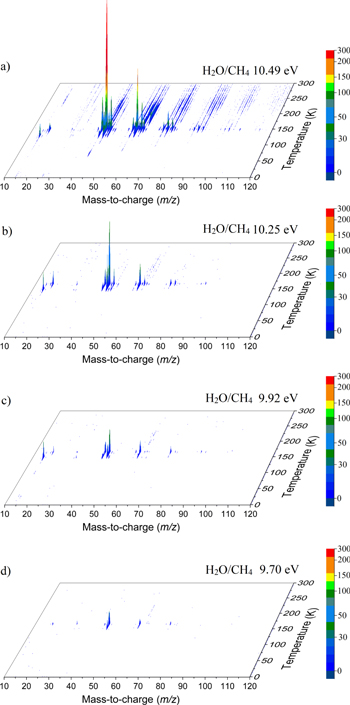
Figure 2. PI-ReTOF-MS data as a function of the temperature and mass-to-charge ratios of the ionized species.
Download figure:
Standard image High-resolution image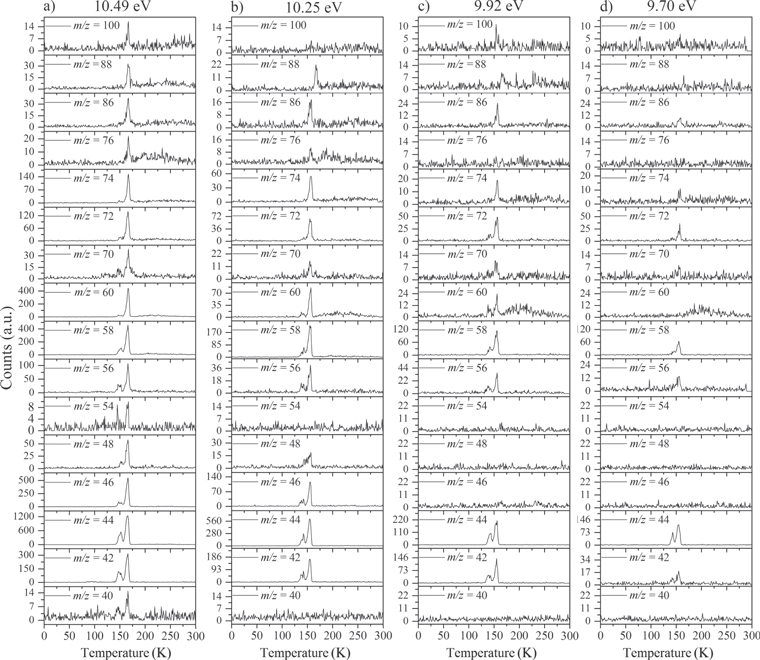
Figure 3. TPD profiles for distinct mass-to-charge ratios extracted from the PI-ReTOF-MS data at (a) 10.49 eV, (b) 10.25 eV, (c) 9.92 eV, and (d) 9.70 eV photoionization energy.
Download figure:
Standard image High-resolution image3.2.1. m/z = 40
The neutral species bearing carbon, hydrogen, and oxygen with a mass of 40 amu are dicarbon monoxide (C2O) and the isomers with the formula C3H4: propyne (methylacetylene; IE = 10.36 eV), allene (propadiene; IE = 9.69 eV), and cyclopropene (IE = 9.67 eV). Dicarbon monoxide is unstable upon matrix annealing; therefore, its detection is not possible in our system. Additionally, since the signal at m/z = 40 was only detected in the 10.49 eV VUV-tunable experiment (Figure 3), we conclude that m/z = 40 is due to propyne (CH3CCH). In the deuterium-substituted experiments, the mass of C3H4 was found to shift from 40 to 44 amu (C3D4; see Section A.2.) Propyne (CH3CCH) is a species commonly detected in a variety of sources, cold and warm, intra- and extra-Galactic, including Sgr B2 (Snyder & Buhl 1973), Orion A (Lovas et al. 1976), TMC-1 (Irvine et al. 1981), the galaxies M82 and NGC 253 (Fuente et al. 2005; Mauersberger et al. 1991), several Clemens–Barvainis (CB) objects, the L183 prestellar core (Turner et al. 1999), and several high- and low-mass star-forming regions (Miettinen et al. 2006; Caux et al. 2011).
3.2.2. m/z = 42
Neutral species with a molecular weight of 42 amu are the C3H6 isomers propene (propylene; IE = 9.73 eV) and cyclopropane (IE = 9.86 eV), in addition to the C2H2O isomers ketene (IE = 9.61 eV), ethynol (IE = N/A), and oxirene (IE = N/A). Since oxirene and ethynol are unstable species that decompose prior to sublimation, their detection in our experiments is not possible. The fact that the signal from m/z = 42 was present in the 9.70 eV experiment implies that ketene (Maity et al. 2014b) was synthesized in our experiments; detailed branching ratio calculations (Section 3.4) show that propene also contributes to the counts at m/z = 42 in the 9.92, 10.25, and 10.49 eV experiments. The synthesis and detection of cyclopropane can be ruled out based on results from experiments on methane ices performed by M. Abplanalp et al. (2017, in preparation). In deuterium-substituted experiments, the signal from C3H6 isomers would shift to 48 amu (C3D6), whereas the deuterated ketene would move to 44 amu. Signals were detected at m/z = 44 and 48, confirming the detection of ketene via D2-ketene (C2D2O) and of a C3H6 isomer as monitored via C3D6, propene. Ketene was first detected in Sgr B2 (Turner 1977); later detections were made in both low-mass and high-mass star-forming regions (e.g., Turner 1991; van Dishoeck & Blake 1995; Schöier et al. 2002; Ruiterkamp et al. 2007). Propene (C3H6) was detected toward the dark cloud TMC-1 by Marcelino et al. (2007).
3.2.3. m/z = 44
Signals at m/z = 44 can originate in acetaldehyde (CH3CHO, IE = 10.23 eV) and/or vinyl alcohol (ethenol; CH2CHOH, IE = 9.33 eV), both C2H4O isomers. Based on the photoionization energies employed, because the signal at m/z = 44 is visible even at 9.70 eV, it can be positively assigned to vinyl alcohol, although it may also hold a contribution of acetaldehyde, considering the experiments at 10.49 and 10.25 eV (see Section 3.4). Acetaldehyde was detected in high-mass star-forming regions such as Sgr B2 and Orion KL (Gottlieb 1973; Turner 1991) and in low-mass star-forming regions such as the HH 212 hot corino in Orion (Codella et al. 2016). Vinyl alcohol was detected toward Sgr B2 by Turner & Apponi (2001). In the perdeuterated experiments, the signal shifted from m/z = 44 to m/z = 48, indicating that the molecule(s) have four hydrogen/deuterium atoms. Note that carbon dioxide (CO2) and propane (C3H8) do not contribute to m/z = 44, since their IEs are 13.77 and 10.94 eV, respectively, which are higher than the detection threshold of 10.49 eV in these experiments. The same applies to ethylene oxide (IE = 10.56 eV), a molecule detected toward Sgr B2 by Dickens et al. (1997).
3.2.4. m/z = 46
Species with a molecular weight of 46 amu can only be linked with the molecular formulae of CH2O2 (dioxirane, formic acid) and C2H6O (dimethyl ether, ethanol). Dioxirane is an extremely unstable (Yang et al. 1995) heterocyclic compound that decomposes in the ice matrix prior to sublimation. Formic acid (HCOOH) has an IE of 11.33 eV; therefore, it cannot be photoionized in any of our experiments exploiting tunable VUV light. Based on these facts, we conclude that only dimethyl ether (CH3OCH3, IE = 10.02 eV) and ethanol (C2H5OH,IE = 10.48 eV) are neutral species with m/z = 46 that can be detected in our experiments. Ethanol should only be monitored in the 10.49 eV experiment, whereas dimethyl ether should be observable in the 10.49 and 10.25 eV experiments. Since the signal at m/z = 46 is not present in the 9.92 and 9.70 eV experiments (Figure 3), the assignment of dimethyl ether to m/z = 46 can be confirmed; however, this fact does not exclude the possibility that ethanol is also being formed in the irradiated ices, since ion counts were detected at 10.49 eV as well. As a next step, to confirm or eliminate the contribution of ethanol, calibration experiments were carried out in which the ices were doped separately with 1% dimethyl ether and 1% ethanol and the subliming species (without exposure to energetic electrons) were photoionized at 10.49 eV. Figure 4 shows the associated TPD profiles of the (a) irradiated H2O/CH4 (9/1) ice, (b) ethanol calibration—H2O/CH4/C2H5OH (9/1/0.1), and (c) dimethyl ether calibration—H2O/CH4/CH3OCH3 (9/1/0.1).

Figure 4. TPD profile of m/z = 46 in (a) irradiated H2O/CH4 (9/1) ice; (b) the ethanol calibration experiment: nonirradiated H2O/CH4/C2H5OH (9/1/0.1) ice; and (c) the dimethyl ether calibration experiment: nonirradiated H2O/CH4/CH3OCH3 (9/1/0.1) ice. All the data were collected at 10.49 eV photoionization energy.
Download figure:
Standard image High-resolution imageSo far, based on the photoionization energies, the synthesis of dimethyl ether as a consequence of the irradiation of H2O/CH4 is confirmed. Therefore, the investigation concerning the production of ethanol continues through the examination of the profile and fine structures of the m/z = 46 peak from the TPD phase of the experiments. The TPD profile of the irradiated H2O/CH4 (9/1) ice (Figure 4(a)) displays two sublimation events (events II and III): sublimation event II occurs between 130 and 145 K, and event III occurs between 145 and 160 K. In Figure 4(b), from the ethanol-doped experiment (H2O/CH4/C2H5OH, 9/1/0.1), two events are also perceptible: a shoulder (event II) appears between 130 and 145 K, and a sharp peak appears between 145 and 160 K (event III). However, in the TPD profile of the dimethyl ether–doped experiment (H2O/CH4/CH3OCH3, 9/1/0.1; Figure 4(c)), three sublimation events are observed: event I, between 100 and 130 K; event II, between 130 and 145 K; and event III, between 145 and 160 K.
The fact that event I appears absent in the irradiation experiment (Figure 4(a)) is because the amount of dimethyl ether is low if compared to the amount of water in the ice (see Section 5). Table 5 shows the ion counts from m/z = 46 integrated over the temperature range corresponding to events II and III for each experiment. Therefore, according to the data shown in Table 5, in the ethanol calibration experiment, the area of event II corresponds to 5% compared to the area of event III; in the dimethyl ether calibration experiment, the area of event II is 330% compared to the area of event III. Finally, in the actual experiment, the area of event II is only 22% compared to the area of event III. This suggests that an excess of signal from event II is due to the presence of dimethyl ether, as confirmed above. By contrast, the excess ion counts of event III must be due to the presence of ethanol. Therefore, both ethanol and dimethyl ether are produced in the experiments. Accounting for the photoionization cross sections of ethanol and dimethyl ether, the ion counts, and the calibration experiments, only 3% ± 1% of the counts at m/z = 46 are dimethyl ether, yielding a ratio of ethanol to dimethyl ether of 31 ± 11 to 1. Note that, in the fully deuterated ices (D2O/CD4), the signal shifts from m/z = 46 to m/z = 52, indicating the presence of six hydrogen/deuterium atoms.
Table 5. Counts at m/z = 46 from the PI-ReTOF-MS Spectra, Integrated Over the Temperature Range Corresponding to Sublimation Events II and III
| Experiment | Area (Counts) | ||
|---|---|---|---|
| Event II | Event III | Ratio II/III | |
| H2O/CH4/C2H5OH (9/1/0.1) | 1700 ± 204 | 32920 ± 1950 | 0.051 ± 0.007 |
| H2O/CH4/CH3OCH3 (9/1/0.1) | 73928 ± 2651 | 22394 ± 687 | 3.30 ± 0.15 |
| H2O/CH4 (9/1) irradiated | 783 ± 93 | 3573 ± 228 | 0.22 ± 0.03 |
Download table as: ASCIITypeset image
3.2.5. m/z = 48
There are three candidates for the signal at m/z = 48: ozone (O3), methyl hydroperoxide (CH3OOH), and methanediol (CH2(OH)2). The detection of ozone can be excluded based on its IE of 12.53 eV, which is above the highest photon energy of 10.49 eV applied here. Since methanediol (CH2(OH)2) was found to lose water (H2O) prior to sublimation upon annealing, thus reacting to formaldehyde (H2CO), we propose that the signal at m/z = 48 originates from methyl hydroperoxide (CH3OOH). Unfortunately, the IEs of methyl hydroperoxide are not available in the literature. According to Thelen et al. (1993), methyl peroxide is produced from CH3O + OH via methane oxidation. As verified in the deuterated experiments, the data reveal a shift of the masses from 48 to 52, proposing that the species formed holds four hydrogen/deuterium atoms (see Section A.2).
3.2.6. m/z = 54
There are two groups of isomers that hold a mass of 54 amu: C4H6 and C3H2O. Based on the IEs of the C4H6 isomers and the fact that the signal at m/z = 54 is only detected in the 10.49 eV experiment, all C4H6 isomers can be excluded: 1, 3-butadiene (IE = 9.07 eV); 1-butyne (IE = 10.18 eV); bicyclo[1.1.0]butane (IE = 8.70 eV); 2-butyne (IE = 9.58 eV); 1, 2-butadiene (IE = 9.03 eV); methylenecyclopropane (IE = 9.6 eV); and cyclobutene (IE = 9.43 eV). Considering the C3H2O isomers, two out of three species can be eliminated based on their IEs: cyclopropenone (IE = 10.0 eV) and propadienal (IE = 9.15 eV). The third isomer, 2-propynal (HCCCHO), holds an IE between 10.47 and 10.77 eV, according to Opitz (1991); therefore, 2-propynal, a molecule that was detected in the Taurus molecular cloud (TMC-1) by Irvine et al. (1988), is the species with a mass of 54 amu. Once again, as verified in the perdeuterated experiments, the data expose a shift of the ion signal from m/z = 54 to m/z = 56, verifying that the species formed holds only two hydrogen/deuterium atoms.
3.2.7. Heavier Species (56–100 amu)
Due to the increase in complexity (number of structural isomers) and similar IEs, no conclusive assignments are attempted here for molecules heavier than 54 amu. Nevertheless, we discuss which isomers are possible candidates for each mass and which species can be excluded based on their IEs and/or the mass shifts from the deuterium-substituted study.
The signal at m/z = 56 originates from a species with the molecular formula C3H4O, which can include one or more of the following species: cyclopropanone (IE = 9.1 eV); methylketene (IE = 8.95 eV); methoxyacetylene (IE = 9.48 eV); 2-propenal (IE = 10.11 eV); propargyl alcohol (IE = 10.5 eV); and/or C4H8 hydrocarbons such as 1-butene (IE = 9.55 eV); 2-butene, 2-butene (Z)-, 2-butene (e)- (IE = 9.1 eV); 1-propene-2-methyl- (IE = 9.22 eV); cyclobutane (IE = 9.8 eV); and methylcyclopropane (IE = 9.3 eV). Note that an alternative carrier (C2O2) does not represent a stable molecule and hence can be excluded. The signal corresponding to C3D4O (m/z = 60) was also detected in the perdeuterated experiment.
Ion counts at m/z = 58 can be assigned to glyoxal (C2H2O2, IE = 10.2 eV) and/or C3H6O isomers, including species detected in the ISM, such as acetone ((CH3)2CO, IE = 9.70 eV; Combes et al. 1987), propanal (C2H5CHO, IE = 9.96 eV; Hollis et al. 2004), and propylene oxide (IE = 10.22 eV; McGuire et al. 2016), in addition to species not yet detected in astrophysical environments, such as 2-propen-1-ol (IE = 9.7 eV); trimethylene oxide (IE = 9.65 eV); ethene, methoxy- (IE = 8.95 eV); cyclopropanol (IE = 9.10 eV); propen-2-ol (IE = 8.6 eV); and (Z)-1-propenol (IE = 8.70 eV). The signals of the deuterated counterparts, C2D2O2 (m/z = 60) and C3D6O (m/z = 64), were also detected in the perdeuterated experiment.
The signal at m/z = 60 is attributed to C2H4O2 isomers such as 1, 3-dioxetane (IE = 10.51 ± 0.03 eV); methylethyl ether (IE = 9.72 eV); 2-propanol (IE = 10.17 eV); and 1-propanol (IE = 10.22 eV). Since the signal at m/z = 60 was not detected in the 9.70 eV experiment, it cannot be assigned to ethen-1, 2-diol (IE = 9.62 eV). The IEs of the additional C2H4O2 isomers (acetaldehyde hydroxy-, (Z) ethene-1, 2-diol, and 1, 2-dioxetane) either are not available in the literature or are higher than 10.49 eV in the case of methyl formate (IE = 10.83 eV) and acetic acid (IE = 10.65 eV). The perdeuterated experiment confirms the signal at m/z = 64, which corresponds to C2D4O2.
The signal at m/z = 70 is due to either hydrocarbons with the formula C5H10, which may include one or more of the following species: ethylcyclopropane (IE = 8.96 eV); 1,1-dimethylcyclopropane (IE = 8.98 eV); 1, 2-dimethylcyclopropane (IE = 9.76 eV); trans-1, 2-dimethylcyclopropane (IE = 9.02 eV); cyclopentane (IE = 10.33 eV); 2-methyl-2-butene (IE = 8.69 eV); 3-methyl-1-butene (IE = 9.52 eV); 2-methyl-1-butene (IE = 9.12 eV); 2-pentene, (Z)- (IE = 9.01 eV); 2-pentene, (E)- (IE = 9.04 eV); cyclopropane, 1, 2-dimethyl- (IE = 9.76 eV); and methylcyclobutane (IE = 9.64 eV) and/or C4H6O isomers such as divinyl ether (IE = 8.68 eV); cyclo–butanone (IE = 9.35 eV); (Z), (E)- 2-butenal (IE = 9.7 eV); 1-methoxyallene (IE = 8.64 eV); propyne, 1-methoxy (IE = 8.79 eV); 2, 5-dihydrofuran (IE = 9.16 eV); 2, 3-butadien-1-ol (IE = 8.74 eV); 3-butyn-2-ol (IE < 10.15 eV); ethylketene (IE = 8.80 eV); 1, 3-butadiene-2-ol (IE = 8.68 eV); dimethylketene (IE = 8.38 eV); methyl 2-propynyl ether (IE = 9.78 eV); (Z), (E)-1, 3-butadien-1-ol (IE = 8.51 eV); 3-butenal (IE = 9.65 eV); 2-butyn-1-ol (IE = 9.78 eV); methacrolein (IE = 9.92 eV); 3-buten-2-one (IE = 9.66 eV); 3-butyn-1-ol (IE = 9.66 eV); and oxirane, ethenyl- (IE = 9.52 eV). Some C4H6O isomers were omitted because the IEs were not known. The mass shift of the deuterated counterparts (C5D10, m/z = 80; and C4D6O, m/z = 76) was observed in the deuterated experiment. Here, we exclude the assignment of m/z = 70 to propionic acid (C3H2O2, IE = 10.45 eV) since the signal corresponding to C3D2O2 (m/z = 72) was not detected in the perdeuterated experiment.
The m/z = 72 signal is assigned to C5H12 hydrocarbons such as pentane (IE = 10.28 eV), neopentane (IE = 10.30 eV), and 2-methylbutane (IE = 10.32 eV), in addition to potentially 46 species with the general formula C4H8O and C3H4O2. Because of the large number of candidates, the list of species with a mass of 72 amu and the general formula CnHmOk for which the IE is known (and is below 10.49 eV) is given in the Appendix (Table 8). It is noteworthy to mention that all of the C5H12 hydrocarbons have IEs higher than 10.2 eV, but the signal at m/z = 72 was detected even in the 9.70 eV experiment, which implies that some COMs with mass 72 amu, not only hydrocarbons, were synthesized in the experiment. The fully deuterated experiment confirms the presence of signals at m/z = 76 (C3D4O2), m/z = 80 (C4D8O), and m/z = 84 (C5D12).
The signal at m/z = 74 can be due to C4H10O and/or C3H6O2 isomers. The C4H10O isomers with known IEs are 2-methoxypropane (IE = 9.45 eV), methyl propyl ether (IE = 9.4 eV), ethyl ether (IE = 9.51 eV), tert-butanol (IE = 9.9 eV), 1-butanol (IE = 9.99 eV), 2-butanol (IE = 9.88 eV), and/or 2-methyl-1-propanol (IE = 10.02 eV). The C3H6O2 isomers that may have been synthesized in the experiments are ethyl formate (IE = 10.61 eV); 1-hydroxy-2-propanone (IE = 10.0 eV); glycidol (IE = 10.43 eV); 1, 3-dioxolane (IE = 9.9 eV); propanoic acid (IE = 10.44 eV); and/or methyl acetate (IE = 10.25 eV). The signals corresponding to C3D6O2 (m/z = 80) and C4D10O (m/z = 84) were also detected in the perdeuterated experiment.
The signal at m/z = 76 could be due to benzyne (C6H4, IE = 9.03 eV) and/or species with the general formula C3H8O2 and/or C2H4O3. Unfortunately, the IE of most of these molecules is not available in the literature. The C3H8O2 isomers with known IEs are 2-methoxyethanol (IE = 10.13 eV) and dimethoxymethane (IE = 9.7 eV). The only species with the general formula C2H4O3 and a known IE value is 1, 2, 4-trioxolane (IE = 10.1 eV). Once more, the signals corresponding to the deuterated counterparts of these isomers (i.e., C6D4, m/z = 80; C2D4O3, m/z = 80; C3D8O2, m/z = 84) were detected in the perdeuterated experiment.
The signal at m/z = 86 could due to hydrocarbons with the general formula C6H14, such as 2-methylpentane (IE = 10.04 eV); hexane (IE = 10.13 eV); 2, 2-dimethylbutane (IE = 10.07 eV); 2, 3-dimethylbutane (IE = 10.04 eV); and/or 3-methylpentane (IE = 10.04 eV), in addition to C4H6O2 and/or C5H10O isomers, which, due to the large number, are listed in the Appendix (Table 8). The perdeuterated experiment shows the signals corresponding to C4D6O2 (m/z = 92), C5D10O (m/z = 96), and C6D14 (m/z = 100).
For the signal at m/z = 88, the possible isomers are C3H4O3, C4H8O2, and C5H12O. Once again, due to the large number of candidates, the potential species that may have been produced in the experiments are listed in the Appendix (Table 8). The fully deuterated experiment also presents signals at m/z = 92 (C3D4O3) and m/z = 96 (C4D8O2).
Finally, the signal at m/z = 100 can, in principle, be assigned to the C5H8O2, C6H12O, and/or C7H16 isomers; however, the deuterium-substituted experiment at 10.49 eV shows no signal at m/z = 108 (see Section A.2.), which is the expected signal of C5D8O2 isomers. Therefore, we assume that no measurable amount of these isomers was synthesized in our experiments. The candidates for m/z are listed in Table 8.
3.3. RGA
In addition to the PI-ReTOF-MS, the subliming molecules were also monitored by the RGA during the TPD phase of the experiment. Although the RGA represents a less-sensitive technique, it can be useful to detect species that have high IE. The detection of ethane (C2H6) could be confirmed by the signal at m/z = 30 in the RGA, since this signal is exclusive to ethane in the absence of nitrogen-bearing species. This supports the assignment of ethane to the infrared bands at 2975, 2941, and 2882 cm−1 (Boudin et al. 1998; Hudson et al. 2014; Table 4). Further, the RGA also shows signals at m/z = 44 and 43; although the signal at m/z = 44 has some contribution of carbon dioxide (CO2), the combination of this signal with the ion counts at m/z = 43 points to the detection of propane (C3H8) in our ice. The TPD profiles of ethane and propane from the RGA are shown in Figure 5.
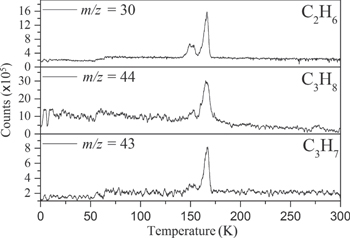
Figure 5. Mass spectra collected by the RGA during the TPD phase of the experiment. The signal at m/z = 30 is assigned to ethane (C2H6); ion counts at m/z = 44 and 43 originate from propane and its  fragment, respectively. Propane does not contribute any fragment ions to m/z = 30.
Download figure:
Standard image High-resolution image3.4. Quantitative Analysis
In order to calculate the yield of a molecule per unit of deposited energy, the total number of molecules in the ice has to be determined. This is generally done by FTIR spectroscopy and a modified Lambert–Beer relationship exploiting the correlation between the integrated absorption feature and the infrared absorption coefficient of that vibrational mode (Turner et al. 2015). However, the infrared features of most of the species of interest are not present in our irradiated ice spectra, since their yields are too low; therefore, some relationship between the number of counts in the PI-ReTOF-MS spectrum and the number of molecules in the sample had to be established. This was achieved using calibration experiments as a reference. In the first set of calibration experiments, a 704 ± 72 nm thick sample of pure dimethyl ether (=99%, Sigma-Aldrich) was deposited at 5.5 ± 0.2 K. Using Equations (1)–(3), we determined the number of molecules in this sample to be (7.22 ± 2.29) × 1019. In this experiment, the infrared spectrum shows an area of 2.611 ± 0.010 cm−1 for the 1161 cm−1 band (CH3 rock) of dimethyl ether. In the second calibration experiment, 1% of dimethyl ether (in partial pressure) was added to the water/methane (9/1) gas mixture; the H2O/CH4/CH3OCH3 (9/1/0.1) mixture was deposited at 5.5 ± 0.2 K, followed by a TPD in which PI-ReTOF-MS data was collected at 10.49 eV. Here, the measured area of the 1161 cm−1 band was 0.080 ± 0.005 cm−1, which, if compared to the 100% calibration experiment, translates to (2.21 ± 0.89) × 1018 molecules of dimethyl ether in the sample and 118,481 ± 330 ion counts by the ReTOF. Now, a correlation between the number of PI-ReTOF-MS counts and the number of molecules synthesized in the ice can be established using Equation (6). The data show that (2.56 ± 1.09) × 1016 molecules of dimethyl ether and (8.06 ± 3.39) × 1017 molecules of ethanol were produced in the irradiation experiments. Additionally, since the average dose deposited into the ice sample was 9.27 ± 0.64 eV molecule−1, and considering that (8.28 ± 0.24) × 1017 molecules in total were processed in the ice (the average penetration depth of the electrons was equal to (2.66 ± 0.52) × 10−5 cm, as determined by CASINO; Table 1), we conclude that (3.34 ±1.51) × 10−3 dimethyl ether molecules and (5.08 ± 2.31) ×10−2 ethanol molecules were produced per deposited eV.
It is worth mentioning that the signals at m/z = 42 and 44 have contributions of more than one species. To understand the contribution of each species to the total number of counts, we have applied methodology similar to that used to calculate the ethanol–to–dimethyl ether branching ratio (Appendix). For example, the yield of ketene at 10.49 eV was calculated by taking the number of counts from m/z = 42 in the 9.70 eV experiment (326 ± 20) in which only ketene was detected and normalizing it by the photon flux of the VUV light at 10.49 eV (factor of 2.07 ± 0.20) and by the ionization cross section of ketene at 10.49 eV in comparison with that at 9.70 eV (factor of 4.298; Yang et al. 2012), giving a total of 2900 ± 332 counts of ketene, or 84.0% ± 9.6% of the total counts for m/z = 42 in the 10.49 eV experiment. The remaining counts are due to propene (C3H6). A similar procedure was done for the signal at m/z = 44, which has contributions from acetaldehyde and vinyl alcohol (ethenol). The computation showed that 43% of the signal at m/z = 44 in the 10.49 eV experiment is due to vinyl alcohol, which, taking into account the ionization cross sections of acetaldehyde and vinyl alcohol (7.40 × 10⁻¹⁸ and 9.71 × 10⁻¹⁸ cm2, respectively; Cool et al. 2003), yields an acetaldehyde–to–vinyl alcohol branching ratio of 1.7 ± 0.5 to 1.
4. Discussion
Based on the tunable VUV experiments and the data from the PI-ReTOF-MS system ratified by the RGA and FTIR analysis, we can confidently confirm the detection of multiple novel species as a result of the exposure of water/methane ices to ionizing radiation. Among the most unequivocal detections made by PI-ReTOF-MS are propyne (C3H4), propene (C3H6), ketene (CH2CO), vinyl alcohol (CH2CHOH), acetaldehyde (CH3CHO), 2-propynal (C3H2O), dimethyl ether (CH3OCH3), ethanol (C2H5OH), and methyl hydroperoxide (CH3OOH). The assignments made by FTIR spectroscopy include hydrocarbons (ethane, propane, propylene, and propyne), carbon dioxide (CO2), and methanol (CH3OH). The RGA detected ethane (C2H6), propane (C3H8), and carbon dioxide (CO2). In summary, the detections made by all the instruments combined can be arranged in nine groups: alkanes (ethane and propane), alkenes (propylene), alkyne (propyne), alcohols (methanol, vinyl alcohol, and ethanol), ketene (ethenone), aldehydes (acetaldehyde and propynal), ether (dimethyl ether), hydroperoxide (methyl hydroperoxide), and carbon dioxode (CO2). Among them, propene (propylene), propyne (methylacetylene), methanol, ketene, vinyl alcohol, acetaldehyde, dimethyl ether, ethanol, 2-propynal, and carbon dioxide are the ones that were detected in different astrophysical environments (Ball et al. 1970; Buhl & Snyder 1973; Gottlieb 1973; Snyder et al. 1974; Zuckerman et al. 1975; Turner 1977; Irvine et al. 1988; d'Hendecourt & Jourdain de Muizon 1989; Turner & Apponi 2001; and Marcelino et al. 2007, respectively). Additionally, the PI-ReTOF-MS data suggest the detection of almost 200 different species that cannot be resolved because the IEs are unknown, too close to be resolved, or too high to be exploited by our tunable VUV source. The list of possible candidates for the detected PI-ReTOF-MS signals can be seen in the Appendix (Table 8). Interestingly, no absorptions due to carbon monoxide (CO) were detected in the FTIR, even though the synthesis of this molecule is expected in similar experiments (e.g., Zhou et al. 2008).
In an effort to understand the formation mechanisms and relative abundances of complex organic species in astrophysical environments such as star-forming regions, we would like to discuss the implications of our findings for two important isomers found in the ISM: ethanol (C2H5OH) and dimethyl ether (CH3OCH3). Both ethanol and dimethyl ether were detected in several sources, including low-, intermediate-, and high-mass star-forming regions. A list of the sources in which both molecules were detected and the relative abundance was measured is provided in Table 6. In our experiment, the ethanol/dimethyl ether branching ratio calculated is 31 ± 11 to 1. The details of the calculation are provided in the Appendix. The 31 ± 11–to–1 ethanol/dimethyl ether branching ratio implies that the nonequilibrium reactions triggered by the electron irradiation of two of the most ubiquitous molecules in astrophysical environments, water and methane, favor the production of ethanol over the production of dimethyl ether. This seems to be in disagreement with the general values obtained from observations, in particular of star-forming regions where the ethanol/dimethyl ether abundance ratio varies from as low as 0.03 in the massive young stellar object IRS1 in NGC 6334 (Bisschop et al. 2007) to as high as 3.46 in the Orion KL nebula (White et al. 2003).
Table 6. Abundance Ratio of Ethanol/Dimethyl Ether in Several Star-forming Regions, Including Low-, Intermediate-, and High-mass Sources
| Source | Ratio ETH/DME | Description | Reference |
|---|---|---|---|
| NGC 6334 IRS1 | 0.03 | High-mass star-forming region | (1) |
| G24.78 | 0.06 | High-mass star-forming region | (1) |
| W3(H2O) | 0.06 | High-mass star-forming region | (1) |
| G75.78 | <0.11 | High-mass star-forming region | (1) |
| W51 e2 | 0.33 | High-mass star-forming region | (2) |
| W33A | 0.17 | High-mass star-forming region | (1) |
| G34.3+0.2 | 0.25 | High-mass star-forming region | (2) |
| G31.41+0.31 | 0.3 | High-mass star-forming region | (3) |
| NGC 7538 IRS1 | >0.37 | High-mass star-forming region | (1) |
| Sgr B2N | 0.65 | High-mass star-forming region | (4) |
| NGC 7129 FIRS2 | 0.75 | Intermediate-mass star-forming region | (5) |
| Sgr B2M | 1 | High-mass star-forming region | (4) |
| Average of 21 sources in the Galactic center | 1 | High-mass star-forming region | (4) |
| NGC 1333 IRAS 2A | 1.3 | Low-mass star-forming region | (6) |
| NGC 1333 IRAS 4A | 1.4 | Low-mass star-forming region | (6) |
| Orion KL | 3.46 | High-mass star-forming region | (7) |
Note. In each source, the ratio is always lower than the one measured experimentally from the irradiation of the H2O/CH4 ice.
References. (1) Bisschop et al. (2007), (2) Lykke et al. (2015), (3) Rivilla et al. (2017), (4) Requena-Torres et al. (2006), (5) Fuente et al. (2014), (6) Taquet et al. (2015), (7) White et al. (2003).
Download table as: ASCIITypeset image
Some aspects may be considered causes of the high ethanol/dimethyl ether ratio found in our experiments in comparison with astronomical observations, including: (i) possible reactions in the gas phase that may occur in molecular clouds but that are absent in our experiments (Balucani et al. 2015); (ii) preferable destruction of one daughter species over another by irradiation, which cannot be tested because neither ethanol nor dimethyl ether were detected in our FTIR spectra; and (iii) the initial composition of the ice. For example, dimethyl ether is thought to be easily produced when methanol is present as one of the reactants (Peeters et al. 2006); by contrast, Kaiser et al. (2014) and Abplanalp et al. (2016b) found no evidence of dimethyl ether in CO/CH4 ice experiments using methodology similar to that presented here. The chemical reactions that may favor the production of ethanol in our system will be discussed in Section 5. Additionally, future studies may provide valuable information regarding the question of how the initial composition of the ice influences the outcome. Here, we suggest that the study of systems such as methanol/methane (CH3OH/CH4) and water/ethane (H2O/C2H6) may help to better understand this question. Finally, there is no evidence that any of the daughter molecules are formed in the ice without energetic processes, which is proved by blank (nonirradiated) experiments in which no products were detected.
The calculation of the yield of the species in which the detection was confirmed in our experiments is provided in Table 7. In this calculation, the number of counts from the PI-ReTOF-MS was normalized based on the number of counts and the ionization cross section of dimethyl ether. The yield of ethane (C2H6), methanol (CH3OH), and carbon dioxide (CO2) was calculated based on FTIR data, since these species are not detected in the PI-ReTOF-MS because of their high ionization cross- sections. In this case, the calculation was done in a fashion similar to the determination of the number of molecules in the sample done for the calibration experiment; i.e., a correlation between the number of counts in the PI-ReTOF-MS spectrum and the corresponding infrared absorption area was established, which allowed for the number of molecules in the ice to be calculated.
Table 7. Yield of Detected Molecules
| m/z | Name | Formula | PI-ReTOF-MS | Photoionization | Normalizeda | Yield | Yield | Yield | |
|---|---|---|---|---|---|---|---|---|---|
| Counts (Q) at 10.49 eV | Cross-section (σ) at 10.49 eV (cm2) | PI-ReTOF-MS Counts | (molecules) | (%) | (molecules eV−1) | ||||
| PI-ReTOF-MS | 40 | Propyne | C3H4 | 295 ± 10 | 22.7 × 10⁻¹⁸i | 126 ± 4 | (2.36 ± 0.99) × 1015 | (0.15 ± 0.06) | (6.00 ± 2.51) × 10−4 |
| 42 | Ketene | CH2CO | 2517 ± 258b | 25.0 × 10⁻¹⁸j | 979 ± 100 | (1.83 ± 0.79) × 1016 | (1.13 ± 0.48) | (4.65 ± 1.98) × 10−3 | |
| 42 | Propene | C3H6 | 952 ± 262 | 11.05 × 10⁻¹⁸k | 837 ± 230 | (1.56 ± 0.65) × 1016 | (0.96 ± 0.48) | (3.96 ± 1.66) × 10−3 | |
| 44 | Vinyl alcohol | CH2CHOH | 6127 ± 372c | 9.71 × 10⁻¹⁸k | 6121 ± 372 | (1.14 ± 0.48) × 1017 | (7.04 ± 2.96) | (2.90 ± 1.22) × 10−2 | |
| 44 | Acetaldehyde | CH3CHO | 7908 ± 385 | 7.37 × 10⁻¹⁸k | 10430 ± 508 | (1.95 ± 0.82) × 1017 | (12.04 ± 5.06) | (4.95 ± 2.08) × 10−2 | |
| 46 | Dimethyl ether | CH3OCH3 | 1368 ± 119d | 9.72 × 10⁻¹⁸i | 1368 ± 119 | (2.56 ± 1.09) × 1016 | (1.58 ± 0.67) | (6.51 ± 2.73) × 10−3 | |
| 46 | Ethanol | C2H5OH | 3768 ± 155 | 0.85 × 10⁻¹⁸i | 43088 ± 1772 | (8.06 ± 3.39) × 1017 | (49.75 ± 20.92) | (9.92 ± 4.16) × 10−2 | |
| 48 | Methyl hydroperoxide | CH3OOH | 663 ± 25 | N/A | ⋯ | ⋯ | ⋯ | ⋯ | |
| FTIR | 30 | Ethanee | C2H6 | ⋯ | ⋯ | ⋯ | (3.18 ± 1.35) × 1016 | (1.96 ± 0.83) | (8.08 ± 3.39) × 10−3 |
| 32 | Methanolf | CH3OH | ⋯ | ⋯ | ⋯ | (3.86 ± 1.64) × 1017 | (23.83 ± 10.12) | (9.81 ± 4.12) × 10−2 | |
| 44 | Carbon dioxideg | CO2 | ⋯ | ⋯ | ⋯ | (2.73 ± 1.16) × 1016 | (1.69 ± 0.71) | (6.94 ± 2.91) × 10−3 | |
Notes.
aNormalized by the ionization cross section of dimethyl ether. bMeasured at 9.70 eV, then normalized by the photon flux and ionization cross-section at 10.49 eV. cMeasured at 9.92 eV, then normalized by the photon flux and ionization cross-section at 10.49 eV. dMeasured at 10.25 eV, then normalized by the photon flux and ionization cross-section at 10.49 eV (see Appendix). eIR area (2282 cm−1): 0.005 ± 0.001; absorption coefficient (cm molecule−1): 3.51 × 10⁻¹⁸ (Hudson et al. 2014). fIR area (1125 cm−1): 0.021 ± 0.003; absorption coefficient (cm molecule−1): 1.30 × 10⁻¹⁸ (Bennett et al. 2007). gIR area (2341 cm−1): 0.087 ± 0.007; absorption coefficient (cm molecule−1): 7.60 × 10⁻¹⁷ (Gerakines et al. 1995).References. (i) Cool et al. (2003), (j) Yang et al. (2012), (k) Cool et al. (2003).
Download table as: ASCIITypeset image
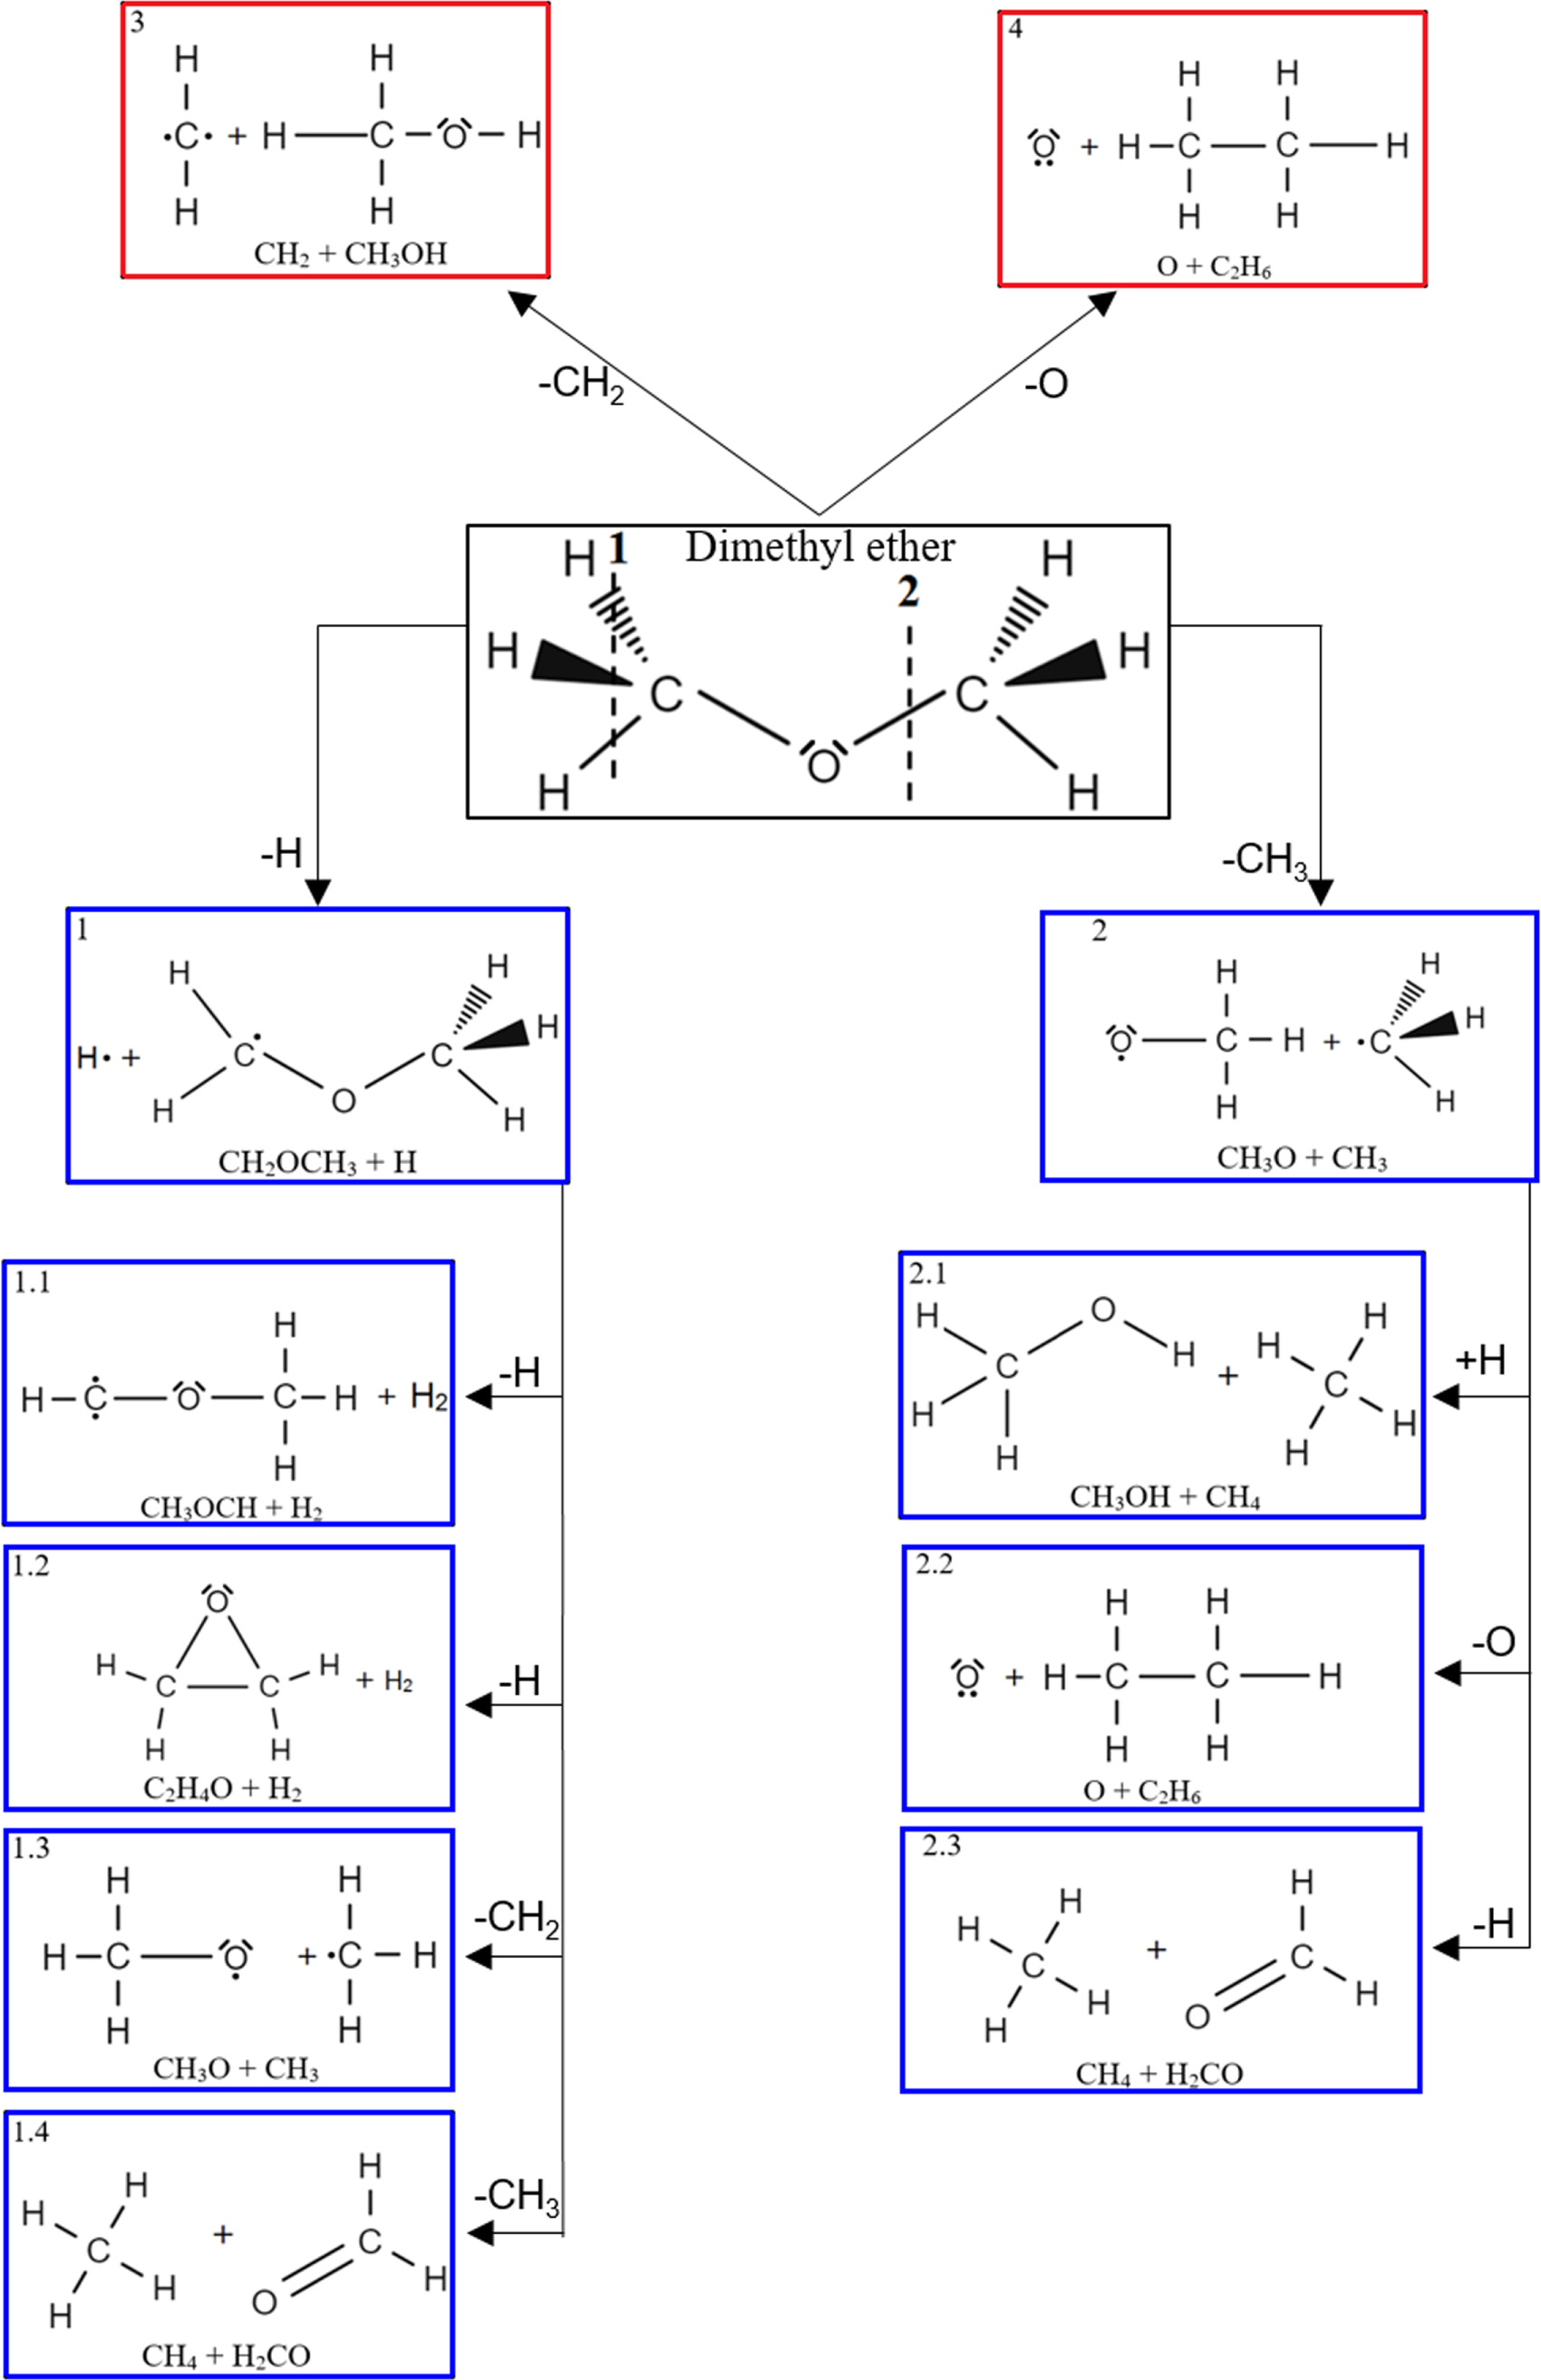
Further exploring the subject of which precursors are more likely to produce ethanol over dimethyl ether in our experiments, a retrosynthetic approach was conceived based on retro-insertion and simple bond rupture reactions along with reversed radical–radical reactions. This approach may shed light upon this matter through the identification of the radicals and molecules that are the potential precursors of each species of interest. Figures 6 and 7 compile the retrosynthetic approach comprehensively for dimethyl ether and ethanol, respectively. The reactions in the top panels (red rectangles) of Figures 6 and 7 represent the possible retro-insertion reactions in which either carbene (methylene) insertion in CH3OH (panel 3 in Figure 6 and panel 6 in Figure 7) or atomic oxygen insertion in C2H6 (panel 4 in Figure 6 and panel 7 in Figure 7) forms dimethyl ether or ethanol. The bottom panels of Figures 6 and 7 (blue rectangles) describe possible radical–radical reactions, if they exist. If they do, the unpaired electrons are represented by the black dots near the atom. The dashed lines represent the theoretical bond ruptures due to irradiation. This approach was successfully implemented by Bennett et al. (2005a) in the investigation of the formation of acetaldehyde in molecular clouds. The comparison of the final reactants resulting from the retro-insertions and bond rupture processes with the species observed in interstellar ices, followed by elimination of the reactions involving species that were not observed on interstellar grains, will result in accurate precursors and potential mechanisms of formation of dimethyl ether and ethanol in astrophysical ices. We conclude from Figures 6 and 7 that possible insertion reactions involving carbene and atomic oxygen are similar for both ethanol and dimethyl ether, so these reactions are not the probable cause of the high ethanol/dimethyl ether ratio detected in these experiments. In fact, the analysis suggests that methanol–methane reactants (panel 2.1 of Figure 6 and panel 2.2 of Figure 7) represent the most likely reactants leading to ethanol and dimethyl ether (see Figure 8).

Figure 6. Retrosynthetic approach to the formation of dimethyl ether in extraterrestrial ices via retro-insertion (red rectangles) and simple bond rupture processes (blue rectangles).
Download figure:
Standard image High-resolution image
Figure 7. Retrosynthetic approach to the formation of ethanol in extraterrestrial ices via retro-insertion (red rectangles) and simple bond rupture processes (blue rectangles).
Download figure:
Standard image High-resolution image
Figure 8. Pathways to species detected in our experiments. The dashed arrow indicates that the pathway has yet to be confirmed.
Download figure:
Standard image High-resolution image5. Astrophysical Implications
The formation pathways to the species detected in our experiments are compiled in Figure 8. Upon interaction with ionizing radiation, simple hydrides such as water (H2O) and methane (CH4) decompose predominantly via atomic hydrogen loss, yielding hydroxyl (OH) and methyl (CH3), respectively (Jones et al. 2014; Turner et al. 2016). In pure water and methane ices, this was shown to follow radical–radical recombination, forming hydrogen peroxide (H2O2; Bennett et al. 2014) and ethane (C2H6; Abplanalp & Kaiser 2017). In the present experiments, methyl radicals can recombine with hydroxyl radicals, forming methanol (CH3OH). Kaiser & Roessler (1998) and Zhou et al. (2014) detected propane (C3H8) as a radical–radical recombination product of methyl (CH3) and ethyl radicals (C2H5). Upon exposure to ionizing radiation, (un)saturated hydrocarbons can eject hydrogen (Parker et al. 2014); here, the radiolysis of propane can yield propene (C3H6), with the latter undergoing decomposition to propyne (C3H4). Likewise, methanol (CH3OH) produced by radical–radical recombination between methyl and hydroxyl can be radiolyzed to the hydroxymethyl radical (CH2OH) and the methoxy radical (CH3O; Maity et al. 2015). These radicals can react with a methyl radical to form ethanol (CH3CH2OH) and dimethyl ether (CH3OCH3), respectively, as observed in our experiments. The preferred formation of ethanol suggests that the decomposition of methanol to the hydroxymethyl radical (CH2OH) followed by recombination with the methyl radical to ethanol dominates over the fragmentation of methanol to the methoxy radical (CH3O) followed by recombination with a methyl radical to dimethyl ether. The preferred decomposition of methanol to the hydroxymethyl radical (CH2OH) is also supported by Bennett et al. (2007) and Balucani et al. (2015). Similarly to alkanes, alcohols can emit hydrogen during radiolysis, forming vinyl alcohol (C2H3OH) as observed here; this molecule can isomerize to acetaldehyde (CH3CHO), as shown previously by Bennett et al. (2005a, 2005b) and Abplanalp et al. (2016b). Vinyl alcohol can also decompose further to ketene (H2CCO) via hydrogen loss (Hudson & Loeffler 2013). The detection of 2-propynal (HCOCCH) is quite unusual, as the acetylene and carbon monoxide precursors are not observed here; see Abplanalp & Kaiser (2017) and Bennett et al. (2007), respectively. Note that Mebel et al. (1998) investigated the decomposition of propyne to propargylene (HCCCH) plus molecular hydrogen (Mebel et al. 1998). Propargylene holds a triplet ground state and may react with atomic oxygen barrierlessly to form 2-propynal (HCOCCH); we should stress that this route has to be confirmed experimentally.
In summary, this work explores the production of important isomers detected in the ISM, ethanol and dimethyl ether, through the irradiation of an astrophysically relevant ice mixture of H2O/CH4 by energetic electrons exploiting FTIR, RGA/QMS, and PI-ReTOF-MS as analytical techniques. As a key result, the extracted ethanol/dimethyl ether branching ratio was determined to be 31 ± 11, which is 1–2 orders of magnitude higher than the abundance ratios measured in low, intermediate-, and high-mass star-forming regions (White et al. 2003; Requena-Torres et al. 2006; Bisschop et al. 2007; Fuente et al. 2014; Lykke et al. 2015; Rivilla et al. 2017). As methanol represents the common precursor to both dimethyl ether and ethanol, this "imbalance" favoring ethanol in our experiments may be explained by the involvement of reaction intermediates leading preferentially to the synthesis of ethanol, i.e., the hydroxymethyl radical (CH2OH), which also represents a crucial reaction intermediate in the synthesis of glycolaldehyde (HCOCH2OH; Bennett & Kaiser 2007b). In the present ice mixture, the ethyl radical (CH3CH2) may recombine with the hydroxyl radical (OH) to form ethanol (CH3CH2OH). In addition, in an astrophysical environment in which methanol is the main precursor of both ethanol and dimethyl ether, the synthesis of ethanol through radical–radical reactions between the hydroxymethyl radical (CH2OH) and the methyl radical (CH3) would be favorable, since the formation of the hydroxymethyl radical over the methoxy radical (CH3O) is statistically more likely to happen in a ratio of 3:1 due to the dominance of the methylic hydrogen atoms compared to a single hydrogen atom in the hydroxyl group (R-OH). Future laboratory studies, such as the investigation of methanol/methane and water/ethane ices, under conditions identical to those presented here may reveal the discrepancy regarding the ethanol/dimethyl ether ratio observed in many star-forming regions being lower when compared to the results obtained in the present simulation experiments.
We thank the US National Science Foundation (AST-1505502) for support in conducting the present experiments. The authors would like to acknowledge the W. M. Keck Foundation for financing the experimental setup.
Appendix
A.1. Calibration Experiments
Calibration experiments were performed in order to determine the ratio of water (H2O) to methane (CH4) in the mixed ice. Pure H2O and CH4 ices with three different thicknesses of 250 ± 25, 375 ± 37, and 500 ± 50 nm—as determined via laser interferometry—were prepared on the silver substrate, followed by TPD at a heating rate of 1 K minute−1. A QMS operating in RGA mode at an electron current of 2 mA, an electron energy of 70 eV, and a photomultiplier voltage of 1200 V was used to monitor the subliming molecules during the warm-up phase via the parent and fragment ions for water (m/z = 18, H2O+; m/z = 17, OH+; and m/z = 16, O+) and methane (m/z = 16,  m/z = 15,
  ; and m/z = 14,
  ). The integrated ion counts are proportional to the number of molecules in each sample, as calculated from the mass of each sample according to Equations (1)–(3). As a typical example, Figure 9 displays the ion currents of m/z = 17 and 18 for OH+ and H2O+, respectively, as the water sublimes. Figure 10 compiles the number of water molecules in the sample molecules versus the relative integrated ion counts of m/z = 17 and 18.

Figure 9. TPD profile of the signal for OH+ and H2O+ from three calibration experiments with water samples of thicknesses of 250 ± 25, 375 ± 37, and 500 ± 50 nm (blue dotted line).
Download figure:
Standard image High-resolution image
Figure 10. Integrated ion counts vs. the thickness of the water samples. A linear regression yielded a water-to-methane ratio of 9.4 ± 1.5 to 1.
Download figure:
Standard image High-resolution image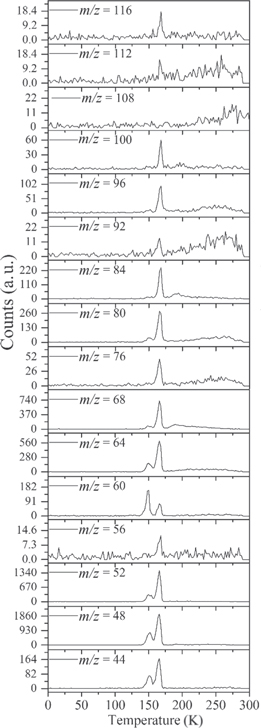
Figure 11. TPD profiles collected via PI-ReTOF-MS (10.49 eV) in the fully deuterated (D2O/CD4) ice after 1 hr of irradiation.
Download figure:
Standard image High-resolution image
The water/methane ratio in the ice was determined after the blank experiment in which 18.1 ± 0.1 Torr of water and 1.2 ± 0.1 Torr of methane were mixed in the GMC prior to the deposition. The RGA measured the signal from water (H2O+ and OH+) and methane ( and
and  ) during the TPD to be 957,741,495 and 861,199,034 counts, respectively. Accounting for the calibration experiments, these data yield a water-to-methane ratio of 9.4 ± 1.5 to 1.
A.2. TPD Profile of the Deuterium-Substituted (D2O/CD4) Experiment at 10.49 eV
Figure 11 shows the TPD profiles corresponding to the species subliming from the fully deuterated (D2O/CD4) ice after 1 hr of irradiation. The spectra were collected by PI-ReTOF-MS at an ionization energy of 10.49 eV.
A.3. Ethanol–to–Dimethyl Ether Branching Ratio
The total counts (Q) at m/z = 46 have to be normalized to the VUV photon flux (ϕp) in each experiment (Table 5). Therefore, the normalized number of counts Q' at m/z = 46 in the 10.49 eV experiment can be obtained via Equation (4) as 5140 ± 411 counts:

Recall that, in the 10.25 eV experiments, ion counts at m/z = 46 of 950 ± 47 only originated from dimethyl ether, since ethanol cannot be ionized at 10.25 eV. Accounting for the enhanced photoionization cross section to ionize dimethyl ether at 10.49 eV compared to 10.25 eV (Table 5), this would translate to 1372 ± 67 ion counts from dimethyl ether at 10.49 eV (Equation (5)):

Consequently, the contribution of ethanol to m/z = 46 at 110.49 eV represents the difference of the total ion counts at 10.49 eV and the ion counts from dimethyl ether as determined above, i.e., 3768 ± 1424 counts contributing to ethanol. Accounting for the photoionization cross sections of ethanol and dimethyl ether at 10.49 eV, Equation (6) shows the branching ratio of ethanol to dimethyl ether to be 31 ± 11:

A.4. Possible Carriers of Higher Molecular Weight Products
Table 8 provides a list of possible candidates for the detected PI-ReTOF-MS signals.
Table 8. Possible Carriers of Higher Molecular Weight Products
| m/z | Name | Molecular Formula | IE (eV) | Structure |
|---|---|---|---|---|
| 100 | Heptane | C7H16 | 9.93 |

|
| 100 | Hexane, 2-methyl- | C7H16 | N/A |

|
| 100 | Pentane, 2, 4-dimethyl- | C7H16 | N/A |

|
| 100 | Pentane, 2, 2-dimethyl- | C7H16 | N/A |

|
| 100 | Pentane, 2, 3-dimethyl- | C7H16 | N/A |

|
| 100 | Hexane, 3-methyl- | C7H16 | N/A |

|
| 100 | Pentane, 3, 3-dimethyl- | C7H16 | N/A |

|
| 100 | Butane, 2, 2, 3-trimethyl- | C7H16 | N/A |

|
| 100 | Pentane, 3-ethyl- | C7H16 | N/A |

|
| 100 | (S)-(+)-3-methylhexane | C7H16 | N/A |

|
| 100 | 2H-pyran, tetrahydro-2-methyl- | C6H12O | N/A |

|
| 100 | Methyl isobutyl ketone | C6H12O | 9.30 |

|
| 100 | 3-buten-2-ol, 2, 3-dimethyl- | C6H12O | N/A |

|
| 100 | Cyclohexanol | C6H12O | 9.75/10.0 |

|
| 100 | Propane, 1-(ethenyloxy)-2-methyl- | C6H12O | N/A |

|
| 100 | Butane, 1-(ethenyloxy)- | C6H12O | N/A |

|
| 100 | 4-methylpentanal | C6H12O | 9.80 |

|
| 100 | Cyclopropane, 1-methoxy-2, 3-dimethyl- | C6H12O | N/A |

|
| 100 | 2, 2-diethyl-oxirane | C6H12O | N/A |

|
| 100 | Oxirane, 3-ethyl-2, 2-dimethyl- | C6H12O | N/A |

|
| 100 | Oxirane, 2-methyl-3-(1-methylethyl)- | C6H12O | N/A |

|
| 100 | Pentanal, 2-methyl- | C6H12O | 9.70 |

|
| 100 | Oxirane, butyl- | C6H12O | N/A |

|
| 100 | Cyclopentanol, 1-methyl- | C6H12O | N/A |

|
| 100 | Tetrahydrofuran, 2, 2-dimethyl- | C6H12O | N/A |

|
| 100 | Furan, 2-ethyltetrahydro- | C6H12O | N/A |

|
| 100 | Furan, tetrahydro-2, 5-dimethyl- | C6H12O | N/A |

|
| 100 | 1-propene, 3-propoxy- | C6H12O | N/A |

|
| 100 | trans-1-butenyl ethyl ether | C6H12O | N/A |

|
| 100 | 4-penten-2-ol, 3-methyl- | C6H12O | N/A |

|
| 100 | Pentanal, 3-methyl- | C6H12O | 9.68/9.90 |

|
| 100 | 2-penten-1-ol, 2-methyl- | C6H12O | N/A |

|
| 100 | Cyclopentanol, 3-methyl- | C6H12O | N/A |

|
| 100 | 4-penten-2-ol, 4-methyl- | C6H12O | N/A |

|
| 100 | 1-penten-3-ol, 2-methyl- | C6H12O | N/A |

|
| 100 | Butanal, 2, 2-dimethyl- | C6H12O | N/A |

|
| 100 | 1-methoxy-3-methyl-2-butene | C6H12O | N/A |

|
| 100 | 3, 3-dimethyl-1, 2-epoxybutane | C6H12O | 10.04 |

|
| 100 | 2-hexen-1-ol | C6H12O | N/A |

|
| 100 | Cyclopentanol, 2-methyl- | C6H12O | N/A |

|
| 100 | 5-hexen-1-ol | C6H12O | N/A |

|
| 88 | 1-butanol, 3-methyl- | C5H12O | N/A |

|
| 88 | 3-pentanol | C5H12O | 9.76 |

|
| 88 | 2-butanol, 3-methyl- | C5H12O | 9.75/10.01 |

|
| 88 | 2-pentanol | C5H12O | 9.78 |

|
| 88 | Propane, 2-ethoxy- | C5H12O | 9.38 |

|
| 88 | Butane, 1-methoxy- | C5H12O | 9.54 |

|
| 88 | Propane, 1-ethoxy- | C5H12O | 9.5 |

|
| 88 | Butane, 2-methoxy- | C5H12O | 9.21 |

|
| 88 | 1-pentanol | C5H12O | 10.0/10.38 |

|
| 88 | 1-propanol, 2, 2-dimethyl- | C5H12O | 9.72 |

|
| 88 | Amylene hydrate | C5H12O | 9.8/10.16 |

|
| 88 | Butanal, 3-hydroxy- | C4H8O2 | N/A |

|
| 88 | Formic acid, propyl ester | C4H8O2 | 10.54 |

|
| 88 | Ethyl acetate | C4H8O2 | 10.01 |

|
| 88 | Methyl propionate | C4H8O2 | 10.15 |

|
| 88 | 2-propanone, 1-methoxy- | C4H8O2 | 9.66 |

|
| 88 | Formic acid, 1-methylethyl ester | C4H8O2 | 10.44 |

|
| 88 | Ethanol, 2-(vinyloxy)- | C4H8O2 | N/A |

|
| 88 | Propanoic acid, 2-methyl- | C4H8O2 | 10.24 |

|
| 88 | Ethene, 1, 1-dimethoxy- | C4H8O2 | N/A |

|
| 88 | Oxirane, (methoxymethyl)- | C4H8O2 | 9.5/10.08 |

|
| 88 | 1, 3-dioxolane, 4-methyl- | C4H8O2 | N/A |

|
| 88 | Butanoic acid | C4H8O2 | 10.17 |

|
| 88 | 2-butene-1, 4-diol | C4H8O2 | N/A |
|
| 88 | 1, 4-dioxane | C4H8O2 | 9.19/9.4 |

|
| 88 | Propanal, 3-methoxy- | C4H8O2 | N/A |

|
| 88 | 3-furanol, tetrahydro- | C4H8O2 | 9.77 |

|
| 88 | 3-butene-1, 2-diol | C4H8O2 | N/A |

|
| 88 | 1-hydroxy-2-butanone | C4H8O2 | N/A |

|
| 88 | Acetoin | C4H8O2 | N/A |

|
| 88 | Methylolacetone | C4H8O2 | N/A |

|
| 88 | Propanoic acid, 2-oxo- | C3H4O3 | 9.9/10.42 |

|
| 88 | Acetic formic anhydride | C3H4O3 | N/A |

|
| 88 | Methyl glyoxylate | C3H4O3 | N/A |

|
| 88 | 1, 3-dioxolan-2-one | C3H4O3 | 10.40 |

|
| 86 | Oxirane, propyl- | C5H10O | N/A |

|
| 86 | Trans-1-methoxy-1-butene | C5H10O | N/A |

|
| 86 | 3-buten-2-ol, 3-methyl- | C5H10O | 9.61 |

|
| 86 | 2-pentanone | C5H10O | 9.38 |

|
| 86 | Pentanal | C5H10O | 9.74 |

|
| 86 | 3-buten-2-ol, 2-methyl- | C5H10O | 9.90 |

|
| 86 | Furan, tetrahydro-3-methyl- | C5H10O | 9.25 |

|
| 86 | Oxirane, (1-methylethyl)- | C5H10O | N/A |

|
| 86 | 3-penten-2-ol | C5H10O | 9.56 |

|
| 86 | 2-penten-1-ol, (Z)- | C5H10O | N/A |

|
| 86 | 2-penten-1-ol, (E)- | C5H10O | N/A |

|
| 86 | (S)-2-methylbutanal | C5H10O | N/A |

|
| 86 | 1-propene, 3-methoxy-2-methyl- | C5H10O | N/A |

|
| 86 | 2-methoxy-1-butene | C5H10O | N/A |

|
| 86 | Trans-2-methoxy-2-butene | C5H10O | N/A |

|
| 86 | Cyclopropaneethanol | C5H10O | N/A |

|
| 86 | Butanal, methyl- | C5H10O | N/A |

|
| 86 | 1-methylcyclopropanemethanol | C5H10O | N/A |

|
| 86 | Oxirane, 2-ethyl-2-methyl- | C5H10O | N/A |

|
| 86 | Oxirane, 2-ethyl-3-methyl- | C5H10O | N/A |

|
| 86 | Prop-1-en-1, 2-dimethyl-1-ol | C5H10O | 8.15 |

|
| 86 | Trans-3-penten-2-ol | C5H10O | N/A |

|
| 86 | 3-penten-1-ol | C5H10O | N/A |

|
| 86 | Cyclobutanemethanol | C5H10O | N/A |

|
| 86 | 3-buten-1-ol, 2-methyl- | C5H10O | N/A |

|
| 86 | 2-buten-1-ol, 2-methyl- | C5H10O | N/A |

|
| 86 | Ethyl-1-propenyl ether | C5H10O | N/A |

|
| 86 | 1-butene, 4-methoxy | C5H10O | N/A |

|
| 86 | Oxirane, trimethyl- | C5H10O | N/A |

|
| 86 | 2-buten-1-ol | C5H10O | 9.13 |

|
| 86 | Allyl ethyl ether | C5H10O | N/A |

|
| 86 | 2-butanone, 3-methyl- | C5H10O | 9.31 |

|
| 86 | 1-ethylcyclopropanol | C5H10O | N/A |

|
| 86 | Butanal, 3-methyl- | C5H10O | 9.72 |

|
| 86 | 2-methylcyclo propanemethanol | C5H10O | N/A |

|
| 86 | 1-penten-3-ol | C5H10O | 9.6 |

|
| 86 | 4-penten-2-ol | C5H10O | 9.38 |

|
| 86 | 2-methoxybut-2-ene | C5H10O | N/A |

|
| 86 | Oxetane, 3, 3-dimethyl- | C5H10O | N/A |

|
| 86 | 3-buten-1-ol, 3-methyl- | C5H10O | N/A |

|
| 86 | Cyclopropyl methyl carbinol | C5H10O | N/A |

|
| 86 | 4-penten-1-ol | C5H10O | 9.42 |

|
| 86 | Propane, 2-(ethenyloxy)- | C5H10O | 8.90 |

|
| 86 | 2-ethoxypropene | C5H10O | N/A |

|
| 86 | Butanal, 2-methyl- | C5H10O | 9.59 |

|
| 86 | 3-pentanone | C5H10O | 9.31 |

|
| 86 | Cyclopentanol | C5H10O | 9.72 |

|
| 86 | Furan, tetrahydro-2-methyl- | C5H10O | 9.22 |

|
| 86 | Propanal, 2, 2-dimethyl- | C5H10O | 9.51 |

|
| 86 | Formic acid, 2-propenyl ester | C4H6O2 | N/A |

|
| 86 | 1, 2-dioxin, 3, 6-dihydro- | C4H6O2 | 9.5 |

|
| 86 | 1-propen-2-ol, formate | C4H6O2 | N/A |

|
| 86 | Crotonic acid | C4H6O2 | N/A |

|
| 86 | 2, 3-butanedione | C4H6O2 | 9.3 |

|
| 86 | 4-methylene-1, 3-dioxolane | C4H6O2 | N/A |

|
| 86 | Isocrotonic acid | C4H6O2 | 10.08 |

|
| 86 | 2-butenoic acid, (E)- | C4H6O2 | 9.9 |

|
| 86 | Acetic acid ethenyl ester | C4H6O2 | 9.2 |

|
| 86 | 2-butyne-1, 4-diol | C4H6O2 | N/A |

|
| 86 | 1, 3-dioxole, 4-methyl- | C4H6O2 | N/A |

|
| 86 | 1, 4-dioxin, 2, 3-dihydro- | C4H6O2 | 8.07 |

|
| 86 | 3-butenoic acid | C4H6O2 | 9.75 |

|
| 86 | 2-propenoic acid, 2-methyl- | C4H6O2 | 10.15 |

|
| 86 | 2-propenoic acid, methyl ester | C4H6O2 | 9.9 |

|
| 86 | Butyrolactone | C4H6O2 | 10.26 |

|
| 72 | 1-propene, 3-methoxy- | C4H8O | 9.6 |

|
| 72 | 3-buten-2-ol | C4H8O | 9.5 |

|
| 72 | 3-buten-1-ol | C4H8O | 9.56 |

|
| 72 | 1-buten-2-ol | C4H8O | 8.6 |

|
| 72 | Oxirane, ethyl- | C4H8O | 10.15 |

|
| 72 | Ethyl vinyl ether | C4H8O | 9.0 |

|
| 72 | Oxirane, 2, 3-dimethyl-, trans- | C4H8O | 9.9 |

|
| 72 | Oxirane, 2, 2-dimethyl- | C4H8O | 10.0 |

|
| 72 | Cyclobutanol | C4H8O | 9.5 |

|
| 72 | 1-buten-1-ol | C4H8O | 8.34 |

|
| 72 | 2-buten-1-ol | C4H8O | 9.13 |

|
| 72 | 2-methylprop-1-en-1-ol | C4H8O | 8.4 |

|
| 72 | 1-propene, 2-methoxy- | C4H8O | 8.64 |

|
| 72 | 2-methyl-2-propen-1-ol | C4H8O | 9.2 |

|
| 72 | Tetrahydrofuran | C4H8O | 9.40 |

|
| 72 | 2-methylpropanal | C4H8O | 9.7 |

|
| 72 | Butanal | C4H8O | 9.82 |

|
| 72 | 2-butanone | C4H8O | 9.52 |

|
| 72 | Propiolactone | C3H4O2 | 9.70 |

|
| 72 | Methyl glyoxal | C3H4O2 | 9.60 |

|