


Abstract
We report the discovery by the intermediate Palomar Transient Factory (iPTF) of a candidate tidal disruption event (TDE) iPTF16axa at z = 0.108 and present its broadband photometric and spectroscopic evolution from three months of follow-up observations with ground-based telescopes and Swift. The light curve is well fitted with a t−5/3 decay, and we constrain the rise time to peak to be <49 rest-frame days after disruption, which is roughly consistent with the fallback timescale expected for the ∼5 × 10⁶ M⊙ black hole inferred from the stellar velocity dispersion of the host galaxy. The UV and optical spectral energy distribution is well described by a constant blackbody temperature of T ∼ 3 × 10⁴ K over the monitoring period, with an observed peak luminosity of 1.1 × 1044 erg s−1. The optical spectra are characterized by a strong blue continuum and broad He ii and Hα lines, which are characteristic of TDEs. We compare the photometric and spectroscopic signatures of iPTF16axa with 11 TDE candidates in the literature with well-sampled optical light curves. Based on a single-temperature fit to the optical and near-UV photometry, most of these TDE candidates have peak luminosities confined between log(L [erg s−1]) = 43.4–44.4, with constant temperatures of a few ×104 K during their power-law declines, implying blackbody radii on the order of 10 times the tidal disruption radius, that decrease monotonically with time. For TDE candidates with hydrogen and helium emission, the high helium-to-hydrogen ratios suggest that the emission arises from high-density gas, where nebular arguments break down. We find no correlation between the peak luminosity and the black hole mass, contrary to the expectations for TDEs to have .

1. Introduction
A tidal disruption event (TDE) occurs when a star passes close enough to a supermassive black hole (SMBH) for the tidal forces of the black hole to exceed the self-gravity of the star, and the star is torn apart by the encounter. For a stellar approach on a nearly parabolic orbit, about half of the stellar debris will remain bound to the black hole, while the other half gains enough energy to escape the gravitational attraction of the black hole. As the bound material returns to pericenter, the material will feed onto the black hole and generate a flare of radiation. The classical solution assuming a uniform mass distribution predicts the mass fallback rate () to follow a t−5/3 power-law decay (Rees 1988; Phinney 1989) that can be expressed as . The peak mass fallback rate is defined as , while the fallback time tmin is proportional to (Lodato & Rossi 2011).


Although it is shown that in a more detailed calculation the mass fallback rate is determined by the internal structure of the star and even the spin of the black hole, the fallback rate at late times generally approaches the classical t−5/3 power law (Lodato et al. 2009; Guillochon & Ramirez-Ruiz 2013). Theoretically, the peak mass accretion rate depends on the mass of the black hole as (Lodato & Rossi 2011). For a smaller black hole with MBH ≲ 107 M⊙, the initial stage of the accretion is expected to be super-Eddington (Strubbe & Quataert 2009; Lodato & Rossi 2011). However, it is still unclear how the fallback rate translates to the observed luminosity.

The first few discoveries of TDEs were made in the 1990s in the form of luminous soft X-ray outbursts in quiescent galaxies from the ROSAT survey (Brandt et al. 1995; Grupe et al. 1995, 1999; Bade et al. 1996; Komossa & Bade 1999; Komossa & Greiner 1999; Greiner et al. 2000). Several more TDE candidates with similar properties were found in archival searches with the XMM-Newton Slew Survey (Esquej et al. 2007, 2008) and Chandra (Maksym et al. 2013; Donato et al. 2014), until the serendipitous discovery of jetted TDE candidates with hard X-ray spectra and super-Eddington luminosities by the Swift satellite (Bloom et al. 2011; Burrows et al. 2011; Levan et al. 2011; Zauderer et al. 2011; Cenko et al. 2012). Most of the recent discoveries of TDEs have been in the UV and optical, exploiting the wide-field UV capabilities of GALEX, and optical synoptic sky surveys such as the Sloan Digital Sky Survey (SDSS), Palomar Transient Factory (PTF), Pan-STARRS1 (PS1), and the All-Sky Automated Survey for Supernovae (ASASSN). The UV or optically discovered TDE candidates tend to peak in the UV with blackbody temperatures of a few × 104 K, while the non-jetted X-ray TDE candidates have temperatures in the range of ∼(0.6–1.0) × 106 K. It is worth mentioning that all of the optically detected TDE candidates are weak or not detected in the X-rays, except ASASSN-14li (Holoien et al. 2016b).
While the temperature of X-ray TDEs is roughly consistent with the theoretical expectations for radiation powered by mass accretion in the TDE debris disk, the discovery of optical TDEs has challenged this simple picture. Not only do they have a much lower temperature than expected, but the lack of temperature evolution in tandem with the decreasing accretion rate is also in disagreement with thermal radiation from the debris disk. Many studies have tried to resolve this discrepancy by considering several mechanisms that could lead to the observed signature. For example, the production of an optically thick envelope that radiates at the Eddington limit (Loeb & Ulmer 1997), or a strong disk wind or outflow that regulates the accretion rate (Strubbe & Quataert 2009; Miller 2015; Metzger & Stone 2016). Alternatively, elliptical accretion may cause energy to be lost to the black hole before circularization, resulting in 1%–10% of the bolometric efficiency of a standard accretion disk (Svirski et al. 2017).
Another weakness in the classical picture of TDEs is debris circularization, which was assumed to happen immediately when the debris returns to pericenter (Rp) (Rees 1988). Recent work by Shiokawa et al. (2015) has shown that orbital energy cannot be dissipated efficiently at r ∼ Rp and therefore the circularization process does not happen as quickly as previously thought. Instead, stream–stream collisions are thought to play an important role in producing shocks that convert kinetic energy into thermal energy (Kochanek 1994). In Dai et al. (2015), the extent of apsidal precession that causes different distances of self-intersection of the tidal debris from the SMBH was proposed to explain why there exist two populations of TDE temperatures. Hydrodynamical simulations also suggest that stream–stream collisions may be responsible for the observed UV/optical emission of TDEs (Piran et al. 2015; Shiokawa et al. 2015; Jiang et al. 2016; Bonnerot et al. 2017).
The method for photometric selection of TDEs in optical transient surveys was demonstrated in an archival study of the SDSS Stripe 82 Survey by van Velzen et al. (2011), and resulted in the recovery of two likely TDE candidates. Since then, on the order of a dozen of optical TDEs have been discovered promptly enough for spectroscopic follow-up observations, and they show a diversity of broad hydrogen and helium emission line strengths. For example, the optical spectra of PS1-10jh, PTF09ge, and ASASSN-15oi display broad He iiλ4686 emission lines with no sign of Hα emission, ASASSN-14li shows both broad prominent He ii and Hα emission, and ASASSN-14ae has strong Hα emission and a weaker but broad He iiλ4686 that developed later in time. The spectral family of TDEs was first discussed in Arcavi et al. (2014). The mechanisms behind the spectroscopic signatures are still under debate. Proposed explanations include the chemical composition of the progenitor star (Gezari et al. 2012), and photoionization conditions in the debris disk (Guillochon et al. 2014) or an optically thick reprocessing envelope (Roth et al. 2016).
The paper is structured as follows. In Section 2, we present the discovery of a newly discovered optical TDE candidate iPTF16axa. We describe the pre-event data associated with its host galaxy in Section 3 and the follow-up photometric and spectroscopic observations we obtained for iPTF16axa in Section 4. The results of the spectral energy distribution (SED) and spectral analyses are presented in Section 5. In Section 6, we compare the physical quantities derived from the SEDs and the spectral measurements with 11 UV/optical events that are classified as strong TDE candidates with well-sampled optical light curves.
2. Discovery of iPTF16axa
iPTF16axa (right ascension, αJ2000 = 17h03m34 36; declination, σJ2000 = +30°35'36
 8) is a TDE discovered by the intermediate Palomar Transient Factory (iPTF) using the Palomar 48-inch (P48) telescope. The flare was first detected on UT 2016 May 29 (UT dates are used throughout the paper) with a host flux subtracted magnitude of g = 19.49 ± 0.07 mag. Astrometrically aligned P48 images show that the position of the flare is coincident with the nucleus of the host galaxy, with an offset of 0.17 arcsec that is within the positional uncertainties measured for a reference active galactic nucleus (AGN) sample of 0.3 arcsec. Constraints on the peak time are not available since the field is not regularly monitored by iPTF. However, the PTF survey visited this field in 2011 March–September, 2012 March, 2013 August, and 2014 May–June. No historical variability activity was detected to a 3σ limiting magnitude of R ≈ 21 mag in any observations during the aforementioned period, which indicates that the source of the flare is unlikely to be caused by a variable AGN.
We requested a target-of-opportunity (ToO) observation of iPTF16axa on 2016 June 01 using our Cycle 12 Swift key project (PI Gezari) triggers, which are designed for a systematic follow-up of iPTF nuclear transients with red host galaxies. The transient satisfies our selection criteria: observations made with the Palomar-60 inch (P60) telescope show that the transient has a blue color (g − r ∼ −0.4 mag) and is found in a red host galaxy (u − g = 1.94 mag and g − r = 0.91 mag) as is revealed by the Sloan Digital Sky Survey Data Release 9 (SDSS DR9).
The observation made with the Swift satellite on 2016 June 07 using the UV–optical telescope (UVOT) in the uvw2 filter showed signs of a UV bright source. After triggering the Swift ToO observation, a classification spectrum was also taken with Keck DEIMOS on 2016 June 04. The classification spectrum shows a conspicuous broad He iiλ4686 line as well as Hα emission lines at z = 0.108 that are indicative of TDEs discovered in the optical. However, a simultaneous Swift X-Ray Telescope (XRT) observation did not show any sign of X-ray emission in 0.3–10 keV. A VLA observation made on June 12 also resulted in null detection with a rms of 13 μJy at 6.1 GHz and 15 μJy at 22 GHz. With the Swift UVOT photometry and the classification spectrum confirming iPTF16axa being a strong TDE candidate, we triggered a series of follow-up programs in the UV and optical over a span of three months until the target was not observable by ground-based telescopes.
3. Archival Data
The celestial position of iPTF16axa was covered by SDSS. A galaxy associated with this position, SDSS J170334.34+303536.6, has photometry measurements in ugriz. However, no spectroscopy is found to be associated with the host galaxy.
Archival AllWISE data (Cutri et al. 2013) show that the host galaxy was observed with 15.8 mag, 15.5 mag, <11.7 mag, and <9.4 mag in 3.4, 4.6, 12, and 22 μm, respectively, in the Vega system. Pre-event GALEX or ROSAT limits of the host galaxy are not available.
3.1. Host Galaxy Properties
Due to the long-lived nature of TDE, we were not able to obtain a host galaxy spectrum of iPTF16axa for this analysis before it went behind the Sun in October.
We perform synthetic stellar population template fitting to the SDSS broadband photometry cmodelMag in ugriz as well as the WISE 3.4 and 4.6 μm photometry with Fitting and Assessment of Synthetic Templates (FAST) by Kriek et al. (2009). Assuming an exponentially declining star-formation history with the Bruzual & Charlot (2003) templates, a Salpeter IMF, the Cardelli et al. (1989) dust extinction law, and AV = 0.12 from the Schlafly & Finkbeiner (2011) dust map, the fitting program yields a of 1.57. The results of the fit suggest that star formation has quenched in the galaxy with an SFR of 10−6.6 M⊙ yr−1. In 2017 February, we obtained a high-resolution spectrum of iPTF16axa with the Echellette Spectrograph and Imager (ESI) mounted on the Keck-II telescope (PI Gezari). We observed the host galaxy and a template GIII star BD+332423 with the 05 slit for a total integration time of 3600 s and 120 s, respectively. The data is reduced with the MAuna Kea Echelle Extraction (MAKEE
16
) package, while the wavelength is calibrated with IRAF.

We measure a stellar velocity dispersion of 101.3 ± 1.9 km s−1 with the Mg ib λλ5167, 5173, 5184 triplet (Figure 1) by broadening the GIII stellar template to match the linewidths in the host spectrum. The velocity dispersion translates to a black hole mass of M⊙ (McConnell & Ma 2013). Despite the large intrinsic scatter in the M–σ relation (0.38 dex), the black hole mass estimated from velocity dispersion is within the range of allowable black hole masses able to disrupt a solar-type star outside of its event horizon.


Figure 1. Spectral fit around the Mg ib triplet region. The black line shows the Keck ESI spectrum of the host galaxy of iPTF16axa. The red line marks the Keck ESI spectrum of a GIII star BD+332423 that has been broadened to fit the absorption linewidths in the host.
Download figure:
Standard image High-resolution image4. Follow-up Observations
4.1. Photometry
The follow-up photometric observations of iPTF16axa are described in this section. These measurements are presented in Table A1.
4.1.1. P48 and P60 Photometry
On 2016 May 29, the transient iPTF16axa was discovered in the g band, while iPTF conducted a seasonal experiment that searches for young supernovae using the P48 telescope in Mould-R and SDSS-g' filters to a depth of ∼20.5 mag with a four-day cadence. The nightly P48 raw images are detrended and astrometrically and photometrically calibrated at the Infrared Processing and Analysis Center (IPAC; Laher et al. 2014). Following the discovery of the transient, we requested a series of observations of the source in gri bands with the robotic Palomar 60-inch telescope in order to keep track of the color evolution. The collected data are processed by the Fremling Automated Pipline (Fremling et al. 2016) that performs image subtraction with respect to the SDSS images and extracts the PSF magnitude of the source.
4.1.2. LCO Photometry
We obtained six epochs of the Las Cumbres Observatory (LCO) follow-up photometry in gri bands. Host flux subtraction is performed using SDSS references. The LCO light curves are consistent with the P60 data but have larger error bars due to cross-subtractions of LCO and SDSS. Therefore, the LCO data are not included in the light-curve fit in Section 5.1. The LCO subtractions may be improved once the LCO references are obtained.
4.1.3. Swift UVOT and XRT Photometry
Following the discovery of TDE emission signatures from the spectroscopy, we requested and were granted 13 ToO observations spanning a time period of ∼2.5 months with Swift. The observations were made in all six filters of UVOT: UVW2 (1928 Å), UVM2 (2246 Å), UVW1 (2600 Å), U (3465 Å), B (4392 Å), and V (5468 Å). We used a 5'' radius aperture and a 20'' background region to extract the photometry of the UV source with the task uvotsource in HEASoft.17 Note that due to the lack of pre-event UV limits, we do not attempt to perform host subtraction with the UVOT images.
We also observed the location of iPTF16axa with the XRT (Burrows et al. 2005) on board the Swift satellite Gehrels et al. (2004) beginning at 4:32 UT on 2016 June 7. Regular monitoring of the field in photon counting mode continued for the next 10 weeks.
No significant emission is detected in individual epochs. Using standard XRT analysis procedures (e.g., Evans et al. 2009), we place 90% confidence upper limits ranging from (2.9–12.0) × 10−3 counts s−1 in the 0.3–10.0 keV bandpass over this time period. Stacking all the XRT data obtained over this period together (29 ks of total exposure time) also results in an upper limit of 2.7 × 10⁻⁴ counts s−1.
To convert this count rate to a flux, we adopt a power-law spectrum with a photon index of Γ = 2 and incorporate absorption from the Milky Way (but none in the TDE host galaxy). We then find an upper limit on the time-averaged unabsorbed X-ray flux from the location of iPTF16axa of <1.1 × 10⁻¹⁴ erg cm−2 s−1 (90% confidence limit). At the distance of iPTF16axa, this corresponds to a 0.3–10.0 keV X-ray luminosity of LX < 3.3 × 1041 erg s−1. While this limit is significantly fainter than the luminous X-ray emission observed from ASASSN-14li (Holoien et al. 2016b; van Velzen et al. 2016a), it is comparable to the much fainter emission observed from ASASSN-15oi (LX = 4.8 × 1041 erg s−1; Holoien et al. 2016a). Furthermore, it is several orders of magnitude above the faint X-ray emission observed at the location of iPTF16fnl (LX = 2.4 × 1039 erg s−1; Blagorodnova et al. 2017).
4.2. Spectroscopy
4.2.1. Keck DEIMOS
A Keck DEIMOS classification spectrum was scheduled three days after the first Swift ToO observation was triggered (2016 June 04). The spectrum was taken with a 08 wide slit along with the LVMslitC slit mask and a 600ZD grating. The on-source exposure time was 360 s. The data was reduced using the DEIMOS DEEP2 data reduction pipeline with flux calibrated by the spectrum of a spectrophotometric standard star, BD+28d4211, taken on the same night.
4.2.2. Keck LRIS
Keck LRIS spectra were taken on 2016 June 10 and July 06. Same configurations were used and the integration time was 900 s in both nights. The spectra were taken with a 1'' slit and a 400/3400 grism that yields an FWHM resolution of ∼7 Å. The data were reduced with the LRIS automated reduction pipeline.18 The observed flux standard star is BD+28d4211.
4.2.3. Discovery Channel Telescope (DCT) DeVeny
An exposure of iPTF16axa was taken on June 13 with the 4.3 m DeVeny spectrograph mounted on the DCT. A 15 slit and a 300 g mm−1 grating were used with a central wavelength setting of 5800 Å. The spectral coverage is 3600–8000 Å at a dispersion of ∼2.2 Å per pixel, yielding an FWHM resolution of ∼9 Å. Data were reduced with standard IRAF routines, which include bias removal, flat-fielding, 1d spectrum extraction, wavelength calibration, and flux calibration using spectrophotometric standard star BD+40d4032.
5. Analysis
Throughout this paper, we correct for Galactic extinction for all data used for the analysis using the Cardelli et al. (1989) extinction curve with RC = 3.1 and E(B − V) = 0.0390 based on the Schlafly & Finkbeiner (2011) dust map. We use a luminosity distance of dL = 505 Mpc based on a WMAP9 cosmology with H0 = 69.32 km s−1 Mpc−1, ΩM = 0.29, ΩΛ = 0.71.
5.1. Light Curves
Classical calculations assume a uniform distribution in specific energy so that the bound stellar debris returns to the pericenter at a rate of t−5/3 (Rees 1988; Phinney 1989). For more realistic energy distributions, there are deviations from t−5/3 at early times, but the light curve eventually approaches a t−5/3 power law at late times (Lodato et al. 2009), or approaches a power-law index within a range of values that brackets −5/3 (Guillochon & Ramirez-Ruiz 2013). The t−5/3 power law can be expressed as

where tD is the time of disruption. We fit the light curves in both g and r bands simultaneously with data taken by P48 and P60 telescopes. With a fixed power-law index of −5/3, we can rewrite Equation (1) as

where mobs is the observed magnitude and N is a normalization constant. We derived a disruption time (tD) of MJD 57482.9 ± 1.1 using emcee (Foreman-Mackey et al. 2013), a python implementation of the Affine invariant Markov chain Monte Carlo (MCMC) ensemble sampler. The corner plot for 1000 MCMC simulations is shown in Figure 2. If we loosen the fitting parameter constraints further by allowing the power-law index to change freely, we obtain a best-fit power-law index of and a tD of 57494.7 ± 0.1. The derived values imply the rise time to peak light is shorter than 49 rest-frame days assuming the peak was reached some time before the discovery of iPTF16axa.


Figure 2. Corner plot of the light-curve fit, which contains 1000 MCMC simulations.
Download figure:
Standard image High-resolution imageThe light curve is fitted well by a t−5/3 power law in all the UV and optical bands, with a constant color between the bands with time. The model fit shown in Figure 3 has the colors UVW2 − r = −1.05 mag and g − r = −0.34. The lack of color evolution and the observed t−5/3 power-law decline in the UV and optical bands requires a fixed temperature over time to be consistent with the expected t−5/3 evolution of the bolometric luminosity.

Figure 3. Light curve of iPTF16axa with a t−5/3 power-law fit and dates normalized to the derived disruption time MJD 57482.9. The circles and squares for gribands denote the host-subtracted data taken with P60 and P48, respectively, while the diamonds are the extrapolated magnitudes at the time of iPTF discovery. The open triangles in gri bands mark the LCO host-subtracted magnitudes. Note that the LCO data are not included in the light-curve fit since the cross-subtractions of LCO data and SDSS result in larger error bars.
Download figure:
Standard image High-resolution imageIn Figure 4, we show the best-fit blackbody spectrum implied by these colors using the magnitudes extrapolated from the power law in Figure 3 to the time of discovery MJD 57537.4 in UVW2, UVM2, UVW1, u, g, r, and i bands. The best-fit blackbody temperature implied by the light-curve model is 2.85 × 10⁴ K. Using the X-ray upper limit, we also place an upper limit of 1.85 × 10⁵ K on the blackbody temperature of the TDE, which is shown in the green dashed line in Figure 4.

Figure 4. Blackbody fit of the UV–optical SED derived from the t−5/3 power-law fit in Section 5.1 extrapolated to tdisc = MJD 57537.4. The gray curves show the highest and lowest temperatures bounded by the 90% confidence interval. The green curve shows the blackbody spectrum corresponding to Tbb = 1.85 × 10⁵ K, which is an upper limit on the temperature imposed by the stacked Swift XRT flux in 0.3–10 keV.
Download figure:
Standard image High-resolution image5.2. SED Analysis
Given the archival SDSS u-band magnitude of the host is ∼21.4 mag, we assume that the host light contribution is negligible in UVOT filters with shorter wavelengths (UVW2, UVM2, UVW1, u). The data in B and V bands are excluded for data analysis since the contribution from the host galaxy is unknown. We also collected the host-subtracted photometry in gri from P48 and P60, which use images from IPAC and SDSS as references, respectively.
To construct UV–optical SEDs at different epochs, we interpolate the host-subtracted flux in g and r bands using the t−5/3 light curves in Figure 3 to the epoch of Swift observations. The uncertainties of the interpolated magnitudes in g and r are estimated to be the weighted residual of the light-curve fit with the t−5/3 power law.
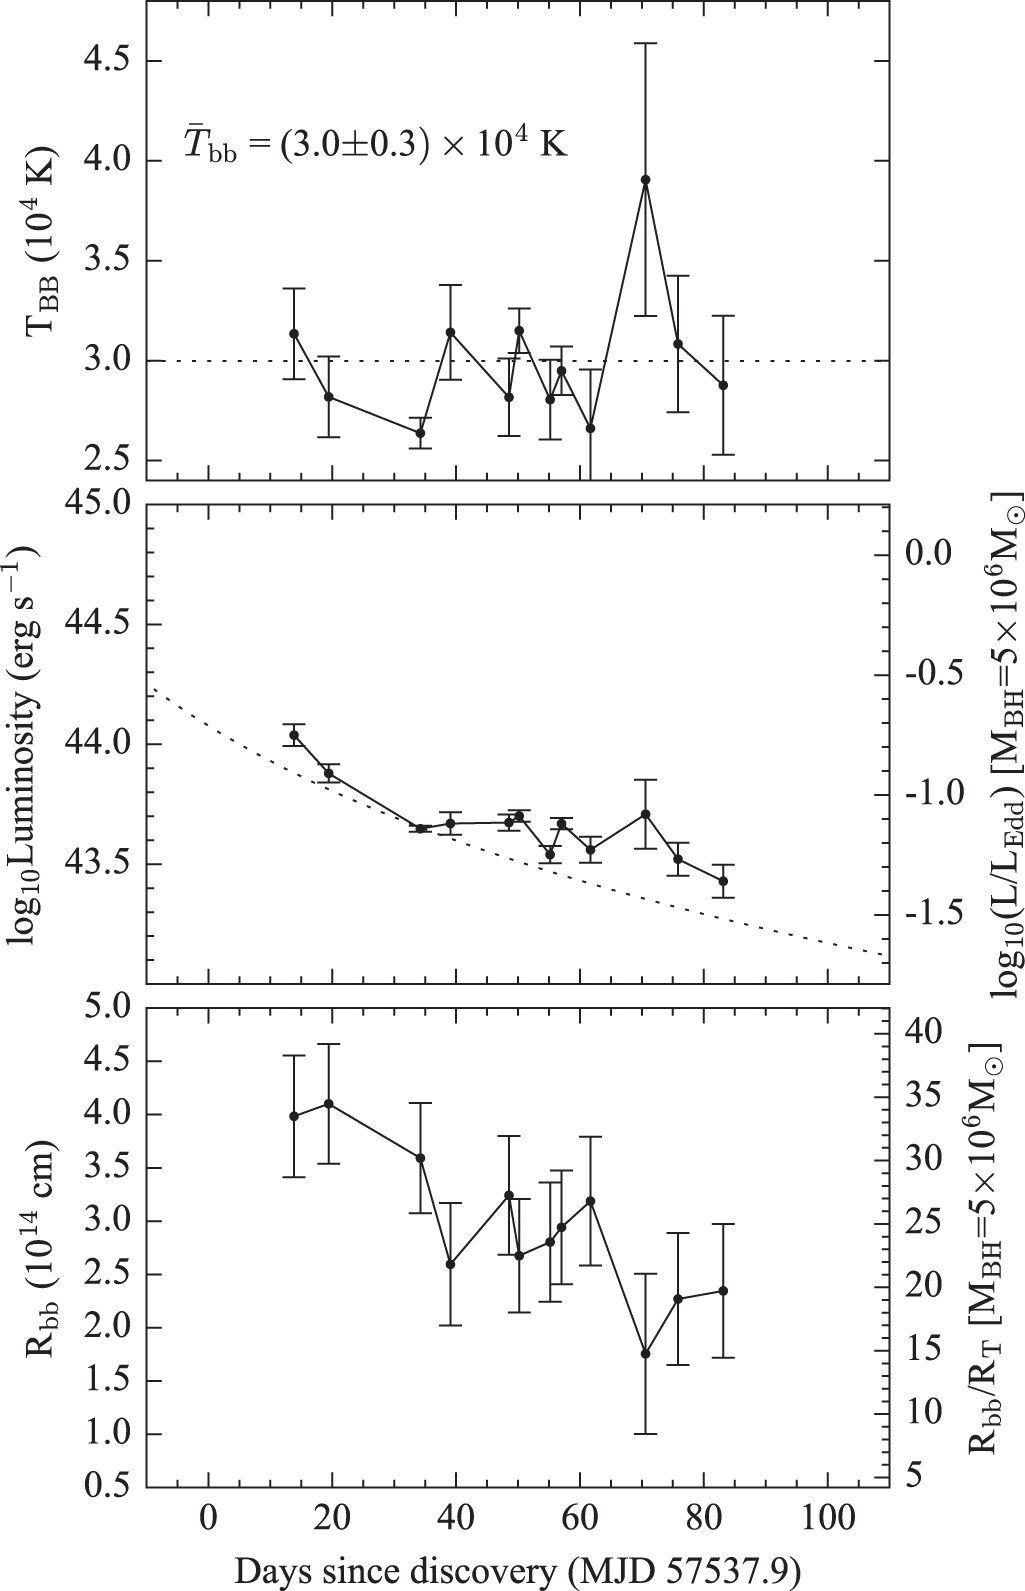
The SEDs are fit with a blackbody using the Markov chain Monte Carlo (MCMC) method. Shown in Figure 5 are the best-fit blackbody spectra. The 1σ uncertainties of the model parameter are shown by the two gray lines in each panel, representing the upper and the lower bound of the best-fit temperature. The best-fit blackbody temperatures are plotted as a function of time in the top panel of Figure 6. The blackbody temperatures of iPTF16axa remained at nearly constant temperature = (3.0 ± 0.33) × 104 K over the 80 days of Swift monitoring.


Figure 5. Blackbody fit for the transient SEDs. The time indicated in each panel shows the time elapsed since discovery tdisc = MJD 57537.4. The blackbody temperature remains roughly constant with a mean temperature 3 × 10⁴ K over time.
Download figure:
Standard image High-resolution image
Figure 6. Time evolution of iPTF16axa. Upper: the time evolution of blackbody temperature of iPTF16axa. The black dotted line marks the mean Tbb of 3 × 10⁴ K. Middle: the evolution of integrated UV–optical luminosity. The black dotted line shows the t−5/3 prediction from the light curve with a peak luminosity indicated in Figure 4. Total power emitted (area under the dotted line integrated from tdisc to ) is 5.5 × 1050 erg. Lower: the time evolution of the blackbody radius inferred from SED fitting.

Download figure:
Standard image High-resolution imageIn Figure 6, we also plot the time evolution of the UV–optical integrated luminosity and the blackbody radius in the middle and the bottom panels. We calculate the luminosity by integrating the area under the best-fit blackbody for each SED, which follows the theoretical t−5/3 law. Given that there is no detection in the X-ray, we assume that the bolometric luminosity of the transient is dominated by the emission in the UV and optical. The observed peak luminosity of 1.1 × 1044 erg s−1 corresponds to an Eddington ratio of 17.4% for a 5 × 10⁶ M⊙ black hole and a mass accretion rate () of 1.8 × 10⁻² ( /0.1)−1 M⊙ yr−1, where is the accretion efficiency. The total energy integrated under the model fit from from tdisc to is 5.5 × 1050 erg, which corresponds to a total mass accreted of 3.1 × 10⁻³ (/0.1)−1 M⊙. Note, that this is a small fraction of the 0.5 M⋆ of mass expected to remain bound to the black hole in a TDE (Rees 1988) unless the radiative efficiency () is low .


We also calculate the emitting radius of the blackbody using the Stefan–Boltzmann law:

where L is the luminosity integrated from the best-fit blackbody spectrum to the SED, Rbb is the blackbody radius, and Te is the effective temperature, which is set to be equal to the blackbody temperature derived from the SED fit. In Table 1, we list our fits for the blackbody temperature, luminosity, and photospheric radius for each of our photometric observations. In the bottom panel of Figure 6, we plot our fit for the photospheric radius as a function of time, where the y-axis on the right hand side of Figure 6 shows the radius in units of the tidal radius (RT) assuming the disrupted star is a solar mass star. The tidal radius, RT = R⋆ (MBH/M⋆)1/3, is 1.19 × 1013 cm for a 5 × 10⁶ M⊙ black hole.
Table 1. Blackbody Fitting from Light Curves
| MJD | t − tdisc | BB Temperature | BB Radius | Luminosity |
|---|---|---|---|---|
| days | 104 K | 1014 cm | 1043erg s−1 | |
| 57551.23 | 14 | 3.13 ± 0.23 | 3.98 ± 2.27 | 10.91 ± 1.14 |
| 57556.82 | 19 | 2.82 ± 0.2 | 4.1 ± 2.31 | 7.56 ± 0.66 |
| 57571.63 | 34 | 2.64 ± 0.08 | 3.59 ± 1.86 | 4.44 ± 0.13 |
| 57576.48 | 39 | 3.14 ± 0.24 | 2.6 ± 1.49 | 4.67 ± 0.51 |
| 57585.93 | 49 | 2.82 ± 0.19 | 3.24 ± 1.81 | 4.71 ± 0.37 |
| 57587.59 | 50 | 3.15 ± 0.11 | 2.68 ± 1.42 | 5.02 ± 0.28 |
| 57592.58 | 55 | 2.8 ± 0.2 | 2.8 ± 1.57 | 3.46 ± 0.29 |
| 57594.42 | 57 | 2.95 ± 0.12 | 2.94 ± 1.57 | 4.67 ± 0.25 |
| 57599.09 | 62 | 2.66 ± 0.29 | 3.19 ± 1.93 | 3.63 ± 0.45 |
| 57608.0 | 71 | 3.91 ± 0.68 | 1.76 ± 1.32 | 5.11 ± 1.69 |
| 57613.24 | 76 | 3.08 ± 0.34 | 2.27 ± 1.41 | 3.32 ± 0.53 |
| 57620.54 | 83 | 2.88 ± 0.35 | 2.35 ± 1.47 | 2.68 ± 0.43 |
Download table as: ASCIITypeset image
5.3. Spectral Analysis
Five follow-up spectra are shown in Figure 7. We also show the best-fit host spectrum from FAST fit with SDSS fiberMag (flux enclosed in a 3'' diameter fiber) in ugriz filters as described in Section 3.1. In Figure 7, we rescale all the new spectra to the synthetic magnitude in the r band (mr,syn), which is defined as

where mr,0 is the fiber magnitude of the host and mr,sub is the host-subtracted r-band magnitude derived from the t−5/3 power-law fit at the time of the observation.

Figure 7. Newly observed spectra and host spectrum obtained from fitting the SDSS broadband photometry.
Download figure:
Standard image High-resolution imageIn order to measure the broad emission lines in the spectra, we first subtract off the instrumental broadened host template spectrum from the FAST fit in Section 3.1, where , for each spectrum. The FWHM resolution of the Bruzual & Charlot (2003) template library is 3 Å. The host-subtracted spectra are shown in Figure 8.


Figure 8. Host-subtracted spectra of the new observations. The flux levels are offset for better visualization. The DEIMOS spectrum is smoothed by two pixels.
Download figure:
Standard image High-resolution imageIt is known that the spectroscopic signatures of optically discovered TDEs consist of a strong blue continuum and a combination of broad He ii and Hα emission (Arcavi et al. 2014). We select the regions outside of the Balmer lines and the He ii emission line in the host-subtracted spectrum to estimate the continuum. The line-free regions are fit with a fifth-order Legendre polynomial. A blackbody spectrum with Tbb = 3.0 × 10⁴ (K) is shown in red in Figure 9, which is the mean blackbody temperature from the SED fit. The blackbody spectrum shows a depature from the host-subtracted spectrum at rest wavelength λ > 4500 Å.

Figure 9. Example of continuum subtraction of the host-subtracted LRIS spectrum from July 06. The black solid line shows the spectrum smoothed by 2 pixels. The green line shows the best-fit fifth-order Legendre polynomial, while the red curve shows a blackbody spectrum. The spectrum near the dashed line is the residual from the subtraction of a fifth-order Legendre polynomial, which fits the spectrum better at shorter wavelengths.
Download figure:
Standard image High-resolution imageWe approximate the continuum with the Legendre polynomial because it fits the spectra better than the blackbody spectrum and does not require an assumption of the physical origin for the continuum. The line profiles of He iiλ4686 and Hα are measured after host and TDE continuum subtraction. The best-fit results are shown as red lines in Figure 10, where the gray solid line is the flux of the subtracted spectrum centered at the indicated line in velocity space. We simultaneously fit the He iiλ4686 (orange) and Hβ (green) emissions as two individual Gaussian profiles. The Hα line is modeled as a single Gaussian. The linewidths and line luminosities are listed in Table 2.

Figure 10. Time evolution of He ii and Hα line profiles. The black solid lines show the TDE spectra after host and continuum subtraction. The TDE spectra are binned by a factor of three for clarity. He ii (orange) and Hβ (green) lines are fit simultaneously with two Gaussian profiles to resolve spectral blending. The best-fit results are shown by the red solid lines. The time in the upper right corner corresponds to the time elapsed since discovery (MJD 57537.4).
Download figure:
Standard image High-resolution imageTable 2. Emission Line Fit
| Date | He ii FWHM | L(He ii) | Hα FWHM | L(Hα) |
|---|---|---|---|---|
| (103 km s−1) | (1040 erg s−1) | (103 km s−1) | (1040 erg s−1) | |
| 2016 Jun 04 | 5.8 ± 0.3 | 12.5 ± 0.8 | 8.8 ± 0.3 | 7.6 ± 0.3 |
| 2016 Jun 10 | 9.2 ± 0.3 | 15.1 ± 0.6 | 11.2 ± 0.4 | 8.3 ± 0.4 |
| 2016 Jun 13 | 9.5 ± 0.4 | 12.8 ± 0.7 | 9.5 ± 0.9 | 6.8 ± 0.8 |
| 2016 Jul 06 | 8.6 ± 0.4 | 9.1 ± 0.6 | 8.1 ± 0.3 | 6.0 ± 0.3 |
| 2016 Sep 12 | 12.6 ± 4.2 | 7.0 ± 2.6 | 19.5 ± 2.4 | 11.2 ± 1.5 |
Download table as: ASCIITypeset image
6. Discussion
In this section, we start by discussing other potential mechanisms that could drive the observed flare and the implication of the derived rise time for iPTF16axa. We then compare its properties with 11 TDE candidates discovered in UV and optical sky surveys with well-sampled optical light curves: D1-9 and D3-13 from GALEX+CFHTLS (Gezari et al. 2008), TDE1 and TDE2 from SDSS (van Velzen et al. 2011), PTF09ge from PTF (Arcavi et al. 2014), PS1-10jh (Gezari et al. 2012), and PS1-11af (Chornock et al. 2014) from GALEX+Pan-STARRS1, ASASSN-14ae (Holoien et al. 2014), ASASSN-14li (Holoien et al. 2016b), and ASASSN-15oi (Holoien et al. 2016a) from ASASSN, and iPTF16fnl (Blagorodnova et al. 2017). The luminosities, temperatures, and radii of the three ASASSN candidate TDEs (ASASSN-14ae, ASASSN-14li, ASASSN-15oi) are provided by T. Holoien via private communication. We calculate the luminosities and radii for the other TDE candidates by scaling the best-sampled optical light curve (g- or r-band) to the peak bolometric luminosity reported in the literature, and assuming a constant temperature fixed to the value reported in the literature.
6.1. Origin of the Flare
The color evolution and the spectroscopic signatures of the flare are not consistent with any known supernova. Supernovae exhibit a much faster color evolution due to cooling in the expanding ejecta and can only remain bright in the UV for a few days. In addition, we do not detect any P-Cygni profile indicative of outflow in the spectra of iPTF16axa.
Although the nuclear position of the flare may connect it to AGN activity, we do not see any evidence of the host galaxy harbouring an active nucleus. First, common AGN lines such as [O iii] and [N ii] are not present in the spectra. Although the Balmer lines Hα and Hβ were detected, the broad Balmer lines have faded almost entirely from 2016 June to September, which indicates the presence of broad Balmer lines is associated with the transient instead of the host galaxy. In fact, in the rare case of a changing-look AGN, we may see broad emission lines in an AGN suddenly appear or disappear on the timescale of a few years (e.g., Shappee et al. 2014; LaMassa et al. 2015; Ruan et al. 2016; Gezari et al. 2017). However, the lack of X-ray emission in iPTF16axa does not support the changing-look AGN scenario. Furthermore, AGNs are known to vary on various timescales across the electromagnetic spectrum. As mentioned in Section 2, the position of iPTF16axa does not have any historical PTF detection signposting AGN activity between 2011 and 2014.
The photometric and spectroscopic properties bear a stronger resemblance to previous events classified as optical TDE candidates. We compare and discuss their temperatures, luminosities, and spectral line ratios in Sections 6.3, 6.5, and 6.4.
6.2. Timescale
We derive the shortest rise time (t0–tD) by setting the derivative of Equation (A2) (in Guillochon & Ramirez-Ruiz 2013) with respect to the impact parameter β to zero. The minimum theoretical timescale implied by a 5 × 10⁶ M⊙ black hole is 63 days for β = 1.9 assuming a γ = 4/3 and a solar-type star. Since the TDE was discovered on the decline, we can only place an upper limit on the rise time derived from the observed light curve. The upper limit on the rise time is Δt < 49 rest-frame days assuming that the peak light occurred some time before the iPTF discovery. This rise time is consistent with a black hole mass of less than 3 × 10⁶ M⊙, which is within the intrinsic scatter (0.38 dex) of the M–σ relation in McConnell & Ma (2013) given in Section 3.1.
6.3. Temperatures
The blackbody temperature of iPTF16axa remained constant (Tbb ∼ 3.0 × 10⁴ K) over the three-month monitoring period. This temperature is similar to what was found in PS1-10jh (Gezari et al. 2012), which was also reported to have constant temperature on the timescale of about a year.
The TDE candidates discovered by GALEX (D1-9, D3-13), which were also detected in the optical with CFHTLS, have higher blackbody temperatures than the other optical TDE candidates in Figure 11. However, the difference is much less significant than the difference between X-ray-detected TDE candidates and optical TDE candidates, where the former is usually one to two orders of magnitude hotter than the latter.

Figure 11. Comparison of the evolution of the blackbody temperature inferred from SED fitting. The blackbody temperatures of the UV/optical TDE candidates remain constant on the order of a few 104 K over time except ASASSN-15oi.
Download figure:
Standard image High-resolution imageTDE candidates found in the ASASSN, ASASSN-14ae, and ASASSN-14li, the SDSS TDEs TDE1 and TDE2, PS1-10jh, PS1-11af, and PTF09ge also have blackbody temperatures that remain roughly constant over months (Figure 11). The only outlier here is ASASSN-15oi, which features an ∼100% increase in blackbody temperature on the timescale of less than a month.
6.4. Helium-to-hydrogen Ratio
Figure 12 shows the integrated Helium-to-Hα line ratio of iPTF16axa and the other TDE candidates discovered in the optical. PS1-10jh, PTF09ge, and ASASSN-15oi do not have Hα emission. A lower limit of 4.7 was reported for PS1-10jh (Gezari et al. 2015), a lower limit of ∼1 was reported for ASASSN-15oi (Holoien et al. 2016a), and we measure a lower limit of 1.9 for PTF09ge from fitting its spectrum obtained from the Double Spectrograph mounted on the Palomar 200-inch (P200) telescope on 2009 May 20.

Figure 12. Comparison of the evolution of the helium-to-hydrogen line ratio inferred from spectral fitting. The x-axis shows the time elapsed since peak (t0) for PTF09ge, PS1-10jh, and iPTF16fnl, and time elapsed since discovery for the ASASSN TDEs and iPTF16axa (MJD 57537.4). The dotted line shows the expected helium-to-hydrogen ratio in a nebular environment assuming the solar abundance of He/H. It is noticed that nebular arguments may not be valid for TDE candidates despite being frequently used in the literature.
Download figure:
Standard image High-resolution imageWe measure the line ratios for ASASSN-14ae and ASASSN-14li by performing Gaussian line fitting on the spectra on the open TDE catalog19 in a similar fashion as described in Section 5.3. The continuum is modeled as a fifth-order Legendre polynomial and subtracted before measuring the lines. ASASSN-14ae did not develop He iiλ4686 until later epochs.
Throughout the spectroscopic epochs, the Hα line was readily detected in iPTF16axa except for the last epoch. iPTF16axa did not show significant Hα suppression as was observed in PS1-10jh and PTF09ge. From Figure 12, the spectroscopic signatures of TDE candidates can be divided into two groups based on the presence/absence of Hα emission. The sources that show both He iiλ4686 and Hα emission appear to have similar He ii/Hα ratios, with the exception of iPTF16fnl near peak, which shows a high He iiλ4686-to-Hα ratio that rapidly evolves to the lower ratio observed in the other sources.
The nebular He iiλ4686 to Hα line ratio can be expressed as

where n(He++) is the density of He++, np is the proton density, ne is the electron density, and is the effective recombination coefficient. For a typical T = 104 K nebular gas, = 3.57 ×10⁻¹³ cm3 s−1, = 3.02 × 10⁻¹⁴ cm3 s−1, and jHα/jHβ is 2.87 (Osterbrock p80). Substituting in these values, the He iiλ4686 to Hα line ratio can be expressed as 3.98 n(He++)/np for an electron density of 102 cm−3 in case B recombination. Assuming the solar helium abundance Y⊙ = 0.2485 (Serenelli & Basu 2010), the number abundance of helium n(He++)/np is ≈0.08. This results in a line ratio of 0.32(), which is denoted by the dotted line in Figure 12.


It is noticed that the nebular arguments, while still commonly used in the literature, are not valid for most of the TDE spectra. Figure 12 demonstrates that all measurements of the helium-to-hydrogen line ratio in TDEs, with the exception of the early epochs of ASASSN-14ae, display a helium enhancement compared to the nebular prediction assuming solar abundance. While stellar composition may be affecting these ratios in some events, this pattern also suggests that nebular arguments along the lines of Equation (5) may break down for TDEs. A likely explanation is that high gas densities (>1010 cm−3) are leading to the suppression of the Balmer lines as these transitions become optically thick. This possibility was first suggested by Bogdanović et al. (2004), and has been recently studied with CLOUDY caclulations (Gaskell & Rojas Lobos 2014; Strubbe & Murray 2015; Saxton et al. 2016) and full radiative transfer calculations (Roth et al. 2016).
6.5. Bolometric Luminosity
Shown in Figure 13 is the time evolution of the UV–optical integrated luminosity of iPTF16axa from the blackbody model. Also shown in this plot are the UV/optical integrated luminosities of ASASSN-14ae, ASASSN-14li, ASASSN-15oi, PS1-10jh, PS1-11af, TDE1, TDE2, D1-9, and D3-13.

Figure 13. Comparison of the evolution of the integrated UV–optical luminosity inferred from SED fitting. The y-axis on the right hand side is the mass accretion rate assuming an efficiency of 0.1. The x-axis shows the time elapsed since peak (t0) for PTF09ge, PS1-10jh, and iPTF16fnl and the time elapsed since discovery for the ASASSN TDEs and iPTF16axa (MJD 57537.4). The two crosses in purple are derived from pre-peak g-band data of iPTF16fnl assuming a blackbody temperature of 2 × 10⁴ K. It is worth noting that all of the UV and optically detected TDE candidates discussed here follow a t−5/3 power-law decay except iPTF16fnl. These TDE candidates span a narrow range in the peak luminosity log(L [erg s−1]) = 43.4–44.4.
Download figure:
Standard image High-resolution imageIn Figure 13, all of the TDE candidates except iPTF16fnl follow a power-law decline with a decline rate more or less consistent with t−5/3. It is also interesting that, based on our blackbody fit, all of these TDEs except iPTF16fnl are confined to a small range of luminosities, with the peak luminosities ranging from log(L [erg s−1]) = 43.4–44.4. We must caution, however, that a substantial fraction of the total radiated energy, especially if originally emitted at FUV and EUV wavelengths, may be missing in our observations, as was demonstrated by van Velzen et al. (2016b) in the case of PTF09ge based on infrared light echo observations.
6.6. Photospheric Radius
Figure 14 shows the evolution of blackbody radius for iPTF16axa and other optically bright TDE candidates. The blackbody radius of iPTF16axa decreased steadily from 4 × 10¹⁴ to 2 × 1014 cm as the luminosity decreases with time. The blackbody radius of PS1-10jh is derived assuming a t−5/3 decay in luminosity and constant temperature. Since the tidal radius is weakly dependent on the black hole mass (), Figure 14 shows that the derived radii are at least 10 times farther away from the RT for all the TDE candidates.


Figure 14. Comparison of the evolution of the blackbody radius (Rbb) inferred from SED fitting. The dots in the figure represent Rbb derived from the SED some time after discovery for iPTF16axa and the ASASSN objects. The pink shaded area shows the uncertainties of Rbb for iPTF16axa. The blackbody radii derived are on the order of a few tens times the tidal radius.
Download figure:
Standard image High-resolution imageDue to the non-varying temperature evolution of TDE emission, the photospheric radius must decline at late times in order to match the fading light curve. The physical meaning of this decline remains unclear. One explanation is that the density of the optically emitting gas drops over time, allowing the observer to see light emitted from increasingly deeper regions, even if the gas is continuously outflowing (Strubbe & Murray 2015). Another possibility is that the optically emitting gas is in fact moving closer to the black hole over time, and may be related to the decreasing apocenter radius of the circularizing debris stream (Bonnerot et al. 2017).
6.7. Virial Radius
The FWHMs of He iiλ4686 and Hα are plotted in Figure 15. The triangles denote the linewidths of He iiλ4686 lines, while the dots denote the linewidths of Hα emission. The He iiλ4686 linewidths for ASASSN-14ae and ASASSN-14li were measured using the spectra on the open TDE catalog. The He iiλ4686 linewidth of PTF09ge is measured from its P200 spectrum and the value for PS1-10jh is provided in Gezari et al. (2012).

Figure 15. Comparison of the evolution of the photosphere radius inferred from emission linewidths. The triangles mark the linewidths of He iiλ4686 lines, while the dots mark the linewidths of Hα emission. The y-axis on the right hand side shows the photospheric radii in units of the gravitational radius rg = GM/c2. Throughout the monitoring period, the FWHM of Hα and He iiλ4686 evolve in a similar trend. The fact that the He iiλ4686 line is not wider than Hα disfavors the scenario of a stratified BLR region that is virially bound.
Download figure:
Standard image High-resolution imageIn Figure 15, the FWHMs of He ii and Hα emission lines evolve in the same trend. Throughout the observations of iPTF16axa, the He iiλ4686 linewidth remains comparable, sometimes even narrower, than the linewidths of Hα. The fact that the linewidths of He ii are not wider than that of Hα suggests that the line emitting material is not virially bound. In the scenario of a stratified broad line region, because the photoionization energy of He is higher than hydrogen, helium has to be emitted at a smaller radius and therefore would have a wider linewidth. As pointed out in Holoien et al. (2016a, 2016b), in reverberation mapping studies, the linewidths would increase while the luminosity decreases due to recombination at outer radii. This trend is also not observed until the last epoch when the line detection was weak.
6.8. Peak Luminosity
In Figure 16, we plot the peak luminosity reported in the literature as a function of the black hole mass. The circle symbols show black hole masses reported in the literature while the diamond symbols show black hole masses estimated from the r-band scaling relation in Tundo et al. (2007), which has a 1σ scatter of 0.33 dex. We obtain the black hole mass of ASASSN-14ae from Holoien et al. (2014), ASASSN-14li from Holoien et al. (2016b), ASASSN-15oi from Holoien et al. (2016a), PS1-11af from Chornock et al. (2014), PTF09ge from Arcavi et al. (2014), D1-9 and D3-13 from Gezari et al. (2009), and TDE1 and TDE2 from van Velzen et al. (2011).

Figure 16. Peak luminosities for TDEs from Figure 13 vs. black hole masses. Black hole masses obtained from the literature are marked by circles, while triangles represent black hole masses derived using r-band scaling in Tundo et al. (2007). The dotted lines show the luminosities that correspond to four different Eddington ratios, while the black dashed line shows the relation expected from theoretical work normalized to Equation A1 in Guillochon & Ramirez-Ruiz (2013) with γ = 4/3, β = 1, and = 0.1. Below MBH ∼ 106.6 M⊙, the luminiosity should be Eddington limited and scales proportionally with MBH.

Download figure:
Standard image High-resolution imageWe show four different ratios of Eddington luminosity, LEdd, 0.1 LEdd, 10−2 LEdd, and 10−3 LEdd, as a function of the black hole mass with the black dotted lines. The black dashed line in Figure 16 shows the theoretical scaling of (Lodato & Rossi 2011; Guillochon & Ramirez-Ruiz 2013) normalized to Equation (A1) in Guillochon & Ramirez-Ruiz (2013) assuming a star with solar mass and radius, γ = 4/3, β = 1, and an accretion efficiency of 0.1. The dashed line does not extend below MBH ∼ 106.6 M⊙ since the emergent luminosity should be Eddington limited. Below this threshold, the luminosity scales with the Eddington luminosity, Lpeak ∝ LEdd ∝ MBH. We do not see a clear trend in the data that suggests the peak luminosity and the black hole mass are correlated, though we emphasize again that undetected emission originally at FUV and EUV wavelengths may alter this conclusion and that many of the TDE candidates plotted were discovered post-peak, and thus their luminosity at discovery may be underestimating the true peak luminosity.

7. Conclusion
We present results from photometric and spectroscopic follow-up observations of a strong TDE candidate, iPTF16axa, and comparisons of the derived physical quantities with 11 other optically studied TDE candidates from ASASSN, GALEX+CFHTLS, PTF, PS1, and SDSS. Both Swift UVOT observations and the follow-up spectra of iPTF16axa are consistent with the object being a TDE rather than a supernova or a variable AGN. The UV and optical light curves of iPTF16axa are in good agreement with the t−5/3 relation and suggest the TDE was discovered 49 rest-frame days after disruption. The light curve shows no color evolution with time, with an SED fitted with a constant temperature of 3 × 10⁴ K. The TDE is hosted by an early-type galaxy with an estimated black hole mass of 5 × 10⁶ M⊙, which is similar to previously reported TDE candidate hosts. We summarize the comparisons of a sample totaling 12 TDE candidates including iPTF16axa below.
- 1.TDE candidates discovered in the UV and optical maintain roughly constant temperature over several months. The blackbody temperatures of the TDE candidates are found to be a few 104 K.
- 2.Our sample of TDE candidates are characterized by a power-law decline and, based on a blackbody fit to optical and near-UV data, span a small range of peak luminosity of 1043.4 < Lpeak < 1044.4. The decline is more or less consistent with the classic t−5/3 prediction except in iPTF16fnl, which fades more steeply than the other TDE candidates discussed in this paper.
- 3.Nebular arguments are not valid for interpreting line ratios in most optically discovered TDE candidates due to the presence of high-density gas, which can lead to the suppression of hydrogen Balmer transitions. The spectra of UV/optical TDE candidates show a range of He-to-Hα ratios, and the time evolution of these ratios also differs between events. Detailed modeling will be necessary to understand these behaviors.
- 4.The blackbody radii derived from the SEDs of UV/optical TDE candidates trace distances that are much larger than the tidal radius (≈a few 10 RT) and that decline with time.
- 5.The FWHM of He iiλ4686 is consistent with the FWHM of Hα in the optical spectra of UV/optical TDE candidates. This evidence contradicts the assumption of a stratified BLR.
- 6.Theoretical work shows that the peak luminosity and the black hole mass are correlated by except at smaller black hole masses, where the emission is Eddington-capped (Lpeak ∝ MBH). However, there is no strong trend between the two quantities in the sample of candidate TDEs discovered in UV and optical.

We thank the anonymous referee for helpful comments regarding the manuscript. T.H. thanks T. Holoien and C. Bonnerot for providing data from their papers. S.G. is supported in part by NSF CAREER grant 1454816, NASA Swift Cycle 12 grant NNX16AN85G, and NASA Keck Grant 1568615. N.R. acknowledges the support of a Joint Space-Science Institute prize postdoctoral fellowship. A.H. acknowledges the support of a grant from the I-CORE program "From the Big Bang to Planets." Support for I.A. was provided by NASA through the Einstein Fellowship Program, grant PF6-170148. These results made use of the Discovery Channel Telescope at Lowell Observatory. Lowell is a private, non-profit institution dedicated to astrophysical research and public appreciation of astronomy and operates the DCT in partnership with Boston University, the University of Maryland, the University of Toledo, Northern Arizona University, and Yale University. The W. M. Keck Observatory is operated as a scientific partnership among the California Institute of Technology, the University of California, and NASA; the Observatory was made possible by the generous financial support of the W. M. Keck Foundation. This research used resources of the National Energy Research Scientific Computing Center, a DOE Office of Science User Facility supported by the Office of Science of the U.S. Department of Energy under Contract No. DE-AC02-05CH11231.
Appendix:
All photometry data are presented in Table A1, which are shown in the AB system. Host contribution has been removed from the optical data observed with P48, P60, and LCO, using co-added PTF images and SDSS images as references. The Swift UV data are not host-subtracted. We do not correct for Galactic extinction for values shown in this table.
Table A1. Photometric Data of iPTF16axa
| MJD | Magnitude | Filter | Telescope |
|---|---|---|---|
| 57546.189 | 19.110 ± 0.050 | UVW2 | Swift |
| 57551.232 | 19.070 ± 0.060 | UVW2 | Swift |
| 57556.824 | 19.350 ± 0.070 | UVW2 | Swift |
| 57571.634 | 19.920 ± 0.090 | UVW2 | Swift |
| 57576.485 | 20.040 ± 0.100 | UVW2 | Swift |
| 57585.937 | 19.920 ± 0.110 | UVW2 | Swift |
| 57592.583 | 20.220 ± 0.160 | UVW2 | Swift |
| 57594.428 | 19.870 ± 0.060 | UVW2 | Swift |
| 57599.095 | 20.120 ± 0.080 | UVW2 | Swift |
| 57607.999 | 20.300 ± 0.080 | UVW2 | Swift |
| 57613.241 | 20.380 ± 0.070 | UVW2 | Swift |
| 57620.542 | 20.470 ± 0.090 | UVW2 | Swift |
| 57551.236 | 19.250 ± 0.070 | UVM2 | Swift |
| 57556.828 | 19.500 ± 0.070 | UVM2 | Swift |
| 57571.637 | 19.980 ± 0.090 | UVM2 | Swift |
| 57576.487 | 20.070 ± 0.100 | UVM2 | Swift |
| 57587.593 | 20.110 ± 0.110 | UVM2 | Swift |
| 57592.586 | 20.450 ± 0.250 | UVM2 | Swift |
| 57594.436 | 20.060 ± 0.100 | UVM2 | Swift |
| 57599.099 | 20.160 ± 0.160 | UVM2 | Swift |
| 57608.002 | 20.640 ± 0.130 | UVM2 | Swift |
| 57613.248 | 20.550 ± 0.120 | UVM2 | Swift |
| 57620.546 | 20.740 ± 0.150 | UVM2 | Swift |
| 57551.230 | 19.320 ± 0.090 | UVW1 | Swift |
| 57556.820 | 19.500 ± 0.100 | UVW1 | Swift |
| 57561.391 | 19.650 ± 0.160 | UVW1 | Swift |
| 57571.630 | 19.780 ± 0.120 | UVW1 | Swift |
| 57576.483 | 20.320 ± 0.180 | UVW1 | Swift |
| 57585.933 | 19.910 ± 0.170 | UVW1 | Swift |
| 57592.581 | 20.020 ± 0.230 | UVW1 | Swift |
| 57594.422 | 20.500 ± 0.140 | UVW1 | Swift |
| 57599.092 | 20.190 ± 0.130 | UVW1 | Swift |
| 57607.997 | 20.430 ± 0.140 | UVW1 | Swift |
| 57613.235 | 20.430 ± 0.130 | UVW1 | Swift |
| 57620.538 | 20.740 ± 0.190 | UVW1 | Swift |
| 57551.231 | 19.300 ± 0.140 | UVOT-U | Swift |
| 57556.822 | 19.410 ± 0.150 | UVOT-U | Swift |
| 57571.632 | 19.950 ± 0.220 | UVOT-U | Swift |
| 57576.484 | 20.090 ± 0.250 | UVOT-U | Swift |
| 57585.935 | 19.820 ± 0.220 | UVOT-U | Swift |
| 57587.587 | 19.820 ± 0.130 | UVOT-U | Swift |
| 57594.425 | 19.940 ± 0.130 | UVOT-U | Swift |
| 57599.093 | 20.220 ± 0.190 | UVOT-U | Swift |
| 57607.998 | 20.170 ± 0.170 | UVOT-U | Swift |
| 57613.238 | 20.220 ± 0.150 | UVOT-U | Swift |
| 57620.540 | 20.140 ± 0.200 | UVOT-U | Swift |
| 57537.397 | 19.486 ± 0.071 | g | P48 |
| 57540.404 | 19.615 ± 0.032 | g | P60 |
| 57541.428 | 19.592 ± 0.031 | g | P60 |
| 57544.370 | 19.464 ± 0.081 | g | P48 |
| 57547.399 | 19.724 ± 0.027 | g | P60 |
| 57548.385 | 19.626 ± 0.085 | g | P48 |
| 57548.510 | 20.119 ± 0.137 | gp | LCO |
| 57552.373 | 19.673 ± 0.103 | g | P48 |
| 57554.378 | 19.959 ± 0.042 | g | P60 |
| 57555.590 | 20.579 ± 0.157 | gp | LCO |
| 57558.469 | 20.192 ± 0.127 | g | P60 |
| 57565.219 | 20.165 ± 0.076 | g | P60 |
| 57566.220 | 20.284 ± 0.027 | g | P60 |
| 57574.502 | 20.918 ± 0.108 | gp | LCO |
| 57581.465 | 20.931 ± 0.122 | gp | LCO |
| 57583.261 | 20.611 ± 0.053 | g | P60 |
| 57585.194 | 20.749 ± 0.070 | g | P60 |
| 57587.193 | 20.699 ± 0.105 | g | P60 |
| 57587.472 | 20.612 ± 0.274 | gp | LCO |
| 57593.234 | 20.736 ± 0.048 | g | P60 |
| 57595.182 | 20.771 ± 0.048 | g | P60 |
| 57595.453 | 21.310 ± 0.278 | gp | LCO |
| 57597.239 | 20.883 ± 0.056 | g | P60 |
| 57599.197 | 20.875 ± 0.046 | g | P60 |
| 57601.183 | 20.947 ± 0.081 | g | P60 |
| 57605.213 | 21.041 ± 0.048 | g | P60 |
| 57607.176 | 20.995 ± 0.052 | g | P60 |
| 57609.177 | 21.011 ± 0.057 | g | P60 |
| 57611.196 | 21.079 ± 0.067 | g | P60 |
| 57613.173 | 21.038 ± 0.100 | g | P60 |
| 57614.180 | 21.261 ± 0.141 | g | P60 |
| 57615.168 | 21.221 ± 0.177 | g | P60 |
| 57616.166 | 21.111 ± 0.113 | g | P60 |
| 57617.169 | 20.903 ± 0.181 | g | P60 |
| 57618.150 | 21.329 ± 0.191 | g | P60 |
| 57619.156 | 20.976 ± 0.143 | g | P60 |
| 57621.150 | 21.160 ± 0.120 | g | P60 |
| 57625.158 | 21.203 ± 0.049 | g | P60 |
| 57631.152 | 21.218 ± 0.071 | g | P60 |
| 57633.166 | 21.297 ± 0.063 | g | P60 |
| 57635.135 | 21.356 ± 0.138 | g | P60 |
| 57639.227 | 21.413 ± 0.093 | g | P60 |
| 57646.190 | 21.328 ± 0.330 | g | P60 |
| 57656.182 | 21.536 ± 0.277 | g | P60 |
| 57540.397 | 20.045 ± 0.033 | r | P60 |
| 57541.421 | 19.972 ± 0.054 | r | P60 |
| 57547.392 | 20.090 ± 0.029 | r | P60 |
| 57548.514 | 19.999 ± 0.391 | rp | LCO |
| 57551.451 | 20.162 ± 0.030 | r | P60 |
| 57554.368 | 20.235 ± 0.074 | r | P60 |
| 57558.459 | 20.404 ± 0.106 | r | P60 |
| 57559.483 | 20.401 ± 0.260 | r | P60 |
| 57565.198 | 20.527 ± 0.127 | r | P60 |
| 57566.205 | 20.661 ± 0.029 | r | P60 |
| 57569.229 | 20.711 ± 0.040 | r | P60 |
| 57574.512 | 20.543 ± 0.283 | rp | LCO |
| 57581.474 | 20.671 ± 0.297 | rp | LCO |
| 57583.255 | 21.020 ± 0.087 | r | P60 |
| 57585.188 | 21.149 ± 0.113 | r | P60 |
| 57587.188 | 21.025 ± 0.144 | r | P60 |
| 57587.480 | 20.580 ± 0.339 | rp | LCO |
| 57593.228 | 21.063 ± 0.068 | r | P60 |
| 57595.176 | 21.241 ± 0.102 | r | P60 |
| 57595.462 | 20.603 ± 0.342 | rp | LCO |
| 57597.234 | 21.213 ± 0.100 | r | P60 |
| 57599.191 | 21.086 ± 0.077 | r | P60 |
| 57605.207 | 21.280 ± 0.069 | r | P60 |
| 57607.170 | 21.380 ± 0.105 | r | P60 |
| 57609.171 | 21.317 ± 0.124 | r | P60 |
| 57611.191 | 21.267 ± 0.108 | r | P60 |
| 57613.167 | 21.377 ± 0.150 | r | P60 |
| 57614.175 | 21.320 ± 0.171 | r | P60 |
| 57616.161 | 21.284 ± 0.212 | r | P60 |
| 57617.163 | 21.155 ± 0.244 | r | P60 |
| 57621.144 | 21.398 ± 0.170 | r | P60 |
| 57625.153 | 21.358 ± 0.107 | r | P60 |
| 57629.148 | 21.478 ± 0.091 | r | P60 |
| 57631.146 | 21.474 ± 0.160 | r | P60 |
| 57633.161 | 21.464 ± 0.113 | r | P60 |
| 57637.139 | 21.650 ± 0.226 | r | P60 |
| 57639.222 | 21.634 ± 0.180 | r | P60 |
| 57640.182 | 21.489 ± 0.096 | r | P60 |
| 57646.151 | 21.640 ± 0.356 | r | P60 |
| 57656.140 | 21.896 ± 0.527 | r | P60 |
| 57540.401 | 19.901 ± 0.045 | i | P60 |
| 57541.424 | 19.827 ± 0.050 | i | P60 |
| 57547.395 | 19.891 ± 0.054 | i | P60 |
| 57548.527 | 20.046 ± 0.378 | ip | LCO |
| 57551.456 | 20.041 ± 0.052 | i | P60 |
| 57554.373 | 20.063 ± 0.118 | i | P60 |
| 57555.599 | 19.796 ± 0.357 | ip | LCO |
| 57558.464 | 20.171 ± 0.143 | i | P60 |
| 57565.202 | 20.408 ± 0.356 | i | P60 |
| 57574.519 | 20.586 ± 0.311 | ip | LCO |
| 57581.482 | 20.642 ± 0.326 | ip | LCO |
| 57583.258 | 20.633 ± 0.127 | i | P60 |
| 57585.191 | 20.615 ± 0.093 | i | P60 |
| 57587.191 | 20.881 ± 0.144 | i | P60 |
| 57587.489 | 20.537 ± 0.462 | ip | LCO |
| 57593.231 | 20.829 ± 0.082 | i | P60 |
| 57595.179 | 20.879 ± 0.143 | i | P60 |
| 57595.470 | 20.747 ± 0.408 | ip | LCO |
| 57597.237 | 20.769 ± 0.101 | i | P60 |
| 57599.194 | 21.000 ± 0.101 | i | P60 |
| 57605.210 | 21.116 ± 0.089 | i | P60 |
| 57607.173 | 20.975 ± 0.125 | i | P60 |
| 57609.174 | 21.109 ± 0.114 | i | P60 |
| 57611.194 | 21.012 ± 0.223 | i | P60 |
| 57613.170 | 20.974 ± 0.163 | i | P60 |
| 57616.163 | 21.030 ± 0.189 | i | P60 |
| 57617.166 | 21.165 ± 0.286 | i | P60 |
| 57625.156 | 21.086 ± 0.125 | i | P60 |
| 57631.149 | 21.146 ± 0.141 | i | P60 |
| 57633.164 | 21.111 ± 0.155 | i | P60 |
| 57639.224 | 21.417 ± 0.244 | i | P60 |
| 57646.171 | 21.199 ± 0.256 | i | P60 |
| 57656.163 | 21.213 ± 0.276 | i | P60 |
Footnotes
- 16
- 17
- 18
- 19