


Abstract
A study has been conducted of 12C/13C ratios in five complex molecules in the Galactic center. H2CS, CH3CCH, NH2CHO, CH2CHCN, and CH3CH2CN and their 13C-substituted species have been observed in numerous transitions at 1, 2, and 3 mm, acquired in a spectral-line survey of Sgr B2(N), conducted with the telescopes of the Arizona Radio Observatory (ARO). Between 22 and 54 individual, unblended lines for the 12C species and 2–54 for 13C-substituted analogs were modeled in a global radiative transfer analysis. All five molecules were found to consistently exhibit two velocity components near VLSR ∼ 64 and 73 km s−1, with column densities ranging from Ntot ∼ 3 × 10¹⁴ − 4 × 1017 cm−2 and ∼2 × 10¹³ − 1 × 1017 cm−2 for the 12C and 13C species, respectively. Based on 14 different isotopic combinations, ratios were obtained in the range 12C/13C = 15 ± 5 to 33 ± 13, with an average value of 24 ± 7, based on comparison of column densities. These measurements better anchor the 12C/13C ratio at the Galactic center, and suggest a slightly revised isotope gradient of 12C/13C = 5.21(0.52) DGC + 22.6(3.3). As indicated by the column densities, no preferential 13C enrichment was found on the differing carbon sites of CH3CCH, CH2CHCN, and CH3CH2CN. Because of the elevated temperatures in Sgr B2(N), 13C isotopic substitution is effectively "scrambled," diminishing chemical fractionation effects. The resulting ratios thus reflect stellar nucleosynthesis and Galactic chemical evolution, as is likely the case for most warm clouds.
Export citation and abstract BibTeX RIS
1. Introduction
The 12C/13C isotope ratio is considered to be an important tracer of Galactic chemical evolution (GCE) because it reflects the relative degree of primary to secondary processing in stars (e.g., Chiappini & Matteucci 2001). Carbon-12 is predicted to be formed in the triple-alpha process, which fuses three He nuclei together (Timmes et al. 1995). It is thought that about 50% of 12C comes from massive stars (M > 10 M⊙,) that evolve through core-collapse to become Type II supernovae (SNe II); the remaining half is from asymptotic giant branch (AGB) stars, which are intermediate mass (1–8 M⊙) and spew out 12C during the "third dredge-up." Carbon-13, on the other hand, is a reaction intermediate in the carbon-nitrogen-oxygen (CNO) cycle, which occurs in red giants (e.g., Pagel 1997). Carbon-13 is postulated to be brought to the surface during the first and, for stars with M > 4 M⊙, the second dredge-up, and is subsequently injected into the interstellar medium (ISM) (Herwig 2005). Because AGB stars have long evolutionary timescales relative to the age of the Galaxy, it is thought that the 13C contribution to the ISM is delayed from the initial Galactic epochs. Furthermore, star formation tracks the regions of highest gas density, which occurs in the Galactic center and decreases radially. Therefore, according to GCE models, the 12C/13C ratio should increase with Galactocentric distance caused by a gradual enrichment of 13C with the cycling of stellar material of all masses over the lifetime of the Galaxy (e.g., Prantzos et al. 1996).
Because of its use as a constraint of GCE, observations of the 12C/13C ratio across the Galaxy have been conducted for decades toward molecular clouds (e.g., Gardner & Whiteoak 1979; Penzias 1980; Henkel et al. 1983; Langer & Penzias 1990; Wilson & Rood 1994). The most common methods of measuring the ratio is to compare the line intensities of rotational lines of the carbon-12 and carbon-13 isotopologues of common molecules, such as CO, H2CO, and HCO+, measured by millimeter-wave astronomy. Unlike optical measurements of isotope ratios (e.g., Ritchey et al. 2011), the rotational transitions of the carbon isotopologues are well-separated in frequency. However, favorable transitions of very abundant molecules are often saturated, and therefore relative line intensities are not necessarily an accurate indicator of isotope ratios (e.g., Langer & Penzias 1990). In the past, this problem has been dealt with using molecular line modeling or double isotope ratios. More recently, CN has been used to assess this ratio because its distinct hyperfine pattern allows the opacity to be accurately evaluated (Milam et al. 2005). Possible effects of chemical fractionation may also be influencing 12C/13C ratios, arising from relative zero-point energy differences in bonds to the two isotopes.
Millimeter rotational measurements of CO, H2CO, and CN taken over a period of several decades indicate that the 12C/13C ratio steadily increases with distance from the Galactic center (e.g., Wilson & Rood 1994; Milam et al. 2005). However, the temporal and spatial behavior of the 12C/13C ratio predicted by models adopting the standard nucleosynthesis are flatter than observations (Prantzos et al. 1996). This discrepancy has led theorists to postulate that novae (white dwarfs in binary systems) are important producers of 13C, which is circulated back to the ISM on longer timescales. In addition, new carbon-13 yields for low-mass stars with cool bottom processing have been invoked (Chiappini & Matteucci 2001). However, one factor that strongly influences the proposed Galactic gradient is the ratio measured toward the Galactic center. Note that 12C/13C measurements are typically performed at DGC > 2 kpc, and those done near the Galactic center are subject to self-reversal, a complex source structure, and intervening material along the line of sight (see Figure 2 of Milam et al. 2005). Therefore, the present gradient based on observations may be skewed, necessitating more accurate measurements of the 12C/13C ratio toward the Galactic center.
Not all measurements of 12C/13C ratios are suitable for Galactic gradient determinations, however. In cold, dark clouds, such as TMC-1 and L1527, carbon isotope anomalies have been observed in various long-chain molecules, e.g., HC3N, C4H, and C3S (e.g., Sakai et al. 2013; Araki et al. 2016). Differing 12C/13C ratios are obtained, depending on the carbon atom. For example, in HC3N, the 12C/13C ratio is ∼85–86 if the two acetylenic carbons are considered, but the value decreases to ∼64 for the CN moiety. These varying ratios are attributed to gas-phase chemical fractionation in formation processes, and require low temperatures near T ∼ 10 K, as found in the starless cores in sources like TMC-1 (e.g., Araki et al. 2016). In Orion-KL, the 12C/13C ratios for HC3N and its isotopologues vary greatly depending on the carbon atom and on the region of the cloud. These values range from 3–17 in the hot core to 27–80 in the extended ridge (Esplugues et al. 2013). In both the extended ridge and plateau, H13CCCN had a 12C/13C ratio lower by about a factor of three compared to the other isotopologues. The reason for these unusual variations is unknown, although underestimation of the optical depth of the emission could be a factor.
In an effort to evaluate the abundances of organic molecules toward the Galactic center, we conducted a spectral-line survey of Sgr B2(N), using the facilities of the Arizona Radio Observatory (ARO). This source is exemplified by high densities (>107 cm−3 ) and temperatures (>100 K), and has at least two distinct compact cores with differing LSR velocities, one near 64 km s−1 (Sgr B2(N1)) and the other near 73 km s−1 (Sgr B2(N2); e.g., Schmiedke et al. 2016). This survey encompasses both cores, covers the majority of the 1, 2, and 3 mm atmospheric windows (160 GHz total), and was carried out at the spectral-line confusion limit. This work varies from that of Belloche et al. (2013), conducted with the IRAM 30 m, because it has 2.5 times the spectral coverage, including the 4 mm band and most of the 2 and 1 mm bands. The wide spectral coverage, although not always necessary for many projects, has enabled a large number of transitions to be measured in five lower abundance molecules, allowing an accurate evaluation of 12C/13C ratios.
The measurement of this ratio in Sgr B2(N) has been a topic of interest for years, and in particular for recent studies. For example, Müller et al. (2016) found a 12C/13C ratio of ∼25 for both methanol and singly substituted ethanol toward Sgr B2(N2), using the Atacama Large Millimeter Array (ALMA). Also from ALMA data, Belloche et al. (2016) estimated a ratio of ∼21 from CH3CN, based on both carbon atoms, and the value of ∼32 from ethyl cyanide considering all three carbon-substitutions, for Sgr B2(N2). From IRAM data, Belloche et al. found 12C/13C ∼ 30 from C2H5CN, based on all three 13C-substitutions, considering both hot cores. An intensive ALMA study of ethyl cyanide, including both singly substituted and doubly substituted 13C isotopologues, by Margulès et al. (2016), suggested a 12C/13C ratio near ∼25 for Sgr B2(N2).
In this paper, we present our 12C/13C ratio measurements toward Sgr B2(N) from our single-dish survey. We discuss their implications for GCE, as well as possible consequences for isotopologue chemistry in hot cores of molecular clouds.
2. Observations
The data were obtained as part of a spectral-line survey of the 1, 2, and 3 mm windows toward Sgr B2(N). These spectra were recorded during the period 2002 September to 2013 April using the Arizona Radio Observatory (ARO) 12 m telescope on Kitt Peak and the Submillimeter Telescope (SMT) on Mt. Graham. At the 12 m, the detectors were millimeter-wave receivers using dual-polarization, SIS mixers, which cover the 3 and 2 mm bands (68–116 and 130–172 GHz). These mixers were operated in single-sideband (SSB) mode with typical image sideband rejection of ≥18 dB. The temperature scale was established using the chopper wheel method, corrected for forward spillover losses, and is given as  . The radiation temperature
  , assuming the source fills only the main beam, is
  , where
  is the main-beam efficiency corrected for forward spillover losses. A millimeter-wave autocorrelator (MAC) backend was employed for these measurements with either 390 kHz or 781 kHz resolution and 600 MHz bandwidth per polarization. The spectra were smoothed using a cubic spline routine to a 1 MHz resolution.
At the SMT, data were obtained in the 210–280 GHz (1 mm) range with a dual-polarization receiver that employs ALMA Band 6 sideband-separating (SBS) mixers, typically with image rejection ≥16 dB. The temperature scale is given as  , and the radiation temperature
  is
is  , where
  is the main-beam efficiency. A 1 MHz resolution filter bank with 2048 channels was the spectrometer backend, configured in parallel mode (2 × 1024).
The beam size ranged from 92'' to 37'' at the 12 m and 32'' to 27'' at the SMT; see Table 1. All observations were conducted toward Sgr B2(N) (α = 17h44m09 5; δ = −28°21'20''; B1950.0, or α = 17h47m192; δ = −28°22'22''; J2000.0: NED http://ned.ipac.caltech.edu/forms/calculator.html) in position-switching mode with a +30' OFF position in azimuth. Any image contamination was identified using a 10–20 MHz local oscillator shift and direct observation of the image sideband. The pointing accuracy was ±5''–10'' at the 12 m and ±1''–2'' at the SMT. The telescope pointing was determined by observations of planets.
Table 1. Modeling Results for Observed Molecules
| Species | Transitions Detected |
 Range (cm−1) Range (cm−1) |
 (km s−1) (km s−1) |
 (km s−1) (km s−1) |
θsa (arcsec) | Trot (K) | Ntot (cm−2) |
|---|---|---|---|---|---|---|---|
| H2CS | 54 | 1–252 | 14.0a | 63.4 | b | 71 ± 19 | 6.9 ± 1.8 × 10¹⁴ |
| 54 | 1–252 | 14.0a | 73.0a | b | 75b | 2.8 ± 0.8 × 10¹⁴ | |

|
2 | 12–20 | 14.0a | 64.0a | b | 88 ± 19 | 3.7 ± 0.8 × 10¹³ |
| 2 | 12–20 | 14.0a | 73.0a | b | 86 ± 18 | 1.9 ± 0.4 × 10¹³ | |
| CH3CCH | 28 | 3–113 | 10.0a | 63.0 | b | 59 ± 13 | 2.2 ± 0.5 × 10¹⁵ |
| 28 | 3–113 | 10.0a | 73.0a | b | 68 ± 14 | 1.5 ± 0.3 × 10¹⁵ | |
| 13CH3CCH | 3 | 5–26 | 10.0a | 64.0a | b | 72 ± 12 | 9.1 ± 1.5 × 10¹³ |
| 3 | 5–26 | 10.0a | 73.0a | b | 72 ± 12 | 8.3 ± 1.4 × 10¹³ | |
| CH3C13CH | 4 | 8–53 | 10.0a | 64.0a | b | 74 ± 13 | 1.1 ± 0.2 × 10¹⁴ |
| 4 | 8–53 | 10.0a | 73.0a | b | 74 ± 13 | 6.8 ± 1.2 × 10¹³ | |
| NH2CHO | 22 | 0–83 | 10.0a | 63.0 | 45.0 | 150 ± 26 | 3.1 ± 0.5 × 10¹⁵ |
| 22 | 0–83 | 10.0a | 73.0a | 45.0 | 148 ± 26 | 1.6 × 10¹⁵a | |

|
16 | 4–57 | 10.0a | 64.0a | 45.0 | 150 ± 41 | 1.2 ± 0.3 × 10¹⁴ |
| 16 | 4–57 | 10.0a | 73.0a | 45.0 | 150 ± 41 | 5.2 ± 1.4 × 10¹³ | |
| 13CH2CHCN | 42 | 13–296 | 10.4 | 63.1 | 1.0 | 80 ± 29 | 6.9 ± 2.5 × 10¹⁶ |
| 42 | 13–296 | 10.0a | 73.0a | 1.0 | 80 ± 29 | 1.2 ± 0.4 × 10¹⁶ | |

|
21 | 10–312 | 9.3 | 62.4 | 1.0 | 80 ± 17 | 8.6 ± 1.9 × 10¹⁶ |
| 21 | 10–312 | 10.0a | 73.0a | 1.0 | 80 ± 17 | 3.3 ± 0.7 × 10¹⁶ | |
| CH2CH13CN | 30 | 13–198 | 9.5 | 64.0 | 1.0 | 80 ± 27 | 1.3 ± 0.4 × 10¹⁷ |
| 30 | 13–198 | 10.0a | 73.0a | 1.0 | 80 ± 27 | 2.2 ± 0.8 × 10¹⁶ | |
| CH3CH2CN | 53 | 9–303 | 12.0a | 64.0a | 3.0 | 86 ± 28 | 4.1 ± 1.3 × 10¹⁷ |
| 53 | 9–303 | 12.0a | 73.0a | 3.0 | 86 ± 27 | 2.5 × 10¹⁷a | |
| 13CH3CH2CN | 54 | 9–141 | 12.0a | 60.1 | 3.0 | 90 ± 24 | 1.9 ± 0.5 × 10¹⁶ |
| 54 | 9–141 | 12.0a | 73.0a | 3.0 | 91 ± 24 | 1.2 ± 0.3 × 10¹⁶ | |

|
47 | 11–139 | 12.0a | 61.9 | 3.0 | 85 ± 20 | 1.2 ± 0.3 × 10¹⁶ |
| 47 | 11–139 | 12.0a | 73.0a | 3.0 | 86 ± 20 | 1.0 ± 0.2 × 10¹⁶ | |

|
52 | 9–183 | 12.8 | 61.3 | 3.0 | 87 ± 24 | 1.4 ± 0.4 × 10¹⁶ |
| 52 | 9–183 | 12.0a | 73.0a | 3.0 | 85 ± 23 | 8.8 ± 2.4 × 10¹⁵ |
Notes.
aHeld fixed in fit. bSource fills telescope beam.Download table as: ASCIITypeset image
3. Results and Analysis
3.1. Overview of Molecules Studied
The five molecules chosen for this investigation, H2CS, CH3CCH, NH2CHO, CH2CHCN, and CH3CH2CN, contain carbon in differing functional groups. Table 1 summarizes the carbon isotopologues studied, the number of transitions detected (22–54 lines for the 12C species and 2–54 for 13C-substituted), the energy range of the lower state levels, typical line widths and LSR velocities, and the average rotational temperature and column density. As the table shows, each molecule exhibits two distinct velocity components near 62–64 (hot core Sgr B2(N1)) and 73 km s−1 (hot core Sgr B2(N2)) with typical line widths of 9–14 km s−1. Additional details will be given in a later paper on the entire survey.
A representative sample of the observational data is given in Table 2, which lists the complete data set for H2CS and  . For H2CS, 33 lines were observed that were uncontaminated; these transitions are shown in the table. The rest frequency, the upper state energy (Eu), and the product of the square of the dipole moment μ with the line strength (μ2S) of the transition are also given, along with the beam efficiency (ηc at 2 and 3 mm and ηb at 1 mm) and telescope beam size. The line temperature (
 at 2 and 3 mm and
  at 1 mm), line width ΔV1/2, and source velocity VLSR are also given for each velocity component. At 3 mm in wavelength, these components are usually blended, producing a line with a width of ∼20 km s−1. At 2 and 1 mm, the two components usually generate a distinct profile with a prominent feature at 64 km s−1 and a weaker "shoulder" near 73 km s−1.
Table 2.
Representative Data: Observations of H2CS and  in Sgr B2(N)
| Species | Transition 
|
Frequency (MHz) |
 (K) (K) |
μ2S(D2) | ηc/ηb | θb('') | VLSR (km s−1) |
 (K) (K) |
 (km s−1) (km s−1) |
|---|---|---|---|---|---|---|---|---|---|
| H2CS |

|
68699.38 | 4.95 | 5.43 | 0.94 | 92 | 63.7 | 0.375 | 14.0 |
| 72.4 | 0.357 | 14.0 | |||||||

|
69746.75 | 18.20 | 12.21 | 0.94 | 90 | 65.2 | 0.555 | 14.0 | |
| 73.8 | 0.523 | 14.0 | |||||||

|
101477.81 | 22.92 | 21.70 | 0.88 | 62 | 64.4 | 1.030 | 14.0 | |
| 73.3 | 0.880 | 14.0 | |||||||

|
103039.91a | 62.59 | 4.52 | 0.87 | 61 | 62.5 | 0.691 | 14.0 | |

|
103040.45a | 9.90 | 8.14 | 0.87 | 61 | 74.2 | 0.480 | 14.0 | |

|
103051.85 | 62.60 | 4.52 | 0.87 | 61 | 64.5 | 0.210 | 14.0 | |
| 73.2 | 0.145 | 14.0 | |||||||

|
104617.04 | 23.23 | 21.70 | 0.87 | 60 | 62.1 | 0.962 | 14.0 | |
| 73.6 | 0.714 | 14.0 | |||||||

|
135298.26 | 29.42 | 30.52 | 0.79 | 46 | 62.6 | 1.306 | 14.0 | |
| 73.7 | 0.760 | 14.0 | |||||||

|
137369.49a | 135.01 | 14.24 | 0.79 | 46 | 62.1 | 1.108 | 14.0 | |

|
137369.49a | 135.01 | 14.24 | 0.79 | 46 | 73.0 | 0.647 | 14.0 | |

|
137371.21a | 16.49 | 10.85 | 0.79 | 46 | ||||

|
137382.12 | 69.19 | 8.14 | 0.79 | 46 | 64.4 | 0.403 | 14.0 | |
| 73.2 | 0.346 | 14.0 | |||||||

|
137412.01 | 69.19 | 8.14 | 0.79 | 46 | 64.2 | 0.310 | 14.0 | |
| 72.9 | 0.235 | 14.0 | |||||||

|
139483.68 | 29.92 | 30.52 | 0.78 | 45 | 63.5 | 1.433 | 14.0 | |
| 72.1 | 0.979 | 14.0 | |||||||

|
169114.08 | 37.54 | 39.06 | 0.70 | 37 | 63.9 | 1.712 | 14.0 | |
| 72.8 | 0.981 | 14.0 | |||||||

|
171670.98a | 235.31 | 4.88 | 0.69 | 37 | 62.0 | 0.141 | 14.0 | |

|
171670.98a | 235.31 | 4.88 | 0.69 | 37 | 72.4 | 0.050 | 14.0 | |

|
171688.12 | 24.74 | 13.56 | 0.69 | 37 | 64.0 | 0.927 | 14.0 | |
| 72.7 | 0.569 | 14.0 | |||||||

|
171780.17 | 77.44 | 11.39 | 0.69 | 37 | 64.0 | 0.483 | 14.0 | |
| 72.8 | 0.263 | 14.0 | |||||||

|
236727.02 | 58.66 | 55.81 | 0.75 | 32 | 64.6 | 1.909 | 14.0 | |
| 73.4 | 1.106 | 14.0 | |||||||

|
240261.99a | 374.93 | 27.92 | 0.75 | 31 | 61.5 | 1.220 | 14.0 | |

|
240261.99a | 374.93 | 27.92 | 0.75 | 31 | 72.8 | 0.420 | 14.0 | |

|
240266.87a | 46.17 | 18.99 | 0.75 | 31 | ||||

|
240382.05a | 98.88 | 17.44 | 0.75 | 31 | 64.5 | 1.355 | 14.0 | |

|
240393.04a | 164.70 | 46.51 | 0.75 | 31 | 73.3 | 1.024 | 14.0 | |

|
240393.76a | 164.70 | 46.51 | 0.75 | 31 | ||||

|
240549.07 | 98.90 | 17.44 | 0.75 | 31 | 65.8 | 0.644 | 14.0 | |
| 73.3 | 0.456 | 14.0 | |||||||

|
244048.50 | 60.06 | 55.80 | 0.75 | 31 | 63.8 | 2.013 | 14.0 | |
| 73.7 | 0.925 | 14.0 | |||||||

|
270521.93 | 71.65 | 64.09 | 0.75 | 28 | 64.1 | 1.904 | 14.0 | |
| 73.0 | 0.986 | 14.0 | |||||||

|
274703.35 | 112.07 | 20.35 | 0.75 | 27 | 64.6 | 0.481 | 14.0 | |
| 73.3 | 0.290 | 14.0 | |||||||

|
274732.98a | 177.89 | 55.96 | 0.75 | 27 | 63.8 | 1.080 | 14.0 | |

|
274734.40a | 177.89 | 55.96 | 0.75 | 27 | 73.7 | 0.459 | 14.0 | |

|
274953.74 | 112.10 | 20.35 | 0.75 | 27 | 63.9 | 0.769 | 14.0 | |
| 72.6 | 0.558 | 14.0 | |||||||

|

|
97632.20 | 22.55 | 21.72 | 0.89 | 64 | 62.6 | 0.055 | 14.0 |
| 71.8 | 0.033 | 14.0 | |||||||

|
162706.57 | 36.62 | 39.10 | 0.71 | 39 | 63.1 | 0.061 | 14.0 | |
| 72.3 | 0.028 | 14.0 |
Notes. Source coordinates (B1950): α = 17h44m095, δ=−28°21'20''. Spectra were observed with the Millimeter Auto Correlator (MAC) and resampled at 1 MHz resolution using a standard cubic spline algorithm. Line parameters were derived from a least-squares fit of a Gaussian profile to the spectrum.
Download table as: ASCIITypeset image
Representative spectra from Sgr B2(N) for each isotopologue of the five respective molecules, both the 12C and 13C species, are shown in Figures 1(a) and (b). Here the black trace is the observed data, while the red line is the current model fit (see below). The features of interest are indicated with arrows. The top three panels in Figure 1(a) show one line of H2CS and two for  near 104.6, 97.6, and 162.7 GHz, respectively, while the next two graphs present data for NH2CHO and
  near 140.6 and 169.0 GHz. The lower three panels in Figure 1(a) show various K components (K = 0–3 or 4) of transitions of CH3CCH (102.5 GHz), 13CH3CCH (83.1 GHz), and CH3C13CH (99.4 GHz). The K = 0, 1, and 2 components are typically blended together into a single asymmetric feature for these species. Unfortunately, all lines for
  were contaminated either by those of the main isotopologue or by other molecules; accurate spectral parameters could not be determined for this species.
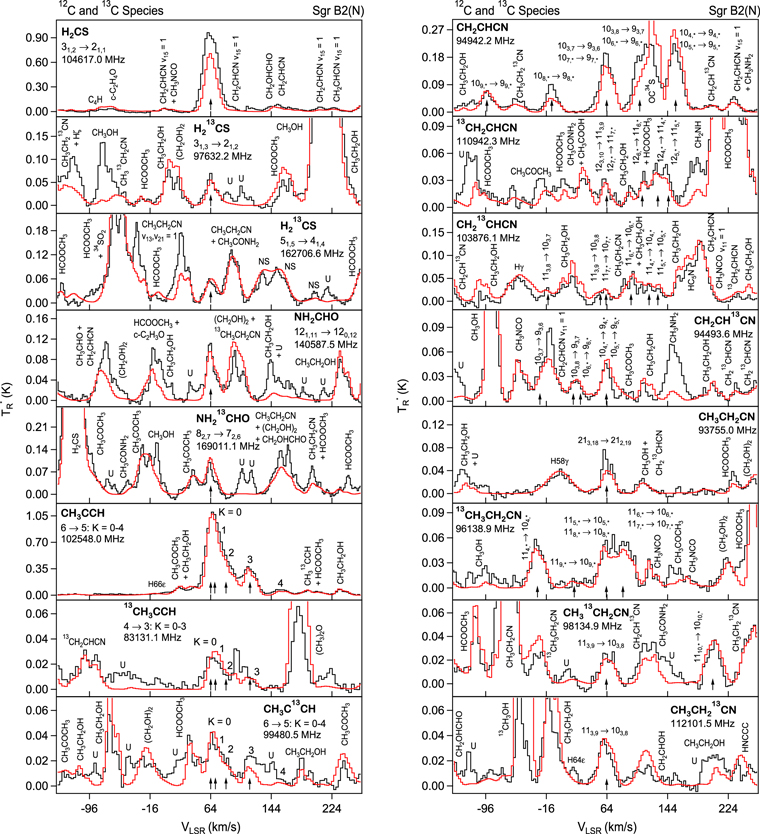
Figure 1. Representative spectra of 12C and 13C species measured toward Sgr B2(N) with the ARO 12 m telescope at 3 and/or 2 mm. Individual lines of the carbon isotopologues of (a) H2CS, CH3CCH, and NH2CHO, (b) CH2CHCN and CH3CH2CN are shown, indicated by arrows underneath the data. The spectral resolution is 1 MHz. The central frequency of each spectrum and quantum numbers of transitions are indicated for each panel, assuming an LSR velocity of 64 km s−1. Multiple Kc quantum numbers for series of asymmetry components for CH2CHCN and CH3CH2CN are indicated by asterisks (e.g., JKa,Kc = 107,3 → 97,2 and 107,4 → 97,3 is shown as 107,* → 97,*). The modeled spectrum overlies the data in red, assuming two velocity components near 64 and 73 km s−1. The approximate integration time per spectrum is 4–16 hr.
Download figure:
Standard image High-resolution image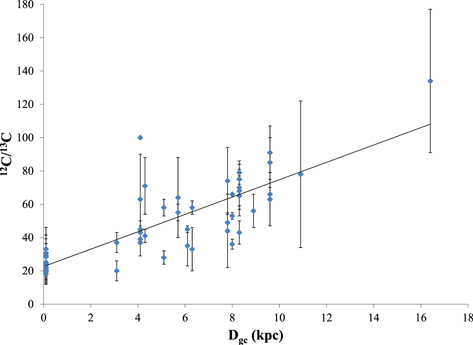
Figure 2. Plot of the 12C/13C isotope ratio as a function of distance to the Galactic center, DGC (kpc), using the data of Table 2 of Milam et al. (2005) and the new values from this work. The solar distance to the Galactic center is assumed to be 7.9 kpc. The revised gradient is 12C/13C = 5.21(0.52) DGC + 22.6(3.3).
Download figure:
Standard image High-resolution imageThe  and
and  spectra (second and fifth panels, Figure 1(a)) illustrate the evolution of the line shape as a function of frequency. The two velocity components are collapsed into one single feature in the 97.6 GHz line. For the formamide-13C transition at 169.0 GHz, a shoulder at higher velocity (∼73 km s−1) can be seen on the "main" (64 km s−1) line.
In Figure 1(b), the top four panels show representative spectra for the 12C and singly substituted 13C isotopologues of vinyl cyanide (CH2CHCN: 94.9 GHz; 13CH2CHCN: 110.9 GHz;  :103.8 GHz; and CH2CH13CN: 94.5 GHz). In the lower four panels, the 12C and singly substituted 13C species of ethyl cyanide (CH3CH2CN: 93.8 GHz; 13CH3CH2CN: 96.1 GHz;
  : 98.1 GHz; and
  : 112.1 GHz) are displayed. In each spectrum, typical multiple (a-type) transitions of the respective isotopologue are visible, as indicated again by arrows. Some transitions
  lie at the same frequency, differentiated only by changes in the
  quantum number. In these cases,
  is substituted by an asterisk in the figure.
3.2. Analysis Method
The data sets for the five molecules across the 1, 2, and 3 mm bands were analyzed in a global fit using a radiative code. In this algorithm, observed spectra are simulated by varying the values of the line width and LSR velocity, as well as the rotational temperature, total column density, and source size. The "best fit" is established by a nonlinear least-squares evaluation. For some of the weaker isotopologues, certain free parameters had to be fixed to a given value, as described in the next section. The line shapes were assumed to be Gaussian. Rest frequencies, level energies, line strengths (μ2S), and partition functions were obtained from spectral-line databases.
In the analysis, a global fit was first carried out of the entire Sgr B2(N) data set, assuming the source fills the telescope beam. This fitting enabled the identification of obvious blended lines for a given species, which were then removed from the analysis. All uncontaminated transitions for a given molecule and its 13C isotopologues were then analyzed separately. For two species, H2CS and CH3CCH, the assumptions of low opacity and extended emission were excellent approximations, and the observed lines were well modeled. The extended emission of these two molecules is apparent in the 5' × 5' maps, centered on Sgr B2(N), made by the Mopra telescope (Jones et al. 2008). For the other three molecules (NH2CHO, CH2CHCN, and CH3CH2CN), many transitions in the main isotopologue were optically thick, and the emission appeared more confined with respect to the telescope beam. Because the source size and line opacities are very highly correlated, it was difficult to fit the optically thick transitions with sufficient confidence to determine accurate 12C/13C ratios.
For NH2CHO and CH3CH2CN, this situation was remedied by fitting the numerous optically thin b-type lines of the main isotopic species, and adjusting the source size. Unfortunately, CH2CHCN exhibits a small number of such transitions, which also have weak intensities. Consequently, only the 13C species were confidently modeled. Note that the line profiles of all five species were successfully fit with line widths between 9 and 14 km s−1 and two LSR components near 64 and 73 km s−1. To arrive at an estimate of the source sizes for NH2CHO, CH3CH2CN, and CH2CHCN, the line intensities were first compared to lines measured with the IRAM 30 m telescope. This value was used as an initial guess and then varied systematically until the best size was established by the least-squares analysis. Once determined, the source size was held fixed in the final fit, which established the rotational temperature and column density. This approach was necessary because the source size, rotational temperature, and column density are highly correlated (96%–99%) in the analysis. One parameter had to be held constant in order for the others to have significant values.
The results of this analysis are given in Table 1 and the simulated spectra for Sgr B2(N) are shown in red in Figure 1, as mentioned. Details for each molecule are outlined in the next section.
3.3. Results for Individual Molecules
3.3.1. Thioformaldehyde (H2CS and  )
)

The CDMS entries (046509 ver. 2 and 047505 ver. 1) were used to evaluate both the H2CS and  spectra (Endres et al. 2016). The database entries are based on the spectroscopy work of Maeda et al. (2008). Thirty-three lines of H2CS were modeled, assuming the source fills the main beam and fixing line widths to ΔV1/2 = 14.0 km s−1. The velocity of one component was varied, yielding VLSR = 63.4 km s−1, while the other was fixed to VLSR = 73.0 km s−1. The rotational temperature of the 63.4 km s−1 component was successfully modeled with Trot = 71 K, while the other was fixed to Trot = 75 K. The corresponding total column densities of the two velocity components were determined to be Ntot ∼ 6.9 × 10¹⁴ and 2.8 × 1014 cm−2 (see Table 1).
Two distinct lines of  were detected near 97.6 and 162.7 GHz. Consequently, the spectra were modeled with the line parameters fixed to those found for the 12C isotopologue (ΔV1/2 = 14.0 km s−1 and VLSR = 64.0 and 73.0 km s−1). The 64 km s−1 component was found to have Trot = 88 K and Ntot ∼ 3.7 × 1013 cm−2, while the 73.0 km s−1 feature exhibited Trot = 86 K and Ntot ∼ 1.9 × 1013 cm−2. The rotational temperatures are in reasonable agreement with those of the 12C species. Comparing column densities, 12C/13C ∼ 19 ± 6 and 15 ± 5 for the 64.0 and 73.0 km s−1 components, respectively (see Table 3).
Table 3. Summary of Derived 12C/13C Ratios
| 12C Species | 13C Species | VLSR (km s−1) | 12C/13C |
|---|---|---|---|
| H2CS |

|
64.0 | 19 ± 6 |
| 73.0 | 15 ± 5 | ||
| CH3CCH | 13CH3CCH | 64.0 | 24 ± 7 |
| 73.0 | 18 ± 5 | ||
| CH3CCH | CH3C13CH | 64.0 | 19 ± 5 |
| 73.0 | 22 ± 6 | ||
| NH2CHO |

|
64.0 | 25 ± 8 |
| 73.0 | 31 ± 8 | ||
| CH3CH2CN | 13CH3CH2CN | 62.1 | 21 ± 9 |
| 73.0 | 20 ± 5 | ||
| CH3CH2CN | CH3 CH2CN CH2CN |
62.7 | 33 ± 13 |
| 73.0 | 24 ± 6 | ||
| CH3CH2CN |

|
62.1 | 29 ± 12 |
| 73.0 | 28 ± 8 | ||
| Average | 64.0 | 24 ± 9 | |
| 73.0 | 23 ± 6 |
Download table as: ASCIITypeset image
In their survey of Sgr B2, Belloche et al. (2013) observed lines of H2CS, but did not have a definitive detection of  . They modeled their main isotope data at 3 mm with two very similar velocity components with 8 km s−1 line widths, and a third, less certain feature near 54 km s−1. We do not see this lower velocity gas in our data. These authors fit their spectra with both hot and cold components and with a source size of a few arcseconds, but commented that their resulting line parameters were not well constrained. Our data were well modeled with an extended source and a single temperature component, which may simply reflect our larger beam size.
3.3.2. Methylacetylene (CH3CCH, 13CH3CCH, and CH3C13CH)
The JPL database entries were used in the analysis of the three observed isotopologues of methylacetylene CH3CCH (or propyne: 040001, 041004, and 41002, all ver. 1; Pickett et al. 1998), all based on the experiment work of Dubrulle et al. (1978). Because of two velocity components and a ∼10 km s−1 line width, lower value K components were typically blended to create a single asymmetric feature for all three species, see Figure 1(a). However, the line shapes could be well reproduced for all isotopologues by fixing the line widths to the 10 km s−1 value and the VLSR velocity of one of the two components to 73.0 km s−1. The other velocity was varied to obtain the best fit, yielding values of 63–64 km s−1.
In the analysis of the main isotopologue CH3CCH, 28 transitions were fit across the 3, 2, and 1 mm regions up to K = 5. The analysis yielded rotational temperatures of 59 and 68 K for the VLSR = 64.0 and 73.0 km s−1 components, respectively, with column densities of Ntot = 2.2 × 10¹⁵ and 1.5 × 1015 cm−2, assuming the source filled the beam. This assumption is supported by Jones et al. (2008), who mapped this species across Sgr B2, which showed extended emission of this molecule. As mentioned, only two of the three possible 13C isotopologues were clearly detected, 13CH3CCH and CH3C13CH, with one rotational transition J + 1 → J per species near 83.1 and 99.5 GHz, respectively, each consisting of 3–4 K components (see Figure 1(a)). The third isotopologue  , was not analyzed because of line contamination, as mentioned. The rotational temperatures for 13CH3CCH and CH3C13CH were determined to be 72 and 74 K, applicable to both velocity components. The column densities for the 64.0 and 73.0 km s−1 features were established to be Ntot = 9.1 × 10¹³ and 8.3 × 1013 cm−2 for 13CH3CCH, and 1.1 × 10¹⁴ and 6.8 × 1013 cm−2 for CH3C13CH, respectively. These values yield 12C/13C ratios for the 64.0 and 73.0 km s−1 components of 24 ± 7 and 18 ± 5 from 13CH3CCH, and, using CH3C13CH, 19 ± 5 and 22 ± 6, as displayed in Table 3.
Belloche et al. (2013) only measured a single line for each of the 13C isotopologues. They did not calculate a 12C/13C ratio, but assumed a value of 20 to estimate abundances of the 13C species. These authors chose an arbitrary source size of 10'' for CH3CCH, and fit their 3 mm data with two velocity components that are almost identical to those used here. They noted that their chosen source size was not compatible with Mopra data, which for CH3CCH showed extended emission across several arcminutes (Jones et al. 2008).
3.3.3. Formamide (NH2CHO and )

In the analysis of NH2CHO and  , the CDMS entries (045512 and 046512, both ver. 2) were employed, based on the work of Motiyenko et al. (2012). Twenty-two fully resolved b-type transitions of NH2CHO and 16 a-type lines of
  were modeled. A large number of the a-type lines were identified for the main isotopic species but were not used in the analysis, as mentioned. The data for both species were fit with the usual two velocity components and a fixed line width of 10 km s−1. For NH2CHO, the LSR velocity of one component was fixed to 73.0 km s−1, while the other velocity was determined to be 63.4 km s−1 from the fit; both LSR velocities were fixed for the 13C species to 64.0 and 73.0 km s−1. A source size of 45'' was estimated by comparison of the relative intensities of the lines from the 12 m and IRAM 30 m. This source size is consistent with the Mopra maps of the Sgr B2(N) region from Jones et al. (2008), although their image is contaminated by H2COH+. The rotational temperature of NH2CHO was determined to be 150 and 148 K for the 64 and 73 km s−1 features, respectively, with column densities of 3.1 × 10¹⁵ and 1.6 × 1015 cm−2. For
  , the rotational temperature was estimated to be Trot ∼ 150 K for both components; column densities slightly varied with Ntot ∼ 1.2 × 10¹⁴ for the 63 km s−1 feature and 5.2 × 1013 cm−2 for that at 73 km s−1. The subsequent 12C/13C ratios are then 25 ± 8 and 31 ± 8 for the two velocity components, see Table 3.
Both 12C and 13C species were observed by Belloche et al. (2013), but no ratio was calculated. They analyzed their formamide data at 3 mm with three velocity components, two that are identical to ours, and a weaker third feature near 80 km s−1. The optically thick main isotopic lines were included in their modeling, which used a source size of a few arcseconds. This source size is not consistent with the Mopra map of this molecule (Jones et al. 2008), suggesting the observations of Belloche et al. are less sensitive to extended formamide emission and more to emission associated with the two hot cores as compared to our observations, which can be explained naturally by the different beam sizes.
3.3.4. Vinyl Cyanide (CH2CHCN, 13CH2CHCN, , and CH2CH13CN)

For the analysis of the isotopologues of vinyl cyanide, the CDMS data (053515, 054506, 054507, and 054508, all ver. 1) were used. These entries are based on laboratory work by Gerry & Winnewisser (1973), Baskakov et al. (1996), and Cazzoli & Kisiel (1988) for the main isotopic species and Colmont et al. (1997) for the 13C isotopologues. For CH2CHCN, most lines were optically thick and were not modeled, as previously discussed.
For 13CH2CHCN,  , and CH2CH13CN, 42, 21, and 30 uncontaminated lines were analyzed, all containing the two velocity components. Comparing the line intensities of these species with those of the IRAM 30 m suggested a ∼1'' source size, which was then assumed in the analysis. For all three 13C species, the higher velocity component VLSR was fixed to 73.0 km s−1 in the modeling, while the LSR velocity of the other feature was varied, the best fit resulting in values of VLSR = 63.1, 62.4, and 64.0 km s−1 for 13CH2CHCN,
  , and CH2CH13CN, respectively. For the 73 km s−1 component, line widths were fixed to ΔV1/2 = 10 km s−1, while optimizing the fit produced values of 10.4, 9.3, and 9.5 km s−1 for the 64 km s−1 feature. The rotational temperatures were determined in the analysis to be ∼80 K for all three species. The column densities of the 64 km s−1 component were in the range Ntot ∼ 0.7–1.3 × 1017 cm−2, while at 73.0 km s−1, these values were lower with Ntot ∼ 1.2–3.3 × 1016 cm−2 (see Table 1).
In their analysis of vinyl cyanide, Belloche et al. (2013) used a fit with three velocity components—two identical to those found here. The third is the lower velocity feature with VLSR ∼ 54–55 km s−1, which they also observed in H2CS. These authors modeled their data with a source size of 1''–3'' and included optically thick transitions for the main isotopologue. Their derived column densities for the 13C species are very similar to those determined here. Overall, the agreement between the two analyses is good, considering the uncertainties. Previously, Müller et al. (2008) had detected all three 13C species of vinyl cyanide with ALMA, as mentioned, and estimated 12C/13C ∼ 21 for Sgr B2(N2), while Belloche et al. (2016) found a ratio of 20 for the same core, using ALMA observations of this species. These ratios are consistent with our values from other molecules.
3.3.5. Ethyl Cyanide (CH3CH2CN, 13CH3CH2CN, , and )


The CDMS entries (055502, 056506, 056505, and 056504, all ver. 2) were employed to analyze the 12C and 13C species of ethyl cyanide in Sgr B2(N). The data for CH3CH2CN are from Brauer et al. (2009) and Fukuyama et al. (1996), while Richard et al. (2013) measured the spectrum of the 13C isotopologues. A source size of 3'' was assumed, determined by comparison of intensities with the IRAM 30 m data. For the 12C isotopolgue, 53 b-type transitions were analyzed in Sgr B2(N) to establish the abundance. A two-component model was used, as per the other molecules studies here, and both the LSR velocities and line widths were fixed to VLSR = 64.0 and 73.0 km s−1, with ΔV1/2 = 12.0 km s−1. The subsequent fit resulted in Trot ∼ 86 K, with Ntot(64 km s−1) ∼ 4.1 × 1017 cm−2, while Ntot(73 km s−1) was fixed to 2.5 × 1017 cm−2.
For the 13C isotopologues, 54, 47, and 52 uncontaminated lines from a-type transitions were analyzed with the two velocity components. The line widths were held fixed to ΔV1/2 = 12.0 km s−1 for both velocity features in all three species, except for the 64 km s−1 component in  . In this case, it was varied, yielding a best fit of 12.8 km s−1. One LSR velocity was fixed to 73.0 km s−1, and the other was a free parameter, resulting in fitted values of VLSR ∼ 60.1–61.9 km s−1. The quality of the fit was quite good for these species, as shown in Figure 1(b). The resulting rotational temperatures were in the range of Trot ∼ 85–91 K for the 13C isotopologues, with Ntot ∼ 1.2–1.9 × 1016 cm−2 for the lower velocity gas and Ntot ∼ 0.88–1.2 × 1016 cm−2 for the higher velocity material: see Table 1. The 12C/13C ratio was found to be in the range 20 ± 5 to 33 ± 13 for the isotopic combinations for both velocity components (see Table 3).
In their survey, Belloche et al. (2013) observed all three 13C species for ethyl cyanide, as well as the main isotopologue. They fit both optically thin and thick transitions at 3 mm, assuming a source size of 2''–3'' with 55, 63, and 73 km s−1 velocity components. Their resulting column densities agree well with those determined here. In this case, they estimated 12C/13C ∼ 30, based on all three 13C species, which they noted have similar abundances. In addition, Belloche et al. (2016) found 12C/13C ∼ 30 for the Sgr B2(N2) core, using ALMA data obtained for all three species. In our study, the  and
and  data suggested ratios near 30, but 13CH3CH2CN indicated 12C/13C ∼ 20, reflected in both velocity components, one of which is from Sgr B2(N2). However, these differences lie within the estimated uncertainties of the ratios.
4. Discussion
4.1. A Revised 12C/13C Galactic Gradient
Based on 4 different molecules, 7 varying isotopologue combinations, and 2 separate gas components, 14 individual estimates of the 12C/13C ratio in the Galactic Center have been obtained. The average carbon isotope ratio based on these data was found to be 12C/13C ∼ 24 ± 9 for the 64 km s−1 component and 23 ± 6 for the 73 km s−1 feature, see Table 3. The values for the two components are identical within the uncertainties, and there is no quantitative deviation with molecule choice. Previous estimates of the gradient in the Sgr B2 region were based on ratios obtained from CO, H2CO, and CN (12C/13C ∼ 24 ± 1, 10, >18; see Milam et al. 2005). These new measurements, as well as others described in the Introduction, provide additional constraints for the ratio in the Galactic center.
With these new values, coupled with the CO and CN data from Milam et al. (2005), a revised Galactic gradient can be computed. (The value of 12C/13C = 10 for H2CO in Sgr B2(OH) was excluded since it is most likely optically thick). A least-squares fit to this combined data set yields

In comparison, Milam et al. (2005) calculated 12C/13C = 6.21(1.00) DGC + 18.71(7.37). The new gradient therefore has a slightly shallower slope, but higher precision. A graph of the 12C/13C ratio as a function of distance from the Galactic center Dgc is shown in Figure 2. The newly measured 12C/13C ratios also reinforce the existence of the isotope gradient itself.
4.2. Chemical Implications for Isotopic Enrichment
This work determined column densities of various 13C isotopomers of methyl acetylene (13CH3CCH, and CH3C13CH), vinyl cyanide (13CH2CHCN,  , and CH2CH13CN), and ethyl cyanide (13CH3CH2CN,
  , and
, and  ), based on a wide range of transitions. Within the uncertainties, the resulting column densities and therefore abundances of the corresponding isotopologues for each of these three species were found to be the same, independent of the location of the 13C substitution. This result indicates rather clearly that the formation mechanism of these species does not produce any significant preferential isotopic enhancement. Such chemical fraction effects are removed through "isotopic scrambling" of the molecules themselves or their precursors, which might be expected given the warmer (T ≥ 100 K) gas in Sgr B2(N). The 12C/13C ratios observed in this cloud thus represent the true isotope gradient arising from stellar nucleosynthesis.
Chemical fractionation occurs because of differences in zero-point energies. Ion-molecule isotopic exchange reactions are often significantly exothermic, such as


Here ΔE is the zero-point energy difference between the 12C and 13C isotopologues, estimated to be 35 K for CO and 34 K for CN. However, the carbon atoms in the case of CH3CCH, CH2CHCN, and CH3CH2CN cannot be easily exchanged by these types of simple reactions, as they all are bonded to more than one other atom. Any 13C exchange must occur through precursor molecules, requiring knowledge of formation pathways.
A possible gas-phase formation mechanism for ethyl cyanide in the gas phase involves a radiative association reaction, followed by dissociative electron recombination, as shown in Figure 3 (UDFA 2012 database: McElroy et al. 2012: http://udfa.ajmarkwick.net/index.php):


At 150–200 K, the first reaction has a rate of ∼10−10 cm3 s−1 , while the second reaction occurs at ∼10−6 cm3 s−1 (McElroy et al. 2012). These rates seem plausible for creating ethyl cyanide, and radiative association reactions, similar to reaction 4, have been incorporated into astrochemical models to successfully produce complex organic species (Vasyunin & Herbst 2013). The precursor species, methyl cyanide (CH3CN), can be produced by the following processes involving CH3CNH+ (McElroy et al. 2012; Wakelam et al. 2015):


Reaction 6 has a rate of k6 ≈ 10−8 cm3 s−1, reaction 7 proceeds at k7 ≈ 3 × 10⁻⁹ cm3 s−1, and reaction 8 has k8 ≈ 2 ×10⁻⁷ cm3 s−1 (Herbst 1985; Anicich 1993; Loison et al. 2014). The carbon–carbon bonds in CH3CH2CN are therefore likely formed from HCN and  and/or
  . As a consequence, these precursors in Sgr B2(N) likely exhibit 12C/13C ratios comparable to those in ethyl cyanide. Unfortunately, it is not possible to reliably measure the 12C/13C ratios in these precursor species from the survey data because of self-absorption (HCN) or lack of a permanent dipole moment (
 and
and  ).
).
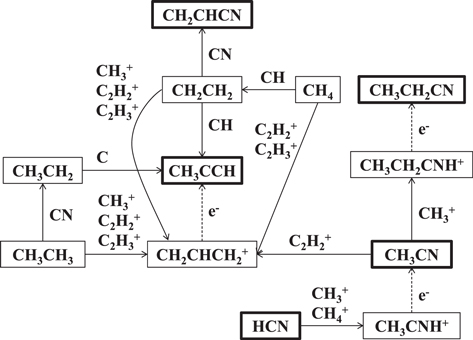
Figure 3. Chemical network showing the reaction pathways leading to CH3CCH, CH2CHCN, and CH3CH2CN. As the figure shows, there are multiple reactions producing CH3CCH with only one route each leading to CH2CHCN and CH3CH2CN. The species in the highlighted boxes have been identified in Sgr B2(N). The complexity of the network suggests that the comparable 12C/13C ratios obtained from non-equivalent carbon atoms reflect those of simple precursor molecules.
Download figure:
Standard image High-resolution image
Ethyl cyanide could also be formed on grain surfaces, produced by the successive hydrogenation of C3N or HC3N (Caselli et al. 1993). The two precursor species are principally produced by gas-phase reactions, and are indeed observed toward Sgr B2(N). In this case, the 13C would be first "scrambled" in C3N or HC3N in the gas phase and the resulting isotopic composition of the carbon backbone "locked" on grain surfaces. Hydrogenation leading to ethyl cyanide presumably would then not alter the 13C tagging.
A possible source of vinyl cyanide is ethyl cyanide itself. The reaction of ethyl cyanide with H+ or  leads to H2 elimination and the formation of CH2CHCNH+ (Caselli et al. 1993). Dissociative recombination of this ion creates vinyl cyanide, in which case the 13C distribution in ethyl cyanide is simply preserved. Another route for the formation for vinyl cyanide is the neutral-neutral reaction between ethene and the CN radical; see the scheme in Figure 3 (KIDA database: Wakelam et al. 2015: http://kida.obs.u-bordeaux1.fr):

This reaction has a maximum rate near 50 K of k9 ≈10−10 cm3 s−1, which diminishes by a factor of 2 approaching 300 K (Sims et al. 1993; Wakelam et al. 2015). The carbon-13 isotope could then be incorporated into vinyl cyanide via the following reactions:


For CH2CH13CN to have a comparable 12C/13C ratio to 13CH2CHCN and  in this scheme, the ratios in CH2CH2 and CN must be very similar. Carbon-13 cannot be easily substituted on ethene, but must arise from its precursors, CH4 + CH. Therefore, CH
 , CH, and CN must all have similar isotopic compositions. Once again, it is difficult to extract the degree of 13C enrichment in these molecules from the survey; CN in Sgr B2(N) shows self-absorption, CH4 lacks a dipole moment, and CH has spectra in the submillimeter (ν > 300 GHz). Based on past observations of CN by Milam et al. (2005), however, 12C/13C ≥ 18 toward nearby Sgr B2(OH), consistent with the proposed scenario.
Formation on dust grains provides another synthetic route. Vinyl cyanide is created by successive hydrogenation of C3N or HC3N on grain surfaces, in analogy to ethyl cyanide (Caselli et al. 1993). Again, the 13C distribution in the carbon backbone of vinyl cyanide therefore arises from gas-phase molecules, as for ethyl cyanide.
In contrast to vinyl cyanide, there are multiple gas-phase pathways to form CH3CCH, as displayed in Figure 3. Hickson et al. (2016) suggest that the most likely gas-phase route to this molecule is dissociative electron recombination from protonated methylacetylene (allyl cation),  . This reaction occurs at a rate of ∼3 × 10⁻⁷ cm3 s−1 between 50 and 100 K (Wakelam et al. 2015). There are multiple ion-molecule routes to synthesize
  from ethane, ethene, methane, or methyl cyanide, involving
  ,
,  , or
, or  (Figure 3). These reactions all form carbon–carbon bonds, and have relatively fast rates ranging from 2.2 × 10⁻¹⁰ to 1.1 × 10⁻⁹ cm3 s−1 (Wakelam et al. 2015; Hickson et al. 2016). Two neutral-neutral reactions involving ethene or ethyl radical are also possible pathways, although the branching ratios are not certain (Hickson et al. 2016):


The rate for reaction 13 is k13 ≈ 3 × 10⁻¹⁰ cm3 s−1 between 50 and 100 K, while reaction 14 proceeds with k14 ≈ 2 ×10⁻¹⁰ cm3 s−1 (Canosa et al. 1997; McElroy et al. 2012).
Methylacetylene could also be produced on the surface of dust grains by sequential hydrogenation of  . Again,
  is first formed in the gas phase, freezing in the 13C tagging, and is subsequently incorporated onto grain surfaces (Hickson et al. 2016). This mechanism, however, could be disrupted by the presence of atomic oxygen on the grain surface. It is clear that there are a sufficient numbers of routes leading to the incorporation of carbon-13 into CH3CCH to dilute any site specificity from a given precursor.
5. Conclusion
Observations from the broadband ARO spectral-line survey of Sgr B2(N) have produced a unique data set for the 12C and 13C isotopologues of H2CS, CH3CCH, NH2CHO, CH2CHCN, and CH3CH2CN. The 12C/13C ratios for this cloud obtained from these molecules, involving many isotopic combinations, are nearly identical within experimental uncertainties, with the average value of 24 ± 7. Given the varied formation pathways leading to these five species and their multiple carbon sites, such uniformity in the ratio suggests that chemical fractionation is insignificant. Therefore, the 12C/13C ratios obtained must principally reflect stellar nucleosynthesis and subsequent Galactic chemical evolution. The elevated temperatures in Sgr B2(N) effectively erase chemical fractionation effects in smaller precursor molecules, and the resulting 12C/13C ratio is then "locked" into product species. This work also suggests that measurements of the 12C/13C ratio in warmer clouds across the Galaxy are a reliable measure of the degree of GCE.
We thank the staff of ARO for making these observations possible. This research was supported by NSF grants AST-1515568 and AST-1140030. The Kitt Peak 12 m and the SMT are operated by the Arizona Radio Observatory (ARO), with partial support through the NSF University Radio Observatories (URO) program (AST-1140030). The work was also supported by NASA under Agreement No. NNX15AD94G issued through the Science Mission Directorate interdivisional initiative Nexus for Exoplanet System Science (NExSS).
Footnotes
- a
Lines compose one feature with given values of VLSR.