


Abstract
Interplanetary coronal mass ejections (ICMEs) often cause Forbush decreases (Fds) in the flux of galactic cosmic rays (GCRs). We investigate how a single ICME, launched from the Sun on 2014 February 12, affected GCR fluxes at Mercury, Earth, and Mars. We use GCR observations from MESSENGER at Mercury, ACE/LRO at the Earth/Moon, and MSL at Mars. We find that Fds are steeper and deeper closer to the Sun, and that the magnitude of the magnetic field in the ICME magnetic ejecta as well as the "strength" of the ICME sheath both play a large role in modulating the depth of the Fd. Based on our results, we hypothesize that (1) the Fd size decreases exponentially with heliocentric distance, and (2) that two-step Fds are more common closer to the Sun. Both hypotheses will be directly verifiable by the upcoming Parker Solar Probe and Solar Orbiter missions. This investigation provides the first systematic study of the changes in GCR modulation as a function of distance from the Sun using nearly contemporaneous observations at Mercury, Earth/Moon, and Mars, which will be critical for validating our physical understanding of the modulation process throughout the heliosphere.
Export citation and abstract BibTeX RIS
1. Introduction
Galactic cosmic rays (GCRs) are high-energy particles (with a peak flux near Earth at a few hundreds of MeV/nuc) that are accelerated outside of our solar system, often in supernova explosions (Simpson 1983). They consist mostly of protons, with ∼7%–10% helium and ∼1% heavier elements (Simpson 1983). Charged GCRs are subject to continuous scattering by magnetic fields in interstellar and heliospheric space and are thus observed to have isotropic distributions. These particles permeate the heliosphere, where their fluxes are affected by transient solar wind phenomena and are modulated by magnetic fields in the solar wind. During solar maximum, the increased heliospheric magnetic fields are more efficient at hindering low-energy GCRs from entering the inner heliosphere (e.g., Wibberenz et al. 2002; Heber et al. 2007), and thus the GCR flux is lowest at these times.
Short-term drops in GCR flux, termed Forbush decreases (Fds), have been observed to be associated with the passage of interplanetary coronal mass ejections (ICMEs) as well as with corotating interaction regions (CIRs; e.g., Forbush 1938; Cane 2000; Richardson & Cane 2011; Schwadron et al. 2012). Most of the work concerning ICME-driven Fds has been done using either ground or space based observations near Earth (e.g., Lockwood 1971; Barnden 1973a, 1973b; Cane et al. 1996). A thorough review of Fds caused by ICMEs is given in Cane (2000).
Fds can be caused by (1) changes in the solar wind turbulence properties behind shocks of ICMEs and CIRs (e.g., in ICME sheaths), which in turn affect the diffusion coefficients of GCRs, and by (2) the closed field line geometry inside magnetic ejecta (ME) of ICMEs, which significantly hinders diffusion transport across the magnetic field (e.g., Krittinatham & Ruffolo 2009). Thus, in the case of an ICME with a shock and ME passing by an observation point, two decreases in GCR flux, or a two-step Fd, may be detected. This however is not always the case, as sometimes only a one-step Fd is observed, and a number of studies have attempted to address this issue (see Jordan (2011) for review). Most recently, the work of Masias-Meza et al. (2016) characterized the average shape and properties of Fds and ICMEs near 1 au using superposed epoch analyses. By categorizing ICMEs as slow, medium, or fast, they found that the slow and medium speed ICMEs show a drop in GCR flux at the sheath only, while fast ICMEs exhibit a second drop inside the ME, and are thus two-step Fds. They also showed that at 1 au, fast ICMEs have significantly stronger magnetic fields both in the sheath and ME compared to slow ICMEs. The stronger magnetic field inside fast ejecta may be the cause of the secondary GCR flux drop, as the work of Belov et al. (2015) showed that there is a local minimum in GCR flux inside MCs with B > 18 nT. On the other hand, the superposed epoch analysis of slow and medium speed ICMEs suggests that these ICMEs only cause one-step Fds, as they show a gradual recovery phase beginning at the start of the magnetic ejecta.
To date, very few studies have addressed GCR modulation by ICMEs in the innermost heliosphere, and even fewer have considered Fds associated with the same ICME at multiple heliocentric distances. Prior to our paper, the only studies of Fds inside Earth's orbit were conducted with Helios 1 and 2 observations. Blanco et al. (2013) studied 19 Fds associated with different magnetic clouds between 0.3 and 1 au using Helios observations, and found an average GCR flux drop of 10% during the Fds studied for these events. A recent study by Witasse et al. (2017) used data from multiple spacecraft to study the Fd signature of a single ICME as it propagated through the outer heliosphere, past Mars, comet 67P, and Saturn. They found that the closer to the Sun, the deeper, shorter, and steeper the Fds are.
For the first time, we have observations of Fds associated with the same ICME event at three different planets in the inner heliosphere. Due to the close longitudinal alignment between Mercury and Earth/Moon, and near longitudinal alignment with Mars (within 30°), the ICME launched from the Sun on 2014 February 12 reached all three planets. Fds in the GCR count rates were observed at all three locations: by MErcury Surface, Space ENvironment, GEochemistry, and Ranging (MESSENGER) at Mercury, by Lunar Reconnaissance Orbiter (LRO) at the Moon, and by Mars Science Laboratory (MSL) at Mars. The ICME was also observed at Venus; however, due to the lack of space weather data from Venus Express (VEx), we only use the magnetic field observations from VEx to confirm that the ICME did indeed propagate in the Venus-Earth-Mars direction. In this paper, we investigate how the GCR modulation changes as the ICME propagates through the inner heliosphere. This study sheds light on the environment about to be explored by the upcoming Parker Solar Probe (Fox et al. 2015) and Solar Orbiter missions (Muller & Cyr 2013).
2. ICME
The DONKI database, or Space Weather Database of Notifications, Knowledge, and Information https://kauai.ccmc.gsfc.nasa.gov/DONKI, lists two CMEs that, due the timing of their launch from the Sun and longitudinal direction, are possible counterparts for the ICME in question. Both CMEs were launched from the Sun on 2014 February 12, the first at 5:48 UT with a longitude of 8°, latitude of 10°, and speed of 755 km s−1, while the second was launched at 13:09 UT, with a longitude of 26°, latitude of 36°, and speed of 620 km s−1. We simulated the propagation of both CMEs using the Wang-Sheeley-Arge (WSA)-Enlil model (Odstrcil 2003) with cone extension (see below for more details; simulation results are only shown for the first CME). The ICME arrival times of the second CME are more than 12 hr behind at Mercury, and ∼24 hr behind at Earth and Mars, compared to the observations. Given the higher latitude angle, and thus the out-of-ecliptic directed nature, of the second CME and the significant lag in arrival times from the WSA-Enlil model, the first CME is a more likely match for the ICME discussed in this study. We thus use it as the CME counterpart for this event for the rest of the paper. We note that this CME selection is an update on our ICME database presented in Winslow et al. (2015), where we used the second CME as the counterpart for this ICME.
Due to the close longitudinal alignment of the inner solar system planets at the time, the ICME reached Mercury on 13 February (at 4:51 UT as observed in the magnetic field data), Venus on 14 February (at 10:02 UT from magnetic field data), Earth on 15 February (at 12:35 UT from plasma and magnetic field data), and Mars on 18 February (at 03:24 UT detected from the Fd in the GCR data). During this time, Mercury and Earth were aligned within ∼5°, while Earth, Venus and Mars were aligned within ∼30°.
Figure 1 shows the planets' location in the ecliptic plane, as well as the WSA-Enlil model with cone extension simulated propagation of the ICME at three different time steps of interest: when reaching Mercury, Earth, and Mars. These simulations are used to further support the ICME arrival at all four inner solar system planets and are not meant for precise timing of the arrival. The simulations were run at the Community Coordinated Modeling Center (https://ccmc.gsfc.nasa.gov/), with the run number Reka_Winslow_112117_SH_1 and model version number 2.8f. The model input parameters for CME launch time, speed, and direction were the same as specified above for the CME, while the CME half width was 60°. The figures show normalized solar wind density in the ecliptic plane as a function of longitude, with the black contour denoting the original CME inserted into the simulation. The density enhancement in front of the black contour represents the piled up ICME sheath material. From Figure 1, it can be seen that the simulated ICME arrival time is quite accurate (within ∼1 hr of measured arrival time) at Mercury and Earth, but it is ∼10 hr ahead at Mars.
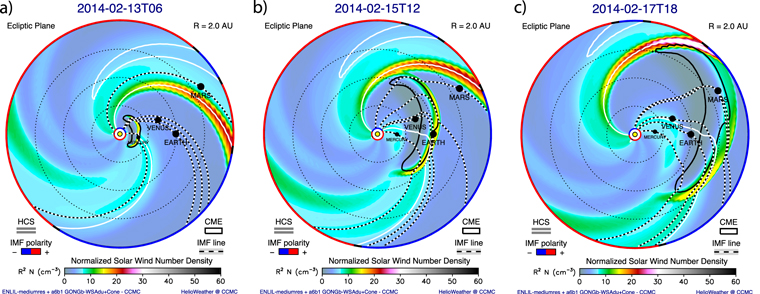
Figure 1. WSA-Enlil model simulation with CME cone extension of the ICME and solar wind number density at three different time steps: when it reached Mercury (a), Earth (b), and Mars (c). The black contour denotes the original CME inserted into the simulation.
Download figure:
Standard image High-resolution imageFigures 2(a) and (c) show the ICME at Mercury from MESSENGER magnetic field observations. The arrival of the ICME shock (at 4:51 UT on 2014 February 13), the ME (at 8:19 UT on 2014 February 13), and the end of the ICME (at 16:56 UT on 2014 February 13) are marked by vertical magenta lines. From Figure 2(a) it is evident that the ICME significantly distorted both the interplanetary magnetic field (IMF) and Mercury's magnetosphere, as an enhanced and turbulent magnetic field is observed during the ICME passage both outside and inside the magnetosphere. As solar wind plasma data is not available from MESSENGER, we estimate the ICME speed from the timing of the CME launch and the ICME arrival at Mercury at 0.332 au, which yields a shock transit speed of ∼600 km s−1 and an ME transit speed of ∼520 km s−1. Using the drag-based model (Vrsnak et al. 2013) to obtain an additional ICME speed estimate at Mercury, we find an estimated local shock speed of ∼550 km s−1 with an arrival time of 1:40 UT (3 hr early), where the input initial speed used was 755 km s−1 (taken from DONKI), the drag parameter was 0.6 × 10⁻⁷ km−1, and the solar wind speed was 380 km s−1.

Figure 2. Magnetic field ((a) and (c)) and GCR measurements ((b) and (d)) at MESSENGER. (a) A number of MESSENGER passages of Mercury's magnetosphere are shown in the magnetic field data for context, including the one that was significantly affected by the ICME (unshaded region). Vertical magenta lines denote the crossing time of the ICME shock, magnetic ejecta, and ICME end. (b) MESSENGER NS GCR count rate is shown around the time of the ICME passage, including the Fd. The data gaps in the GCR data ((b) and (d)) correspond to a spacecraft altitude lower than 3000 km, below which the planet blocks a significant fraction of the GCR flux. Close-up view of the ICME region in the magnetic field (c) and GCR (d) observations. The gaps in (c) correspond to MESSENGER's passage through Mercury's magnetosphere and subsequent encounters with Mercury's bow shock.
Download figure:
Standard image High-resolution imageFigure 3 shows the ICME at Venus from VEx magnetic field observations. Using the drag-based model with the same input parameters as at Mercury, yields an ICME speed of ∼460 km s−1 and an ICME arrival time of 10:35 UT on 2014 February 14, only 30 minutes later than observed in the magnetic field data. These observations along with the drag-based model results confirm that the ICME passed by Venus as expected; however, due to the lack of space weather data from VEx, the remainder of the paper is focused on observations at Mercury, Earth, and Mars.

Figure 3. Magnetic field observations from Venux Express showing the ICME arriving on 2014 February 14.
Download figure:
Standard image High-resolution imageThe ICME observations at Earth by ACE and Wind are shown in Figure 4. The ICME shock arrived at 12:35 UT on 2014 February 15 with a speed of ∼470 km s−1, as evidenced by the jump in the magnetic field magnitude, B, the plasma speed, v, as well as the plasma temperature, T. The plasma number density, n, exhibited a more gradual increase after the ICME shock. The arrival of the ME at 3:45 UT on 2014 February 16 was marked by a decrease in B fluctuations and a smooth rotation in the field, as well as by decreases in n and T. The end of the ICME was marked by a reverse shock at 5:12 UT on 2014 February 17. The drag-based model with the same parameters as was used at Mercury yields an ICME arrival time of 12:50 UT on 2014 February 15 with a speed of 430 km s−1, very close to the measured values as quoted above.
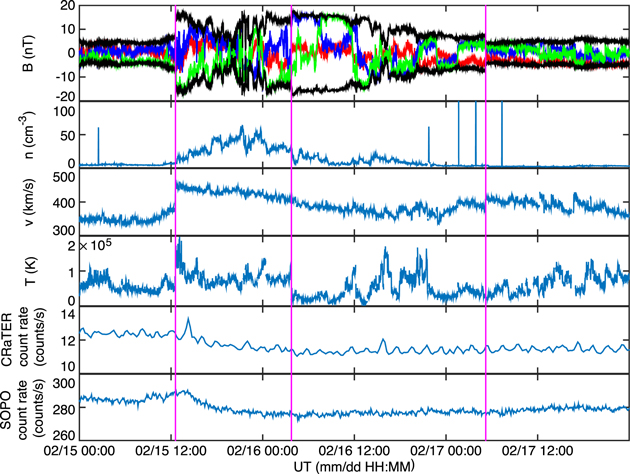
Figure 4. ICME observations by ACE/Wind, and Forbush decrease observations by LRO and the SOPO Neutron Monitor. Panels from top to bottom: magnetic field magnitude and components in RTN coordinates (same color code as in Figure 2) at ACE, plasma number density at Wind, plasma speed and temperature at ACE, and GCR count rate measured by CRaTER at LRO and the South Pole (SOPO) neutron monitor on Earth.
Download figure:
Standard image High-resolution imageDue to the lack of magnetic field observations available at this time at Mars, we can only infer the arrival of the ICME from the beginning of the Fd in the GCR observations at 3:24 UT on 2014 February 18. Extending the drag-based model all the way to Mars at 1.657 au, with the same parameters as was used at Mercury and Earth, we find an ICME arrival time of 5:50 UT on 2014 February 18 (i.e., 2.5 hr late) with a shock speed of 410 km s−1. This very short, 2.5 hr delay between the predicted ICME arrival time and the drop in GCR flux confirms that this ICME caused the Fd at Mars. The Fds in the GCR data at each planet will be discussed in detail in the next section.
3. Forbush Decrease
At Mercury, we use 5 minutes resolution MESSENGER Neutron Spectrometer (NS; Goldsten et al. 2007) measurements as a proxy for the GCR flux. NS is not a dedicated GCR sensor, as it was designed for the detection of neutrons from Mercury's surface. However, the neutrons from Mercury's surface are produced through nuclear spallation reactions from GCRs hitting the planet's surface (e.g., Peplowski et al. 2011; Evans et al. 2012; Lawrence et al. 2013), and in order to analyze the planetary neutron observations, the data needed to be corrected for the time-varying GCR flux (Lawrence et al. 2004; Maurice et al. 2004). This time-varying GCR flux has been characterized with MESSENGER NS measurements. Using the count rate of charged particles that deposited energy in all three scintillators of NS, i.e., the triple-coincidence count rate, the highest energy particles can be detected. From instrument modeling, it was shown that this triple-coincidence count rate measures the integral flux of protons and alpha particles greater than 125 MeV/nucleon, and can therefore be used as a proxy for the GCR flux at Mercury (Lawrence et al. 2013, 2014, 2016a, 2016b).
These GCR measurements from MESSENGER have recently been used by Lawrence et al. (2016b) to characterize long-term GCR flux variations at Mercury in comparison with 1 au observations. In order to obtain the GCR proxy from the NS measurements, two modifications were applied to the triple-coincidence observations: (1) the removal of solar energetic particle (SEP) events, and (2) applying an altitude threshold >3000 km to the data because Mercury obscures GCR protons from reaching the spacecraft. For in-depth details on processing the NS charged particle measurements to obtain the GCR proxy data, the reader is referred to Lawrence et al. (2016b).
Figures 2(b) and (d) show the triple-coincidence GCR count rate at Mercury, with 2(b) showing an extended period of time around the ICME passage, and 2(d) zooming in on the ICME time. Here, the data were smoothed to 10 minutes resolution. The decrease in GCR count rate is noted immediately after the ICME shock arrival, followed by a short plateau prior to the ME arrival. A second decrease in count rate is noted coinciding with the ME arrival, indicating a two-step Fd at Mercury. Furthermore, the GCR count rate reaches its minimum just after the ICME passage. This is likely due to the fact that because GCRs are coming from outside of the solar system toward the Sun (and therefore toward Mercury), as the ICME expands past Mercury it shields a larger region from the GCRs. The GCR count rate recovers to pre-ICME levels by ∼16:00 UT on 2014 February 15 (in 59.2 hr).
To characterize the GCR flux at 1 au, we use relative dose variations from the Cosmic Ray Telescope for Environmental Radiation (CRaTER) on the Lunar Reconnaissance Orbiter (LRO; Spence et al. 2010). The CRaTER GCR measurements are ideal to compare to the MESSENGER NS measurements because (1) the CRaTER data are taken from lunar orbit, i.e., outside of Earth's atmosphere, and mostly outside of the Earth's magnetic field and therefore largely unaffected by magnetospheric effects (Huang et al. 2009; Case et al. 2010), and (2) particles of a similar energy range to those detected by the MESSENGER NS can be observed.
For the purposes of this study, to most closely match the energy range of the particles detected by MESSENGER, we use the CRaTER D5-D6 dose rate, converted to a count rate, which register particles passing through the entire length of the CRaTER instrument into the D5 or D6 detectors and are thus sensitive to GCR protons >100 MeV (Spence et al. 2010). These data have been averaged to a resolution of 15 minutes (see Figure 4).
Because each CRaTER thin/thick detector pair has some overlap in coverage, the process described in Appendix A of Schwadron et al. (2012) is applied to prevent particles from being counted twice. The D5-D6 count rate shown here is a simple count of the number of particles that meet this criteria in the calculation of the dose rate. Prior to this study, it was found that the altitude factor described by Schwadron et al. (2012) that has typically been applied to CRaTER dose rates does not completely remove the effects of varying altitude from the orbit of LRO from CRaTER data and may introduce unwanted artifacts in the data.
For this study, a simple Fourier series process has been used to remove the altitude effect from the D5-D6 count rate. Over short time periods, the altitude of LRO behaves like a simple sine wave. For a chosen interval of data, the mean altitude is subtracted from the raw altitude data, which is then divided by its maximum value to provide a normalized sine wave centered at zero. The dot product of the count rate data over this interval with the normalized altitude sine wave provides the Fourier coefficient. A Hann window is applied in the dot product to minimize edge-effects from the discontinuity at the ends of the selected data interval (i.e., the Gibbs phenomenon). The oscillating portion of the count rate caused by the varying altitude is obtained by multiplying the normalized altitude wave by the Fourier coefficient, which is then subtracted from the raw count rate data to provide the altitude-corrected count rate. This method seems to be effective in removing altitude effects from the CRaTER data over periods in which the count rate varies slowly and the altitude varies in a well-defined manner.
To confirm our GCR observations by CRaTER at the Moon, we also looked at data from dozens of neutron monitors from Earth's surface, available through the Neutron Monitor Database (http://www.nmdb.eu). As a representative example of these observations, the last panel of Figure 4 shows 5 minutes resolution data by the South Pole Neutron Monitor (SOPO). These observations are well-matched by the CRaTER data, and in particular, in both the CRaTER and SOPO data, the decrease in GCR count rate starts ∼2 hr after the ICME shock arrival (see Figure 4).
For reference, we note that the ACE and Wind spacecraft are at a Geocentric Solar Ecliptic (GSE) x coordinate of 220 RE, where RE is the Earth's radius, while LRO is at x = −50RE. The time lag between the Fd start time and the ICME shock passage is not explained by the propagation time from ACE/Wind to LRO, not only as this is shorter than 2 hr, but also because the lag is seen in the SOPO data as well. Similarly to the event analyzed here, Jordan et al. (2009) also studied an Fd event where the start of the Fd occurred in the ICME sheath and not at the shock. They attribute the start of the Fd to a planar magnetic structure in the sheath, in which the magnetic field varies strictly in a plane. It has been recently found that planar magnetic structures are ubiquitous in ICME sheaths (Palmerio et al. 2016). In the case of our ICME, from a simple analysis of the magnetic field latitude versus longitude we find that the entire ICME sheath region exhibits a planar structure, and thus it is not the planar structure that causes the delay.
The time lag is likely explained however, by the lack of significant change in density and magnetic field direction immediately after the shock from the solar wind/IMF values. The slow increase in density after the ICME shock and the lack of high magnetic field variability in the initial part of the sheath may have allowed the GCRs to penetrate deeper into the sheath than what would be expected from a typically turbulent, high density sheath. The latter part of the sheath does exhibit high density and field variability, and the GCR count rate decreases significantly in that region. This indicates that the "strength" of the ICME sheath plays a role in modulating GCRs as well. There is no second drop in count rate observed near the ME arrival, thus only a one-step Fd is apparent at the Earth/Moon. Moreover, recovery of the GCR count rate begins already in the ME portion of the ICME and is finished by ∼10:30 UT on 2014 February 18 (in 69.9 hr).
The GCR observations at Mars are taken from the Radiation Assessment Detector (RAD) Hassler et al. (2012) on board the Mars Science Laboratory's (MSL) Curiosity rover (see Figure 5, red curve). RAD measures the energy spectra of energetic charged and neutral particles along with the radiation dose rate at the surface of Mars. Due to the large geometric factor and high cadence of data collection, the dose rate (deposited energy rate per unit mass: J/kg/day) measured in the plastic detector is a good proxy for GCR fluxes and Fds. The MSL RAD raw data have strong diurnal variations (Rafkin et al. 2014). In order to detect Fds, the data was processed by binning into 44 points/day bins, and a notch filter, tuned to remove all harmonic multiples of 1 sol (i.e., 1 Martian day), was applied to the measurements. Solar energetic particle events were also removed from the data.
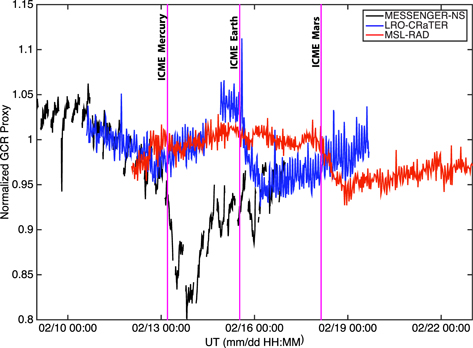
Figure 5. Normalized GCR measurements a the three locations: Mercury (black), the Earth/Moon (blue), and Mars (red). The vertical magenta lines indicate the ICME arrival at the three locations. The short gap in the CRaTER data just before the Fd corresponds to the time of the SEP signal that was removed from the observations.
Download figure:
Standard image High-resolution imageThe dose rate measured by RAD on the Martian surface is mainly due to GCRs with energies exceeding the atmospheric cutoff of ∼150 MeV/nuc as well as the secondaries created by their interaction with the Martian atmosphere and regolith (Guo et al. 2017). A recent study by Guo et al. (2018), of the statistics and properties of Fds at Mars, compared MSL RAD and MAVEN SEP measurements over two years; it showed that there is a systematic difference between the magnitudes of Fds within and outside the Martian atmosphere. This difference may be attributed mainly to (1) the energy-dependent modulation of GCR particles by the passing-by ICME (e.g., Cane 2000; Lingri et al. 2016), and (2) to the Martian atmosphere. Specifically, an RAD measured Fd on the surface of Mars in dose rate, approximately corresponds to an Fd of interplanetary GCRs (energies greater than 100 MeV/nuc) with a slightly larger amplitude (Guo et al. 2018). On average, they found that a factor of ∼1.33 can be applied to the MSL/RAD measured Fd size in order to recover the Fd outside the Martian atmosphere. MAVEN did not reach Mars until 2014 September; therefore, only Martian surface measurements from MSL are available for our study.
Similarly to the CRaTER observations, only a one-step Fd is observed at Mars starting at 3:24 UT on 2014 February 18. Given the lack of magnetic field data at Mars, we do not have information about either the changes in the solar wind turbulence properties behind the ICME shock, or the arrival times of the ICME substructures. Therefore, we cannot determine if and/or how the diffusion coefficients of the GCRs were affected, and what part of the ICME (shock, sheath, or magnetic ejecta) is coincident with the start of the Fd. The recovery of the pre-ICME GCR dose rate begins soon after the maximum depression is reached. However, it is likely that a second ICME arrived at Mars soon after the one studied here, as a second Fd is observed beginning on 2014 February 23, causing a delay in the recovery. Due to this delay, the pre-ICME GCR dose rate is reached by ∼18:00 UT on 2014 February 26 (in 206.6 hr).
We normalized the GCR flux proxy at each spacecraft by the average count rate/dose rate level over a 3–5 day period prior to the ICME arrival. The length of time over which the average was calculated was chosen to exclude large deviations in flux, so these periods did not have the same duration at all spacecraft. In keeping with this philosophy, the SEP event observed by CRaTER between ∼11:50 UT and ∼21:30 UT on 2014 February 14 (not shown here) was removed from the data before averaging. The normalized GCR proxy at all three spacecraft are shown in Figure 5.
In order to minimize the effects of outliers, we estimate the size of the Fd, or the percent drop in the GCR flux proxy, by calculating the average of the normalized proxy in the region of high count rate/dose rate before the drop, subtracting the average of the region of low count rate/dose rate immediately after the drop, and dividing by the high flux proxy average. The length of the regions used are ∼0.5–1 day. We found an average Fd size of ∼15% at Mercury, ∼9% at the Moon, and ∼6% at Mars, where the Mars value includes the correction factor for the atmosphere. Characteristics of the Fds at the three locations, including the slopes of the Fds are listed in Table 1.
Table 1. Characteristics of the Fds at Mercury, Earth/Moon, and Mars
| Magnitude of Decrease | Duration of Decrease (hr) | Slope of the Decrease | |
|---|---|---|---|
| Mercury | 15% | 59.2 | −0.16 (Fd1: −0.21; Fd2: −0.37) |
| Earth/Moon | 9% | 69.9 | −0.12 |
| Mars | 6% | 206.6 | −0.07 |
Note. At Mercury, for the slope of the Fd, we give the value for the case when the Fd is treated as a one-step Fd, and in brackets we also give the values for a two-step Fd, with the slopes given separately for each step.
Download table as: ASCIITypeset image
4. Discussion and Conclusions
From Figure 5 and the estimated Fd sizes, our results strengthen the assertion of Witasse et al. (2017): the closer to the Sun, the steeper and larger the depth of the Fd. Figure 6 shows the estimated Fd size both from our study and that of Witasse et al. (2017) as a function of heliocentric distance on a logarithmic scale. The linear nature of the points associated with our study and the near-linear behavior of the points from Witasse et al. (2017), hint at the fact that the Fd size likely decreases exponentially with heliocentric distance. Given the small number of points, however, this inference must be further tested with larger data sets in the future. It is important to note that in the Witasse et al. (2017) study, the ICME was likely flank arrival at Mars and comet 67P, and closer to a direct arrival at Saturn. This may have caused the relatively larger Fd size at Saturn, and therefore the departure from an exponential decrease of the Fd size in their study. Similarly, in our study, the ∼30° longitudinal separation of Mars from the Mercury–Earth line may affect the measured Fd size, as a different portion of the ICME is crossed at Mars than at Mercury and Earth. It remains to be seen with further observations from Parker Solar Probe and Solar Orbiter if the exponential decrease with distance observed in our case study is common in ICMEs close to the Sun. We also note that the offset between the points in our study and that of Witasse et al. (2017) clearly indicates that variation in Fd size in not explained by distance alone, but is likely also dependent on a number of ICME parameters, including speed, shock strength, and magnetic field strength in the ME.

Figure 6. Fd size plotted as a function of heliocentric distance for measurements from this study as well as those taken from Witasse et al. (2017) shown on a logarithmic distance scale. The offset between our data points and that of Witasse et al. (2017) is due to the difference in "strength" of the two ICMEs studied.
Download figure:
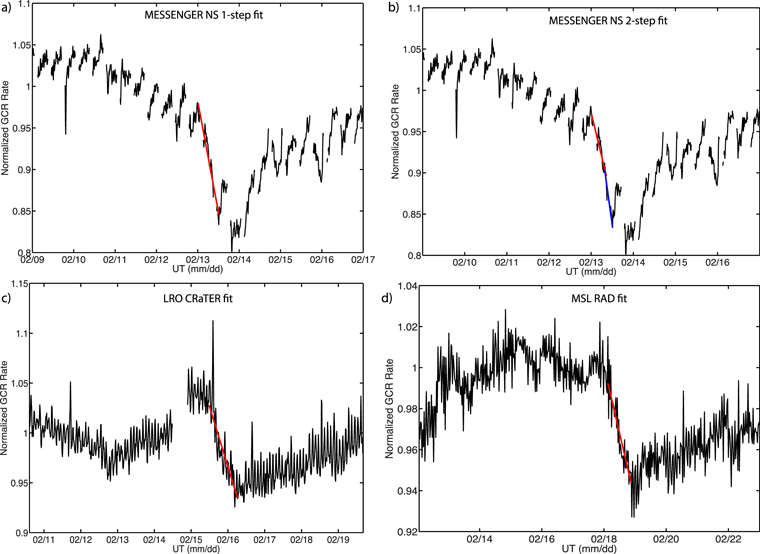
Standard image High-resolution imageIn terms of the steepness of the Fds, we fit linear models through a robust fitting technique to the normalized GCR flux proxy drop and thereby established the slopes of the Fds (see Table 1 for values as well as Figure 7 for the fits). Our results indicate that the Fd slope becomes shallower with distance from the Sun; the slope at Mercury was evaluated both as a one-step and as two-step Fd (see values in brackets in Table 1), in either case, the slope there is steeper than at the two other planets.
Figure 7. Linear fits to the normalized GCR flux proxy drop at Mercury (a, b), Moon (c), and Mars (d). The slope at Mercury was evaluated both as a one-step (a) and as a two-step (b) Fd.
Download figure:
Standard image High-resolution image
Historically, models of Fd shape and size have focused on modeling either the ICME shock effects or ME effects, but not both, due to the complexity of the problem. The simple model of Cane et al. (1995), Vanhoefer (1996), Richardson & Cane (2011) of ME effects, which takes into account particles entering the closed magnetic structure of the ejecta through perpendicular diffusion, solves the diffusion equation only. This model suggests that the maximum GCR depression inside the magnetic cloud decreases monotonically with the product Bva2, where B is the magnetic field magnitude inside the ICME, v is the ICME speed, and a is the flux rope radius. This suggests that the size of the Fd should be smaller for ICMEs that are slower and smaller, have weaker magnetic fields, and are further from the Sun, which is in good agreement with our observations. This model is also in line with our observation that there is a larger change in Fd size from Mercury to Earth than from Earth to Mars due to the larger change in magnetic field strength between the two distances. From our observations, there is a factor of ∼10 difference in magnetic field strength in the magnetic ejecta between Mercury and Earth, while we only expect a factor of ∼2 difference between Earth and Mars (assuming the B versus heliocentric distance relationship found in Winslow et al. (2015) holds past 1 au).
Models that account for the ICME shock effects on Fds have focused on solving the diffusion-convection equation (e.g., Bland 1976; Nishida 1982), using a pulse of enhanced solar wind velocity and reduced diffusion coefficient to simulate a shock wave moving radially outward from the Sun. Most recently, Luo et al. (2017) constructed a more complex three-dimensional (3D) numerical model for Fds using a 3D diffusion barrier to simulate the ICME shock, which they incorporated into a stochastic differential equation based time-dependent cosmic ray transport model. They used the model to simulate Fd profiles at increasing heliocentric distances, simulating the ICME shock propagating outward in the solar system. Figure 6 of their paper illustrates the results that the Fd size (1) decreases with increasing radial distance, (2) drops off very sharply and non-linearly with distance prior to ∼2 au, (3) depends less on the radial distance as the distance increases, and (4) oscillates with radial distance due to the ICME shock interacting with the oscillating profile of the heliospheric current sheet. Their simulation predicts that the oscillation of the Fd size, as well as the weakened dependence on distance, are only noticeable past 2.5 au, which is beyond our observations in this paper.
The fact that a two-step Fd is observed at Mercury while only a one-step Fd is seen at the Earth/Moon is an interesting result given the close longitudinal alignment between Mercury and Earth during this time. The observed difference in GCR modulation is therefore not likely due to the spacecraft having crossed different ICME regions at the two locations. This change from a two-step to a one-step Fd however, is likely explained by the difference in the ICME magnetic field strength at the two locations. At 1 au, Masias-Meza et al. (2016) found that high B in the ME can cause a second drop in the GCR flux, where they define "high" as B > 18 nT. For the ICME in our study, this requirement is only met at Mercury, although it is important to note that Masias-Meza et al. (2016) established the requirement at 1 au, and it remains to be seen whether it can be applied at different heliocentric distances. Our study hints at the possibility that two-step Fds may be more common closer to the Sun due to the likely stronger GCR modulation by ICMEs as a result of the increased magnetic field strength in the ME. This hypothesis is directly testable with data from the upcoming Parker Solar Probe and Solar Orbiter missions in conjunction with analysis of Fds available from the MESSENGER NS data set.
At 1 au, the observed one-step Fd and the fact that the GCR flux proxy begins recovery inside the ME, fit well with the GCR flux behavior of slow-to-medium speed ICMEs observed by Masias-Meza et al. (2016). At Mars, the observed one-step Fd can likely be attributed to two factors: (1) the decreased ICME magnetic field strength, and (2) the ∼30° longitudinal separation between the Mercury–Earth line and Mars. It is thus likely that a different portion of the ICME was observed at Mars than at Mercury or Earth. Shocks have a greater longitudinal extent than ejecta (Cane 2000), so it is possible that only the shock crossed Mars, which may be another reason why only a one-step Fd is observed there.
In conclusion, through observational work, we investigated how an Fd evolves in time and radial distance, from the near-solar region (unexplored since the 1980s) to 1 au and to Mars. The results from this case study suggest that in addition to the ICME shock, the magnitude of the ICME magnetic field as well as the "strength" of the ICME sheath play a large role in modulating GCRs and in determining the size of the Fd. Furthermore, the Fd size and slope are also strongly affected by the heliocentric distance. Based on our results, we hypothesize that (1) the Fd size falls off exponentially with distance near the Sun, and (2) that two-step Fds may be more common closer to the Sun due to the stronger ICME magnetic field there. Both of these hypotheses will be directly testable with the planned Parker Solar Probe and Solar Orbiter missions. Our investigation provides a glimpse into the inner heliosphere environment about to be explored by these upcoming missions.
Support for this work was provided by the NASA Lunar Reconnaissance Orbiter Project (NASA contract NNG11PA03C), as well as NSF grant AGS1622352. We also thank the International Space Science Institute for supporting the Research Team: Radiation Interactions at Planetary Bodies (http://www.issibern.ch/teams/interactplanetbody). R.M.W. acknowledges support from NASA grant NNX15AW31G and NSF grant AGS1622352. N.L. acknowledges support from NASA grants NNX15AB87G and NNX13AP52G. D.J.L. acknowledges support from the NASA MESSENGER Participating Scientist and Discovery Data Analysis programs (grants NNX08AN30G and NNX16AI98G). J.G. and R.F.W.S. acknowledge support from the German Space Agency (DLR) under grants 50QM0501, 50QM1201, and 50QM1701. MESSENGER data are available on the Planetary Data System (https://pds.jpl.nasa.gov). ACE and WIND data are available on the Space Physics Data Facility's Coordinated Data Analysis Web (https://cdaweb.sci.gsfc.nasa.gov). The LRO CRaTER data is available at http://crater-web.sr.unh.edu/. The MSL RAD data are archived in the NASA Planetary Data Systems Planetary Plasma Interactions Node at the University of California, Los Angeles and the PPI node is hosted at https://pds-ppi.igpp.ucla.edu/. We acknowledge the NMDB database (http://www.nmdb.eu) founded under the European Union's FP7 programme (contract No. 213007), and the PIs of individual neutron monitors for providing SOPO data. Simulation results (run number Reka_Winslow_112117_SH_1) have been provided by special request from the Community Coordinated Modeling Center at Goddard Space Flight Center through their public Runs on Request system (http://ccmc.gsfc.nasa.gov). The WSA model was developed by N. Arge (NASA/GSFC), and the Enlil model was developed by D. Odstrcil (GMU).