


Abstract
We report our plasma rate coefficient and branching ratio measurements for dissociative recombination (DR) of  with electrons. The studies were performed in a merged-beams configuration using the TSR heavy-ion storage ring located at the Max Planck Institute for Nuclear Physics in Heidelberg, Germany. Starting with our absolute merged-beams recombination rate coefficient at a collision energy of ≈0 eV, we have extracted the cross section and produced a plasma rate coefficient for a translational temperature of ≈8 K. Furthermore, extrapolating our cross-section results using the typical low-energy DR behavior, we have generated a plasma rate coefficient for translational temperatures from 5 to 500 K. We find good agreement between our extrapolated results and previous experimental DR studies on
  . Additionally, we have investigated the three fragmentation channels for DR of
  . Here we report on the dissociation geometry of the three-body fragmentation channel, the kinetic energy released for each of the three outgoing channels, the molecular internal excitation for the two outgoing channels that produce molecular fragments, and the fragmentation branching ratios for all three channels. Our results, in combination with those of other groups, indicate that any remaining uncertainties in the DR rate coefficient for
  appear unlikely to explain the observed discrepancies between the inferred abundances of HCl and
  in molecular clouds and predictions from astrochemical models.
Export citation and abstract BibTeX RIS
1. Introduction
Although the abundance of chlorine in space is rather low, the chemistry of chlorine-bearing molecules in the interstellar medium (ISM) has attracted a lot of attention over the years (e.g., Dalgarno et al. 1974; Jura 1974; Blake et al. 1986; Federman et al. 1995; Amin 1996; Sonnentrucker et al. 2006; Neufeld & Wolfire 2009; Lis et al. 2010; De Luca et al. 2012; Neufeld et al. 2012, 2015; Lanza et al. 2014; Majumdar et al. 2014; Muller et al. 2014). HCl has been of particular interest. We discuss this below and also briefly summarize the reactions thought to lead to HCl in the ISM, with an emphasis on one of the key remaining uncertainties in the relevant chemical network.
The ionization potential of Cl at 12.97 eV lies below that of atomic hydrogen. Thus, in the illuminated portions of molecular clouds, photoionization of neutral atomic H does not shield neutral atomic Cl from the interstellar radiation field. As a result, atomic chlorine is predominantly found in the form of Cl+, which reacts with H2 via hydrogen abstraction,

This reaction is exoergic and unique in that all other singly charged atomic ions react endoergically with H2. The resulting HCl+ can then react exoergically with H2 to form H2Cl+ via

Finally, H2Cl+ undergoes dissociative recombination (DR) with an electron leading to three possible outgoing channels:


The first of these three channels leads to HCl, and the corresponding  DR branching ratio is one of the key remaining uncertainties in the HCl formation network.
H2Cl+ has been detected in the ISM by the Herschel Space Observatory (Lis et al. 2010; Neufeld et al. 2012). Since then,  has also been detected by Muller et al. (2014) using the Atacama Large Millimeter/submillimeter Array. Additionally, the isotopologues
  and
and  have been observed (Muller et al. 2014; Neufeld et al. 2015), and the deuterated isotopologues,
  and
and  , are predicted to be detectable in future observations (Majumdar et al. 2014).
Surprisingly, despite the simplicity of the astrochemistry, the inferred HCl and H2Cl+ abundances are factors of ∼3–5 larger than predicted (De Luca et al. 2012; Monje et al. 2013; Neufeld et al. 2015). A possible explanation for the discrepancies between observations and models may be the lack of reliable DR data for H2Cl+. Neufeld and collaborators emphasize that the branching ratio is unknown for DR of  , i.e., reaction (3). They therefore arbitrarily set it to a value of 10%, which best explained the observations, and from their modeling concluded that the HCl column density is essentially linearly proportional to this branching ratio.
The DR process was studied in 2009 for the isotopologue  using the CRYRING storage ring (Larsson et al. 1995) by W. Geppert et al. (2009, private communication). Their preliminary DR rate coefficient, summed over the fully deuterated versions of channels (3)–(5), is about three times lower compared to typical polyatomic ions. Their value was adopted in the latest astrochemical models (Neufeld & Wolfire [2009] and later). The total DR rate coefficient for the isotopologue
  was derived by Kawaguchi et al. (2016) in their study based on absorption spectroscopy in a pulsed discharge plasma. Their value is a factor of three lower than that for
  obtained at CRYRING, and nearly an order of magnitude below that typical for polyatomic ions. More recently, Wiens et al. (2016) measured the total DR rate coefficient of
  and
and  in a flowing afterglow apparatus. Their
  results are in reasonable agreement with those from CRYRING. However, for
  the findings of Wiens et al. are nearly an order of magnitude greater than the data of Kawaguchi et al. Further experimental studies are needed to resolve these discrepancies.
Also still unknown are the values for the various fragmentation-channel branching ratios. None of the above measurements were able to determine the branching ratios. Indeed, we are unaware of any existing experimental or theoretical studies that provide this information.
To help address the need for reliable DR rate coefficients and branching ratios for H2Cl+, we have carried out new measurements. For technical reasons, discussed below, we have used the isotopologue  . The rest of this paper is organized as follows. The
  molecular structure and possible DR pathways are discussed in Section 2. The experimental setup, measurement method, and data analysis are reviewed in Section 3. In Section 4 we present our experimental results, including the merged-beams DR rate coefficient for
  , the derived Maxwellian plasma DR rate coefficient, the fragmentation branching ratios among the three outgoing channels, the DR product state distributions, and the dissociation geometries for the outgoing three-body channel. We discuss our results and their implications for astrochemistry in Section 5. A summary is given in Section 6.
2.
 Molecular Structure

The structure of  and its various isotopologues was explored for
  ,
,  , and
, and  by Araki et al. (2001). The basic properties are similar. Araki et al. (2001) did not present any results specifically for
  , but we expect its structure to be similar to that of the other three isotopologues of
  .
.
An  molecule in the
  electronic ground state forms a triangle with a 94° angle at the chlorine atom and H–Cl bonds 1.3 Å long (Chattopadhyay 2010, and references therein). This bent configuration lies 2.7 eV below the linear configuration with the Cl atom in the middle (Chattopadhyay 2010). This energy is sometimes referred to as the barrier to linearity. In the Franck–Condon region the excited electronic states lie more than 7.5 eV above the ground state (Chattopadhyay 2010).
DR is an exoergic reaction where a molecular cation recombines with a free electron, forming a highly excited neutral molecule above its dissociation limit (Larsson & Orel 2008). This energy excess leads to a rapid dissociation into neutral fragments. Starting from this highly excited state (here of H2Cl), it is the electronic and nuclear dynamics along each of the available dissociation pathways that determine the branching ratios for the various possible fragmentation channels, i.e., which atomic or molecular fragments are created, as well as the internal excitation of each fragment.
In recent years, the potential energy surfaces of H2Cl have been extensively investigated. The motivation behind these studies is the gas-phase reaction

which has been used as a prototypical reaction for more than a century (Alagia et al. 1996; Casavecchia 2000, and references therein). Nowadays, this reaction provides a benchmark for theoretical approaches in chemical dynamics (e.g., Garrett et al. 1981; Alagia et al. 1996; Alexander et al. 2002; Ghosal & Mahapatra 2005; Wang et al. 2008; Simbotin & Côte 2015).
Reaction (6) is endoergic by only ∼0.0252 eV (Bian & Werner 2000). An intermediate state along the reaction pathway involves the formation of an excited H2Cl complex, with a reaction barrier of ∼0.239 eV (Capecchi & Werner 2004). Experimental data on excited states of H2Cl have been obtained by Cl+H2 reactivity studies (e.g., Alagia et al. 1996; Dong et al. 2001; Yang et al. 2015) and by H2Cl− photodetachment measurements (e.g., Ferguson et al. 2002; Neumark 2008).
Unfortunately, the published theoretical and experimental data for the excited states of H2Cl all lie below the  ground state. In DR, it is the excited neutral states lying above the
  ground state that matter most, particularly for the initial step of the DR process. To the best of our knowledge there are no published theoretical or experimental studies for the potential energy surfaces of these neutral excited states. Hence, for the rest of this section we focus on the energetics of the reaction in order to help us interpret our DR data presented later.
The energy released in the DR process goes into the total kinetic energy of the fragments Ek (also known as kinetic energy released [KER]) and into the internal excitation of the fragments. Measuring the KER can be used as a diagnostic to determine the internal energy distribution of the reactants and products.
The available KER depends on the relative electron–ion collision energy E, the initial internal excitation energy of the parent ion  , the total internal excitation energy of the neutral products
  , and the exoergicity E0 of the reaction (assuming that all reactants and products are in their ground states). A general expression for Ek is given by

The exoergicity E0 of the DR process differs for the various fragmentation channels. E0 can be obtained from the various bond energies and ionization energies for the parent and daughter systems, as we discuss below. Information about the internal excitation of the parent ion and neutral products can then be derived from measuring Ek at a known fixed value of E. We discuss this in more detail in Section 4.4.
For  , the structure of which is well studied, the exoergicities E0 for the various DR channels, as well as for the nondissociative channel leading to
  , are
, are


Here we have assumed that all reactants and products are in their ground state. The values of E0 given are based on the HCl proton affinity (Adams et al. 1989) corrected for 0 K (Hunter & Lias 1998), the H ionization energy (Lias et al. 2012), the HCl dissociation energy (Xiao-Niu et al. 2010), and the H2 dissociation energy (Herzberg & Monfils 1961). Hence, for fragmentation we expect two two-body channels and one three-body channel. The estimated uncertainty of given E0 values is ∼0.1 eV. As an aside, we note that the exoergicities of channels (8) and (9) are the same within the precision of the available data.
Deriving the corresponding values of E0 for the  isotopologue is difficult owing to a lack of precise molecular data for the system. For that reason, we have given above the E0 values for the more frequently studied
  . Using the reduced-mass scaling of the zero-point energies, we estimate that the isotopic effects between
  and
and  on E0 are ≲0.1 eV.
Other electron-induced processes with  that generate neutral products (e.g., dissociative excitation) are endoergic by at least ∼5.0 eV. Here, we have limited our studies to collision energies below this value.
3. Experimental
3.1. Storage Ring Setup
We performed electron–ion merged-beams DR measurements at the TSR storage ring of the Max Planck Institute for Nuclear Physics in Heidelberg, Germany. Details on various aspects of the merged-beam technique as used at TSR have been described at length by, e.g., Amitay et al. (1996), Wolf (1999), and Novotný et al. (2013). Here we discuss only those aspects specific to this study.
D2Cl+ ions were produced in a cold-cathode Penning ion source from a mixture of D2 and HCl parent gases. A beam of ions was extracted from the source and brought to a kinetic energy of EB = 2.3 MeV using a Pelletron-type accelerator. A beam of D Cl+ was charge-to-mass selected using an analyzing dipole magnet and then injected into TSR, where it was stored for ≈50 s.
In the interaction region, the stored ions were merged for ∼1.6 m with a nearly monoenergetic electron beam, dubbed the Target (Sprenger et al. 2004). The mean electron beam velocity was matched to that of the ions for the entire storage time. For the first 30 s after injection, the ions underwent a process known as electron cooling (Poth 1990). During this time, elastic collisions of the ions with the low energy-spread (i.e., cold) electron beam transferred energy from the recirculating ions to the single pass electrons. This reduced the ion beam energy spread, thereby enhancing the energy resolution of the measurements. It also narrowed the beam diameter to <2 mm, improving the geometrical collection efficiency of the products.
Our work on D2Cl+ is the first storage ring experiment where electron cooling of ions with a mass-to-charge ratio as high as 41 u/e has been demonstrated. Here u is the atomic mass unit, and e is the fundamental unit of electrical charge. In other storage ring studies much heavier molecules have been stored (e.g., OPCl2+ by Zhaunerchyk et al. 2008), but in that work the ions were not electron cooled. Our success was enabled by the lower energy-spread of our photocathode-generated electron beam, compared to other electron coolers, and the correspondingly stronger cooling force (Orlov et al. 2004, 2009).
The electron beam is parameterized by effective temperatures  and
and  , perpendicular and parallel, respectively, to the bulk electron beam velocity. The magnetic field guiding the electrons expanded adiabatically from the photocathode to the interaction region by a factor of ξ = 20. For these conditions we expect
  meV and
  μeV, based on precise fitting of resonance features in the dielectronic recombination measurement of Lestinsky et al. (2008) and on fragment-imaging spectra in the DR studies of Stützel (2011). The uncertainties quoted here and throughout are given at an estimated 1σ statistical confidence level. The Target was operated with typical electron densities of
  cm−3.
cm−3.
The  ions produced in the discharge are expected initially to possess electronic, vibrational, and rotational excitation. We estimate that much of this excitation radiatively relaxes during the 30 s of electron cooling. We are not aware of any metastable electronic states for
  , and any bound excited electronic states are expected to quickly relax to the ground electronic state. Vibrationally, we expect that the molecule will rapidly relax to the v = 0 vibrational level. Vibrational decay times for asymmetric triatomic molecules are typically in the millisecond range (e.g., H2D+; Miller et al. 1989). Slower decay times are expected for symmetric molecules, but even in those cases laboratory studies find that the molecules radiatively relax to v = 0 within a few seconds (e.g.,
  ; Kreckel et al. 2002). Lastly, while the rotational excitation can potentially radiatively cool into equilibrium with the 300 K blackbody radiation of the TSR chamber, this may not be the case for D2Cl+. Studies on other polyatomics at TSR, such as D3O+ (Buhr et al. 2010a), have found rotational excitations significantly higher than 300 K.
After cooling, the Target was used to measure the DR reaction. The resulting neutral products were not deflected by the first dipole magnet downstream of the Target, but rather continued ballistically into a detector that collected most of the neutrals. For the rate coefficient measurements we used a nonsegmented silicon surface-barrier detector. For the fragment-imaging studies we used a segmented silicon surface-barrier detector.
After ∼20 s of measurement (i.e., ∼50 s after injection), the beam intensity became too low to collect a meaningful signal. At that point the current was renewed with a new injection of ions. The injection-cooling-measurement cycle was repeated for several hours, until the desired statistical level was achieved for the data.
Here we present results for  DR only at matched mean electron and ion beam velocities, i.e., near-zero relative energy. The DR signal, which generally decreases with increasing relative energy, was sufficiently large to separate from the background only for matched velocities. This background predominantly arises from neutrals generated by collision-induced dissociation of the parent ions on the residual gas in TSR and decreases with increasing ion velocity. However, the high mass of
  and the magnetic deflection power of TSR limited the ion velocity achievable. This is to be contrasted with DR studies using lighter ions, for which sufficiently high velocities could be used to reduce the dissociation background to a level where DR measurements versus relative energy are possible.
3.2. DR Rate Coefficient Measurements
We determined the absolute DR rate coefficient using the ion-beam-lifetime method described at length by Novotný et al. (2012). In short, at a fixed center-of-mass collision energy (here zero, i.e., matched ion and electron beam velocities), we compare the exponential ion beam storage lifetime with the Target electron beam on,  , to the lifetime with the electron beam off, τoff. As long as DR is the dominant electron-driven process, then the difference in beam lifetimes is due solely to DR and the experimental merged-beams DR rate coefficient αmb is given by

Here  is the overlap length L of the ion and electron beams in the interaction region normalized by the total storage ring circumference C.
The ion beam lifetimes were determined using as a proxy the neutral fragments coming from the beam. The dominant neutralization process is DR, but there is also a smaller contribution due to neutralizing collisions with the residual gas. The neutrals were detected with a nonsegmented 10 × 10 cm2 silicon surface-barrier detector located ∼12 m downstream of the Target center. The rate coefficients for all neutralizing processes are assumed to be constant versus storage time, along with the detector counting efficiency. Thus, the detector signal versus storage time yields the desired ion beam lifetimes with the Target on and off. Results will be presented in Section 4.1.
3.3. Generating a Plasma DR Recombination Rate Coefficient
Although we have directly measured the absolute DR rate coefficient only at matched electron and ion velocities in merged beams, we can still derive a plasma rate coefficient for a plasma with a Maxwell–Boltzmann distribution for a range of temperatures using the general method described in detail by Novotný et al. (2013). First, we deconvolve the measured DR data, accounting for the effects of the electron beam velocity spread and the beam overlap geometry, and extract the DR cross section. Then, we reconvolve the product of the derived cross section and the collision velocity with a Maxwell–Boltzmann distribution to generate a DR plasma rate coefficient.
The method of Novotný et al. (2013) numerically evaluates a model experimental merged-beams rate coefficient  given by

Here  is the model DR cross section as a function of center-of-mass collision energy E, and v is the electron–ion collision velocity. The term
  is the merged-beams energy distribution in the overlap region of the Target. It is evaluated numerically using a Monte Carlo method and reflects both the beam velocity spreads and the interaction region geometry. To solve for
  , we parameterize the model cross section and iteratively modify the parameters until the resulting
  fits the experimental αmb. The derived
  is then taken as the experimental cross section.
The number of free parameters used to describe  is limited by the number of center-of-mass energies at which αmb was measured. Since for D2Cl+ we only collected data for matched beam velocities,
  can be parameterized by one free parameter only. Here we adopt a functional form to reflect the typical low-energy DR behavior, namely,

where A is the free parameter and s is a fixed slope. Below we adopt a value of s = 1, which is expected for a direct DR process (Larsson & Orel 2008). However, we also explore a range of possible values, as we discuss in more detail in Section 4.2.
The desired plasma DR rate coefficient versus plasma temperature T can then obtained via numerical integration of

Here  is the Maxwell–Boltzmann collision energy distribution at T.
As we show later in Section 4.1, the resulting  depends only weakly on the value of s for plasma temperatures T ≲ 20 K. This is due to the fact that our measurements were performed at relative velocities corresponding to these low temperatures, with the collision energy spread being dominated by the transverse electron temperature
  meV (see Section 3.1). Therefore, our plasma rate coefficient is most reliable at the low temperatures most relevant for astrochemical applications. This is in contrast to other experiments performed at room temperatures that extrapolate their results down to 10 K. Our results will be given in Section 4.2.
3.4. DR Fragment Imaging
3.4.1. Overview
In addition to the the DR rate coefficient, we also determined the branching ratios, excited-state distributions of the products, and dissociation geometries using a fragment-imaging technique (e.g., Amitay et al. 1996; Strasser et al. 2001). For this, we employed the Energy-sensitive MUlti-strip (EMU) detector—a 10 × 10 cm2 segmented silicon surface-barrier detector with 128 horizontal and 128 vertical electrode strips on the front and back side, respectively. This detector is located 9.41 m from the center of the interaction zone. The signals from these strips provide information on the DR fragment positions projected onto the detector plane, which is perpendicular to the ion beam axis in the interaction region. The timing resolution of the detector is not sufficient to provide information about the displacement between the fragments parallel to the ion beam axis. However, the pulse heights provide information on the fragment masses. The detector is described in detail elsewhere (Buhr et al. 2010b) and has been used successfully for DR studies of D3O+, D2H+, DCND+, and NH+ (Buhr et al. 2010a, 2010b; Mendes et al. 2012; Yang et al. 2014). Here we describe only those aspects of the detection method relevant for the present study.
Pre-measurement simulations showed that DR of the conventional H2 35Cl+ isotopologue would result in a large fraction of the H fragments from the H + HCl channel missing the detector, even when the ions were stored at the maximum momentum allowed by the TSR bending magnets. Hence, we chose to use the fully deuterated isotopologue for the parent ion, resulting in a factor of  reduction of the D explosion-cone size compared to H. Additionally, in order to avoid the mass ambiguity between
  and
and  , we selected for the 37Cl isotope, yielding
  Cl+. As a result, most of the D
 Cl+ DR fragments fell within the active detector area for our imaging studies at zero collision energy.
When the multiple products from a single DR event reach the EMU detector, they generate electrical signals on each of the strips they hit. The strips on the front of the detector provide information on the vertical position of the impact, and those on the back provide information about the horizontal position, enabling us to determine the transverse positions of the fragments. The signal pulse height from each strip can be used to determine the kinetic energies of the impacting fragments. From this kinetic energy and the impact velocities in the laboratory frame (nearly identical to those of the parent ions) we can derive the fragment masses and thus assign the fragmentation channel on an event-by-event basis. Normally this reconstruction procedure (Buhr et al. 2010b) results in only a small ambiguity in the impact positions, which we can correct for by simulating the response function of the detector for the given fragmentation process.
For the  studies, we had to address the aspect that the low fragment velocities resulted in kinetic energies for Cl, DCl, and D2Cl fragments (masses 37, 39, and 41 u) that were too closely spaced in energy for the EMU detector to resolve. Conversely, the D and D2 fragments (masses 2 and 4 u) were resolvable in energy. However, for some of the strips the impact energies of the D fragments were below the noise level of the readout electronics. As a result, not all of the D atoms were detected. Moreover, in the D + DCl channel the large KER resulted in some deuterium fragments scattering into a range of solid angle that was not collected by the detector. This is not an issue for the D + D + Cl channel, as the dissociation of the DCl results in a lower KER compared to the D + DCl channel. The combination of these effects and other detector properties (such as signal splitting over neighboring strips; see Section 3.4.3) resulted in some ambiguity in the event-based assignment of the fragmentation channels and, for a non-negligible fraction of events, in the impossibility of such assignment.
An example of the ambiguity arising in the reconstruction procedure due to these technical issues can be seen by considering a D + D + Cl fragmentation event. In some of the instances one of the D fragments was not detected. Additionally, the Cl signal is not distinguishable from that of DCl. In such situations, the event can be misassigned to the D + DCl channel with a certain likelihood. Conversely, if all three fragments are resolved, the assignment of the D + D + Cl channel is unambiguous.
For the present work we have extended the event reconstruction procedure of Buhr et al. (2010b) as we now briefly describe. In the first step the algorithm identifies the number and masses of the fragments, separately on the front and back side of the detector. Since we cannot use the signal from a detector strip to distinguish the heavy fragments (Cl, DCl, D2Cl), we assign only three masses in this phase: D, D2, and "heavy." This assignment procedure also takes into account the detector model, which we discuss further in Section 3.4.3. In events where the fragment number or assigned fragment masses do not match on the front and back side (e.g., owing to a nondetected D fragment on one of the strips), the dissociation channel assignment is not performed. The fraction of these nonassignable events is carried over to the subsequent analysis. For the other events, which have matching front and back fragment signals, we force the algorithm to find the simplest DR interpretation. For example, the algorithm sets the heavy-fragment assignment such that the total mass of the detected fragments is that of  (41 u). In the example with one nondetected D fragment in a three-body event (see the paragraph above) the algorithm would assign the event to the D + DCl channel. Clearly, this assignment is often incorrect. In order to use a statistical interpretation, we introduce the concept of "channel mixing."
Understanding the assignment efficiency and channel mixing is crucial for any further analysis of the imaging data. We derive these parameters using a detailed model of the DR fragmentation event and the detector response function. In short, we use a Monte Carlo method including the detailed detector model to generate a large number of simulated DR events for a single outgoing channel. The resulting strip signals are processed using the same event reconstruction algorithm as for the measured data. The mixing coefficients from the given input channel are given by the ratios between the number of events assigned to a given outgoing channel and the total number of simulated events. We note that with this procedure also the "losses" from nonassignable events are taken into account and are reflected in the mixing coefficients.
This approach can be used to obtain mixing coefficients not only for the total count measured in any given channel but also as a function of the KER in a given channel, versus ion beam position, and for other variables. Using such detailed information, we can reconstruct our measured results to generate branching ratios between the outgoing DR channels, the KER distributions in each channel, and the dissociation geometries in the three-body channel.
More specifically, to analyze the fragmentation, we started by reconstructing the dissociation geometry (fragment momentum correlation; see below) and the distributions of the KER for the three-body channel D + D + Cl (results in Section 4.4.1). Regarding the two-body channels, the KER distribution for  could be obtained separately (Section 4.4.2), while for D + DCl it was obtained (Section 4.4.3) with the help of the results for the three-body channel. Finally, the intensities of the various identified components in the measured momentum distributions, considering the derived geometry and KER distributions, yielded the branching ratios between the fragmentation channels (Section 4.5).
Below we describe in more detail the model and methods used to determine the mixing matrix. The model consists of two parts. Section 3.4.2 describes how we account for  DR and the resulting distributions of fragment positions as they hit the detector. Section 3.4.3 explains how we model the detector and convert the impact positions and fragment masses to strip signals compatible with those measured from the physical detector. Section 3.4.4 discusses how we subtract out the non-DR background. Lastly, Section 3.4.5 reviews how we determine the mixing coefficients, enabling us to extract DR branching ratios.
3.4.2. Fragmentation Model
The Monte Carlo fragmentation model is constructed by stochastically simulating DR event positions within the interaction region. The positions of the center of mass are randomized within the ion beam profile as projected on the detector. The measured distribution of the transverse center-of-mass positions for nonambiguous DR events (e.g., assigned D + D + Cl) serves to model this ion beam profile.
The longitudinal dissociation positions are distributed homogeneously throughout the interaction region. We neglect the effects of the merging and de-merging regions, as the collision energy in these edge regions is significantly larger than that in the bulk of the interaction region. This higher energy is due to the nonzero collision angle between the electron and ion beams in the edge regions. Since the DR cross section rapidly decreases with increasing collision energy, DR in these edge regions is greatly suppressed relative to that in the straight portion of the interaction region. The error introduced by this approximation is estimated to be small.
At the near-zero collision energy measured here, the electron–ion collision vector is randomly oriented with respect to the beam direction. Additionally, the molecules are randomly oriented in space. As a result, there is no preferred orientation for the fragmentation. The relative orientation of the fragments at the time of dissociation is determined by the orientation of the molecule at that time. Since these are random, for the two-body fragmentation channels we homogeneously randomize the orientation of the vector between the two fragments. For the three-body channel we randomize the normal vector of the dissociation plane and the rotation of the plane around this normal vector.
Another parameter to vary is the KER, Ek, for each simulated event. For all event types, Ek is given by the sum of the fragment i kinetic energies,  , in the center-of-mass frame

In the two-body channels Ek is the only remaining parameter to vary. There, by specifying Ek, the  components are set by energy and momentum conservation, which also yield the relative velocities of the fragments. The resulting transverse distance d between the fragments, as measured at the detector, can then readily be determined for the model from the orientation of the fragmentation vector and the relative velocities. The KER distributions
  are generally not known a priori and must be determined from the measured data. We follow a method similar to that of Buhr et al. (2010b) and use the fit of our modeled distribution f(d) to the data to find
  . In short, we divide the KER distribution into a number of narrow energy ranges, each with an arbitrary amplitude. We next use the fragmentation and detector models to generate fragment distance distributions for each KER range. The amplitude for each of these distributions is used as a fitting factor, and the sum of these distributions is then fitted to the experimental data, thereby yielding
  . Additional details are given in Sections 4.3–4.5, where we also outline how we account for channel mixing.
Our simulations for the three-body channel model the momentum distribution of the fragments in the dissociation plane. Conservation of energy and momentum enables us to split this problem into two parts: the KER distribution and the correlation between the momenta of the fragments. Below we describe how we determine both of these from the experimental data.
The KER distribution is inferred from the fragment kinetic energies  projected onto the detector plane. We calculate these using the distances di between the fragment impact positions and the center of mass, both as projected onto the detector plane. Following the procedure of Buhr et al. (2010b), the relation between
  and di is given by

where Mi is the mass of the  fragment,
  ,
,  is the ion beam energy, and S = 9.41 m is the distance from the center of the interaction zone to the EMU detector. The total projected KER is then defined as
  . The measured distribution of projected energies
  reflects the physical
  distribution but is strongly modified by observational effects, i.e., the projection of three-dimensional fragment coordinates onto the detector plane, the counting efficiencies of individual strips of the detector, the spread of flight distances due to the finite length of the interaction zone, and so on. These effects are taken into account when the event coordinates are generated by the Monte Carlo model. Moreover, an experimentally determined fragment angular correlation, assumed to be independent of the KER, is applied in this model.
The fragment momenta correlation of a three-body decay can be represented by the two-dimensional distribution of the Dalitz coordinates (Dalitz 1953). Dalitz introduced the coordinates η1 and η2 as linear combinations of the kinetic energies  of the three fragments in the center-of-mass frame, taking into account conservation of energy and momentum. For the case of D + D + Cl, with one fragment having a mass different from the others, the coordinates are defined as (Strasser et al. 2004; Lammich 2004)


where  . For a phase-space-dominated breakup without correlations (i.e., with all dissociation geometries equally likely), the distribution of η1 versus η2 (a Dalitz plot) is homogeneous (i.e., flat). Any inhomogeneities in the Dalitz plot indicate preferred or forbidden dissociation geometries.
We determine the distribution  by using a parameterized representation of it in the Monte Carlo model and by calculating the corresponding distribution
  suitable for a fit to the detector data. Adapted to the transverse coordinates measured, this uses the modified Dalitz coordinates Q1 and Q2 defined as (Strasser et al. 2002, 2004)


Unlike  , the distribution
  is no longer flat for an isotropic breakup. Therefore, the measured
  is first divided by a simulated one assuming isotropic (phase-space-dominated) breakup in order to compensate for possible detection efficiency variations and to regain a uniformly populated Dalitz plot in case there are no momentum correlations between the fragments. From here on
  stands for such a normalized distribution.
This resulting  is related nonlinearly to the underlying
  distribution. As a result, any sharp features in
  are smoothed out when plotted in the experimentally accessible
  representation. To extract the underlying dissociation data, we use a parameterized model
  distribution as the input for the simulated fragmentation and detector model. The resulting model distribution
  is fitted to the measured
  by iteratively changing the parameters of
  . The optimized
  is then taken as a representation of the real
  . The specific parameterization of
  is discussed below in Section 4.3.
3.4.3. Detector Model
The detector model includes the geometric cutoff (due to the detector size and location), the detection energy thresholds for D fragments on each strip, the energy resolution for the various fragment masses, the effects of coincident multi-hits on any given single strip, the signal amplification functions for each strip, the signal dependence on the thickness of various strip parts, signal splitting between strips (when hitting the 30 μm gap between the strips), and so on. The implementation of most of these effects has been described previously by Buhr et al. (2010b). The parameters entering the model are based partly on our ab initio understanding of the detector structure (e.g., the strip-to-gap area ratio) and partly on empirical adjustments to match the measured data (e.g., the energy resolution for the various fragments). It is beyond the scope of this paper to describe the detector model in more detail. Instead, we demonstrate the quality achieved for the detector model by comparing the measured and modeled data.
The measured pulse height distributions for the three-body DR channel are shown in Figure 1 for both the front side and back side of the EMU detector. The histograms plot the number of counts versus channel number of the analog-to-digital converter (ADC), i.e., the pulse height. The data have been summed over all strips for each side. Only the assigned three-body data are presented here in order to avoid issues of channel mixing and simplify the comparison between the data and the model.
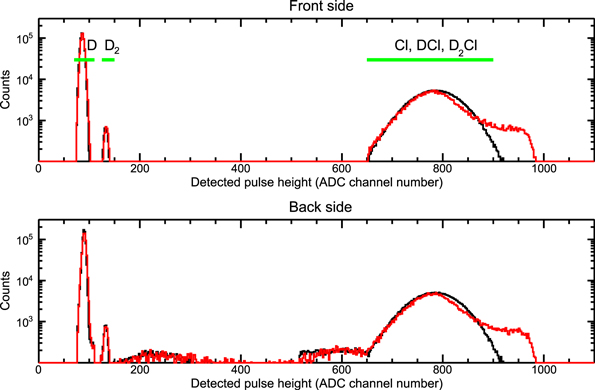
Figure 1. Measured pulse height distributions from the EMU detector are plotted in red for the strips on the front side (top panel) and on the back side (bottom panel). In black we plot the corresponding simulated pulse height spectra. In both cases the data have been filtered for the D + D + Cl channel only. The green horizontal bars indicate the mass windows for assigning the particular fragments. The features outside these windows are discussed in the text.
Download figure:
Standard image High-resolution imageOverall, we find good agreement between the data and model for most of the ADC range. The peaks corresponding to the D and D2 kinetic energies are well separated at ADC channel numbers of ∼80 and ∼130, while the pulse heights from the Cl, DCl, and D2Cl fragments are unresolved, forming one broad peak at ∼800.
We use the signal from the heavy fragment on the front side of the detector to trigger a readout of the data whenever an event has an ADC channel number above 650. As a result, there is no signal on the front side between ∼150 and 650 (with channel numbers below 150 corresponding to D and D2 fragments that do not trigger a readout but are recorded if accompanied by a heavy particle impact above channel 650). The signal on the back side in this range we attribute to a heavy fragment hitting a gap between back-side strips. The resulting charge appears to diffuse to a larger area on the back side, where it is collected by one or two strips. Additionally, our modeling indicates that the enhancement on the back side at ∼600 arises from the particles hitting thicker parts on the front side of the detector electrodes, thus losing more energy before hitting the back-side strip. Lastly, an enhancement in the pulse height distribution above 900 was seen in both the DR data and the non-DR background. The effect likely originates from the amplification electronics chain. However, the ratio of the area in this high-end shoulder relative to the main peak was the same for both the DR and non-DR signal. Hence, including or excluding this range had no effects on our data analysis below. We found that this feature is insensitive to impact position, storage time, and other possible systematic effects.
3.4.4. Non-DR Background Subtraction
The imaging data are contaminated by events originating from non-DR processes. Given that the detector cannot resolve the Cl, DCl, and D2Cl fragments by mass, some of these non-DR events can be incorrectly interpreted as DR by the reconstruction procedure. For instance, a  event originating from collisionally induced dissociation on residual gas will be interpreted as DR forming D + DCl. To remove any non-DR contamination on a statistical basis, we have acquired imaging data with the Target electron beam on and off (after first cooling the ion beam for ∼30 s). The desired distributions f(d),
  ,
,  , and so on, are extracted from the imaging data by scaling the non-DR distributions by the relative ion beam intensity and subtracting them from the data with the electron beam on (i.e., from the DR plus non-DR contributions). Additionally, the non-DR contributions are subtracted in the event count numbers used to determine the branching ratios.
3.4.5. DR Branching Ratios
As mentioned above, mixing of the different physical DR channels in some of the experimentally assigned channels can be modeled by the Monte Carlo procedure once the fragmentation energetics and angular geometries are specified. This model can then predict how many events from a given physical DR channel j will be assigned to an observed channel i. We quantify the matrix describing this mixing through a Monte Carlo simulation of 106 events for each DR channel j, using the fragmentation and detector models described above. From the resulting mixing coefficients, we can obtain the desired DR branching ratio Rj for channel j.
As mixing coefficients, the matrix elements Aij relate the number of actual events nj from channel j and the number of observed events oi assigned to channel i by the reconstruction procedure as

To obtain the DR branching ratios Rj, we rewrite Equation (22) in matrix form and solve for nj as

The resulting branching ratios are given by

To verify the accuracy of the branching ratio analysis, we have performed measurements for two very different ion beam configurations. For the first case the ion and electron beams were aligned in the interaction zone so that the ion beam axis pointed to the center of the detector. This is the same arrangement as for the rate coefficient measurements, and it was also used to determine the KER distributions and angular correlation function for the physical DR reactions. In the second configuration we moved both beams so that, while they remained aligned, the ion beam axis pointed ∼23 mm away from the center of the detector. These two configurations, which we dub as centered and off-center, lead to very different results for the channel mixing. For example, the geometric cutoff is asymmetric for the second configuration and thus more sensitive for the input  distributions in the individual fragmentation channels. As a result, the mixing matrices
  are very different for the two configurations.
As we will show in Section 4.5, for both the centered and off-centered configurations we find the DR branching ratios to agree within their mutual uncertainties. This gives us a high degree of confidence in our analysis.
4. Results
4.1. DR Rate Coefficient
We determine the absolute merged-beams rate coefficient αmb using the detector count rate versus storage time from the nonsegmented silicon surface-barrier detector (see Section 3.2). An example of the measured signal versus storage time is shown in Figure 2. For this particular run the Target beam was on during ion storage times from t = 0 to ≈33 s, off for t ≈ 33–42 s, and on again for t ≈ 42–52 s. During the electron-on phases, the electron and ion beams were matched in velocity. The fitted exponential decay times τ are given in the figure. The other parameters used for determining αmb were  cm−3, L = 1.57 m, and C = 55.4 m.

Figure 2. Count rate vs. storage time measured with the nonsegmented 10 × 10 cm2 surface-barrier detector. The Target beam was on for t = 0 to ≈33 s, off for t ≈ 33–42 s, and switched back on at t0 ≈ 42 s. The thin solid lines indicate the exponential fits used to derive the ion beam lifetimes τoff and τon. The dotted vertical lines mark t0.
Download figure:
Standard image High-resolution imageTo test for systematic effects, we varied the time at which the Target was turned off, the time at which it was turned back on, and the length of each of these two periods. The resulting values for αmb all agreed to within their statistical uncertainties. This supports our assumption that the rate coefficients for all neutralizing processes that significantly contribute to our detector signal are constant versus storage time.
The resulting merged-beams rate coefficient for DR of D Cl+ at matched mean electron and ion beam velocities is

The total uncertainty amounts to 12%. It is dominated by the 11% error on the fitting of the ion beam lifetime. Additional contributions to the uncertainty are due to the electron density (∼4%) and the L/C ratio (≲2%).
4.2. Plasma Recombination Rate Coefficient
We have converted αmb to the plasma rate coefficient αpl using the procedure described in Section 3.3 for s = 1. The resulting αpl is displayed in Figure 3 for the plasma temperature range of T = 5–500 K. The rate coefficient can be represented as

a form that can readily be incorporated into common astrochemical databases.
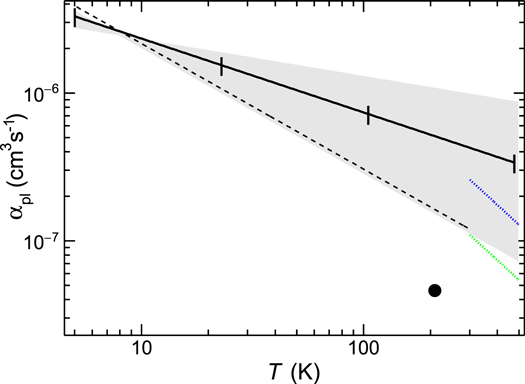
Figure 3. The  plasma DR rate coefficient αpl is plotted by the thick full line as a function of the plasma translational temperature T. Here the model cross-section slope s = 1 and transverse electron beam temperature
  meV are assumed. The vertical error bars represent the quadrature sum of the absolute scaling uncertainty and the uncertainty due to
  . The propagated range of slopes s = 0.75–1.4 is marked by the gray area. The unpublished plasma DR rate coefficient of D2Cl+ of W. Geppert et al. (2009, private communication) is plotted by the black dashed line. The H2Cl+ DR rate constant acquired at 209 K by Kawaguchi et al. (2016) is shown by the filled circle, with a stated accuracy of 11%. The dotted lines plot the results of Wiens et al. (2016) for
  (blue) and for
  (green), each with a stated uncertainty of 30%.
Download figure:
Standard image High-resolution imageThere are several sources of uncertainty in αpl. Here we discuss only the most important ones. The 12% uncertainty in αmb translates into a temperature-independent uncertainty of 12% in αpl. Extracting the DR cross section introduces an uncertainty dominated by the error in  , which in turn is dominated by the uncertainty of
  . Taking the outermost values of
  and 1.9 meV results in changes to αpl of −9.7% and +6.2%, respectively. These values are not dependent on T. The effect of the uncertainty in
  is negligible.
The largest uncertainty in αpl arises from our adoption of s = 1 for the cross-section slope (Larsson & Orel 2008). However, the slopes for molecules similar to  have been found experimentally to vary from s ≈ 0.75 to 1.4 (Florescu-Mitchell & Mitchell 2006). This propagates into a temperature-dependent uncertainty in αpl. For the temperature range considered here, the change is
  at T = 5 K. It drops to
  at T ≈ 8 K and then increases to
  at T = 100 K and further to
  at T = 500 K.
We find that the adopted value of s has the smallest effect on αpl at T ≈ 8 K. This is because the distribution of collision energies E contributing to the measured αmb is comparable to those contributing to αpl at this temperature. Hence, our results are particularly reliable for the typical molecular cloud temperatures of ≈10 K.
4.3. Dissociation Geometry of the D + D + Cl Channel
Understanding the three-body dissociation channel in detail subsequently enables us to accurately model the mixing of this channel into any other one. For the outgoing D + D + Cl channel, we determine the geometry of the fragments after dissociation (i.e., the dissociation velocity vectors) using the EMU detector (Section 3.4). Mixing into this fragmentation channel from either of the two-body channels is negligibly small, less than 0.1%, and we do not account for it in our analysis. Non-DR background into this channel is also low, but we correct for it as described in Section 3.4.4.
In Figure 4 we plot the measured and modeled Dalitz plots for this dissociation channel. Panel (a) shows the measured data in the projected representation  . The corresponding model distribution
  is presented in panel (b). This distribution, in turn, is derived from a convolution of the parameterized model
  with the detector model. Both distributions have mirror symmetry with respect to Q1 = 0.

Figure 4. Dalitz plots for the D + D + Cl fragmentation channel of  DR. The data in all panels are symmetrized with respect to the Q1 = 0 and η1 = 0 lines. (a) Measured data in the
  representation, i.e., based on transverse fragment coordinates. (b) Model
  used to best fit the experimental data in panel (a). (c) The three-circle shapes show the dissociation geometries for a sample of points in [η1, η2] space, i.e., the relative velocity vectors with respect to the dissociation origin, which falls under the Cl atom in the figure. The D atoms are represented by the black circles and the Cl atom by the gray circle. The distribution of the dissociation geometries across the Dalitz plot is the same for all four panels shown here. (d) Model Dalitz plot in the f(η1, η2) representation, i.e., unfolded from the effects of detecting transverse positions only. Here f(η1, η2) is parameterized by amplitudes at 10 pairs of [η1, η2] coordinates (black plus signs). Between these points a two-dimensional linear interpolation in radial coordinates has been used (taking the origin at [0, 0]).
Download figure:
Standard image High-resolution imageIn Figures 4(c) and (d) we use the [η1, η2] dependencies. The results shown in each panel have mirror symmetry with respect to η1 = 0. Panel (c) shows for various regions of the Dalitz plot the corresponding geometry of the fragments after dissociation. The vectors show the relative velocity of the fragments relative to the dissociation origin, which falls under the Cl atom marker in the figure.
We have parameterized our  model using a grid of 10 fixed points and varying the amplitude at each of these (η1, η2) coordinates, which are indicated in panel (d). These points have been chosen to best reproduce the largest variations in the measured
  . We limited the number of points to keep the model calculations tractable and linearly interpolated the amplitude between these 10 data points to fill in the rest of the (η1, η2) plane. The amplitudes of
  were varied to minimize the difference between the measured
  and the model
  .
.
4.4. Reaction Energetics
The KER for each fragmentation channel, Ek, is given by Equation (7). Our measurements were performed for matched electron and ion velocities. Under these conditions, the width of the electron energy distribution determines the typical DR collision energy, here  meV. This energy is much smaller than the other three terms contributing to Ek and can be neglected for the discussion below. We infer the values for these other three components using the distribution of fragment kinetic energies
  that fits the observed kinematical distribution, i.e.,
  or f(d) for the three-body channel or the two-body channels, respectively.
4.4.1. D + D + Cl
Figure 5 shows the measured  for the three-body channel and compares it to a model
  . The model uses the fragmentation geometries
  as determined above for this channel. The exothermicity of the ground-state molecule is
  . The internal energy of the parent ion is expected to be rotational only (see Section 3.1). We approximate this using a Boltzmann distribution of energies with a temperature Trot, which we convolve to yield the modeled
  distribution.
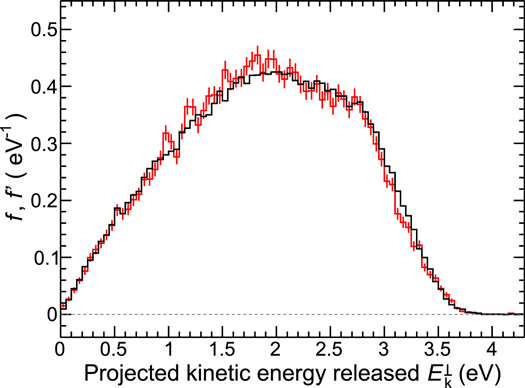
Figure 5. Measured and simulated distributions of projected fragment kinetic energies for the D + D + Cl channel of  DR;
DR;  is in red, and
  is in black, respectively. The model distribution
  includes a
  rotational excitation of
  K and exothermicity
  , both determined from the fit. The vertical error bars in the measured data represent the statistical uncertainty.
Download figure:
Standard image High-resolution imageThe only excited product accessible at the near-zero relative collision energy measured here is the fine-structure Cl( ), lying ∼0.11 eV above the Cl(
 ) ground level. The energy difference between these two levels is too small for us to experimentally distinguish them and to derive their population ratio. To account for this, we assume that the J = 3/2 and 1/2 fine-structure levels are populated according to their statistical weights with a 2:1 ratio, respectively. Thus, in our modeled distributions, we treat two-thirds of the Cl as being in their ground level and one-third as being excited such that
  in Equation (7).
We calculate the model  distribution using a Monte Carlo approach combined with the fragmentation and detector models described earlier. In the fit we keep the rotational temperature
  of the
  as a free parameter. Additionally, due to the uncertainty in the estimated value of E0 = 3.5 eV (see Section 2), we also treat E0 as a free parameter. The best agreement between the measured
  and modeled
  distributions, shown in Figure 5, was found for Trot = 1200 ± 1000 K and
  . We note that the derived Trot is far from the the wall temperature of TSR at ≈300 K, indicating that the
  ions did not reach equilibrium with the blackbody radiation. For such a nonequilibrium case, a Boltzmann distribution may not describe the rotational population correctly. Nevertheless, our simplified cooling models have shown that this deficiency is negligible compared to the Trot uncertainty, which is dominated by other systematic errors in the model. These errors are discussed in more detail in Section 4.5.
4.4.2. D2 + Cl
Mixing into the D2 + Cl channel from the other fragmentation channels is estimated by our models to be less than 0.2%. Hence, the data for this channel can be easily filtered from that for the other two channels.
Figure 6(a) shows the projected fragment distance distribution f(d) for this two-body channel. We have fitted the measured data using the model distribution  . Each
  represents the modeled subdistribution for fragment kinetic energies uniformly distributed within a narrow Ek range chosen to represent a bin in the
  distribution. These subdistributions are each normalized to unity and multiplied by a scaling factor Si, derived by fitting
  to the measured f(d). The resulting model distributions
  and
and  are indicated in Figure 6(a). We note that the model distributions already include rotational excitation of the
  parent ions with the value of Trot determined in Section 4.4.1.
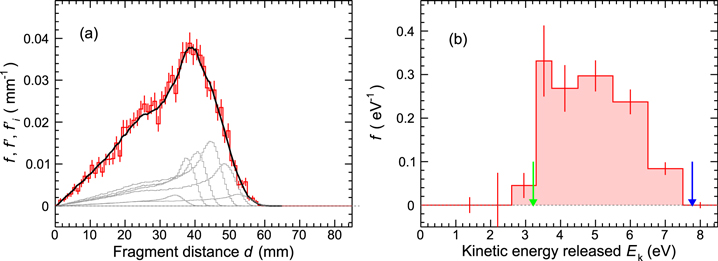
Figure 6. Product excitation analysis for the D2 + Cl channel. (a) Projected fragment distance distribution f(d) in red compared to model distribution  in black and the subdistributions
  in gray. (b) Derived product kinetic energy distribution
  in red. The blue arrow indicates the exothermicity of the D2 + Cl channel. Going down in energy from the blue arrow, the green arrow marks the threshold for D2 dissociation, i.e., opening of the D + D + Cl channel as the internal excitation of the D2 molecular product increases.
Download figure:
Standard image High-resolution imageUsing these distributions, we can derive the binned  distribution, as shown in Figure 6(b). From this, using Equation (7), we can infer the internal energy distribution of the product D2 molecule, as the Cl cannot be excited to higher terms by the energy released in the dissociation process. In this model, the bin widths were chosen as narrow as possible while still enabling the fitting algorithm to converge. We note that these widths are much broader than the energy spacing of the rovibrational levels in the product D2. The amplitude for each bin corresponds to the respective value of Si for that subdistribution. The error bars plotted present the statistical uncertainty of the fit for each bin.
4.4.3. D + DCl
Mixing into the D + DCl channel is strong. The dominant contamination is from the D + D + Cl channel, due to one of the D fragments not being detected. This results either from the geometrical limits of the detector or from an electronic signal in one of the detector strips that is too low to be detected. We correct the measured fragment distance distribution f(d) for this contamination by modeling the contribution from the three-body channel.
In Figure 7(a) we plot the measured f(d) distribution assigned by the reconstruction procedure to the  channel together with the simulated, large contribution from the D + D + Cl channel. We simulate mixing into the
  channel from the D + D + Cl channel using the parameters for the three-body dissociation channel that we have experimentally determined above, i.e.,
  ,
,  , and
, and  . We have also scaled the model so that the number of unambiguous three-body dissociation events matches the number of experimental three-body events assigned by the reconstruction procedure. The difference between the two curves then represents the transverse distance distribution caused by the physical D + DCl channel alone. Using the same procedure as for the
  channel above, we can infer the corresponding internal energy of the product DCl. This is shown in Figure 7(b).
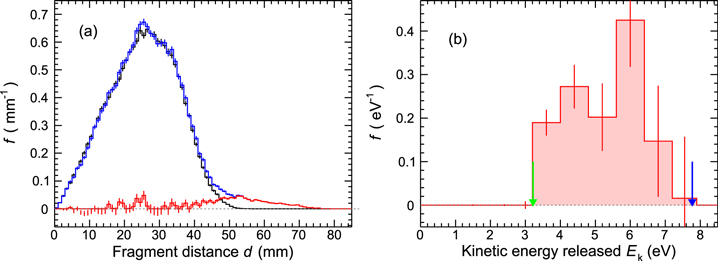
Figure 7. Product excitation analysis for the D + DCl channel. (a) The measured fragment distance distribution f(d) assigned by the reconstruction procedure is plotted by the blue line. Above ∼50 mm the red and blue lines fall on top of one another. The modeled mixing contribution from the D + D + Cl channel is plotted by the black line. The final D + DCl distribution corrected for the channel mixing is plotted by the red line. The vertical axis is scaled such that the integral over this final distribution equals unity. (b) Same as Figure 6(b), where the blue line indicates the exothermicity of the D + DCl channel and the green arrow the energetic threshold for DCl dissociation, i.e., opening of the D + D + Cl channel for increasing internal excitation of the DCl product.
Download figure:
Standard image High-resolution image
4.5. Fragmentation Branching Ratios
Section 3.4.5 describes our procedure for determining the DR fragmentation branching ratios. The specific model we have used includes four outgoing channels: three for the expected DR fragmentation channels and one for nondissociative recombination forming D2Cl. This last channel is included because it can be assigned for events in which one or both light fragments (essentially D) escape observation. The branching ratio for this nondissociative channel, as we will show later, is consistent with the expected value of zero. Using this four-channel model, we have determined the mixing coefficients Aij between the four channels for both the centered and off-center beam configurations.
In the model used the parameters for the three DR fragmentation channels include  , the three-body dissociation distribution
  , and the KER distribution
  for each of the outgoing DR channels. The determination of these parameters has been described above. For the nondissociative recombination channel, we treat the neutral D2Cl molecule as propagating along the velocity vector of the parent ion at the point where recombination occurs.
Starting with the measured fragment-imaging data, we use the event reconstruction procedure described in Section 3.4 to determine the total number of observed events assigned to each of the four outgoing channels, oi. The branching ratios Rj are then derived by solving Equations (23) and (24). Table 1 presents the results for both the centered and off-center beam configurations. The branching ratios are given in percentage, followed by their statistical uncertainty and then their systematic error. We have combined these two data sets using a statistically weighted average, which is also given in the table along with the corresponding systematic error. The branching ratio for the nondissociative channel is consistent with zero. As will be discussed in Section 5.4, we find no evidence in our imaging data for this channel. So we present in the final line of the table the branching ratios corrected for the nondissociative channel branching ratio being zero.
Table 1.
Fragmentation Branching Ratios for DR of  Given in Percentage
| D + D + Cl | D2 + Cl | D + DCl | D2Cl | |
|---|---|---|---|---|
| Centered | 83.9 ± 0.3 ± 3.1 | 4.79 ± 0.06 ± 0.4 | 8.2 ± 0.7 ± 2.8 | 3.1 ± 0.4 ± 2.7 |
| Off-center | 84.2 ± 0.5 ± 3.1 | 4.76 ± 0.07 ± 0.4 | 9.2 ± 1.1 ± 2.8 | 1.8 ± 0.7 ± 2.7 |
| Statistically weighted average | 84.0 ± 3.1 | 4.8 ± 0.4 | 8.5 ± 2.8 | 2.7 ± 2.7 |
| Final value | 86.3 ± 3.2 | 5.0 ± 0.4 | 8.7 ± 2.9 | ⋯ |
Note. The first two rows give the branching ratios for the centered and off-center beam configurations (see text), followed by the statistical uncertainty and then the systematic error. These two data sets have been weighted by their statistical uncertainties and averaged, the results of which are given in the third row of the table, along with the corresponding systematic errors. The last row gives the final branching ratios, taking the branching ratio of the nondissociative channel to be zero.
Download table as: ASCIITypeset image
The dominant source of statistical uncertainty in the branching ratios arises from the counting statistics for the number of counts assigned to each channel (the oi values). We determined the statistical uncertainties of the branching ratios using a sensitivity analysis. The oi values are assumed to follow normal distributions with a 1σ width of  , where N is the number of counts. Starting with the measured oi values, we randomly and independently varied the number of counts for each channel using a normal distribution. Each trial resulted in new oi values and correspondingly modified branching ratios. This process was repeated for 1000 trials. The resulting branching ratio distribution for each channel was fit using a Gaussian to estimated 1σ statistical uncertainty in the measurement.
We have estimated the systematic uncertainties by calculating how the derived branching ratios change as a result of systematic shifts in various input parameters. The parameters that we varied include as follows: the mass-assignment window sizes, i.e., the range of signal amplitudes assigned to a certain mass; the ion beam width; 
 and Trot, which, together with
  , determine the fragment kinetic energy distribution for the three-body channel;
  for the two-body channels; and the scaling of the non-DR distributions for background subtraction. We combine the resulting shifts in Rj in quadrature and give the resulting estimated systematic uncertainties in Table 1.
As a final note in this section, we point out that for any given channel in Table 1 the branching ratios for the centered and off-center beam configurations lie well within the corresponding systematic uncertainties. This demonstrates the reliability of our fragmentation and detection models and the accuracy of the resulting branching ratios.
5. Discussion
5.1. DR Plasma Rate Coefficient
Figure 3 shows our experimentally derived plasma rate coefficient. Our result is most accurate for a translational temperature of T ≈ 8 K, i.e., similar to typical dense molecular cloud temperatures. We have extrapolated to lower and higher temperatures using typical DR translational-temperature dependencies.
Also shown in Figure 3 are the results from other experimental groups. W. Geppert et al. (2009, private communication) measured  DR using the CRYRING ion storage ring. Within the mutual error bars, their results and ours are in agreement. This is expected, given the similar systematics of the CRYRING and TSR experiments and also due to the expected similar levels of internal excitation of the parent
  ions.
ions.
Wiens et al. (2016) measured DR for  and
and  in a flowing afterglow experiment for translational kinetic temperatures of T = 300–500 K. They estimate the accuracy of their results to be ±30%. Our extrapolated
  results agree well with their measured results, to within the respective error bars. Their results are also in good agreement with the
  results of W. Geppert et al. (2009, private communication). We note that the rate coefficient temperature dependencies of Wiens et al. (2016) suffer from large uncertainties. Moreover, the internal and translational temperatures in their experiment are coupled, which is in contrast to our storage ring measurement. Hence, one cannot reliably extrapolate the rate coefficient results of Wiens et al. (2016) to low temperatures to compare to our data.
Using a pulsed discharge source combined with infrared time-resolved spectroscopy, Kawaguchi et al. (2016) derived the  DR rate coefficient for an estimated T = 209 K. These results are nearly an order of magnitude below the
  results of Wiens et al. (2016). One possible explanation for the discrepancy may be an error in the translational temperature. Kawaguchi et al. assumed this temperature to be equal to the
  rotational temperature that they determined in a separate experiment under similar conditions. Another possible source of error may arise from additional chemical processes occurring in the plasma. The stated electron density is much higher than that of
  . Since the overall plasma is expected to be neutral, this implies the presence of other ions and other reactions that may affect the inferred
  DR rate coefficient.
5.2. KER Distributions
For the three-body D + D + Cl channel, the KER distribution  is expected to be narrow in energy, broadened only by the rotational excitation of the parent ions and by the fine-structure splitting in the Cl product. The latter is too small for us to resolve, and we have assumed that the fine-structure levels are populated according to their statistical weights. (Note that
  appears broadened when transformed into
  , as shown in Figure 5.) The inferred exothermicity is
  . This available energy is insufficient to excite either the D or Cl products into the first term above the ground term. This energy also differs from the 3.5 ± 0.1 eV calculated for the
  isotopologue (i.e., Equation (10)). A part of this difference (≈0.1 eV) can be explained by the lowering of the zero-point energy in
  versus
  . The remaining ≈0.1 eV difference is comparable to the error bars of the result.
For each of the two-body fragmentation channels, D2 + Cl and DCl + D, we observe broad KER distributions, Figures 6(b) and 7(b), respectively. Each of these span from the expected maximum KER (i.e., the E0 = 7.9 eV exothermicity for each reaction) and extend downward to lower energies. The maximum KER corresponds to the daughter products being in their lowest energy levels of their ground electronic states. As the KER decreases, the "missing" energy goes into internal excitation of the DR products. Each of these KER distributions turns off for energies below ∼3 eV. We attribute this to the internal excitation being sufficient to dissociation of the daughter molecular products, i.e., to the opening up of the three-body DR channel. This ∼3 eV corresponds well to the E0 of the three-body channel, to within the energy resolution of our KER distribution analysis for the two-body channels. Similar KER distributions, extending from the two-body E0 value and going down to the three-body fragmentation E0 value, have been observed in DR of  , D2H+, D3O+, and DCND+ (Strasser et al. 2002; Buhr et al. 2010a, 2010b; Mendes et al. 2012).
The maximum energy released here by either two-body DR channel at matched beams' velocities is 7.9 eV. This available energy is insufficient to excite either the D or Cl products into the first term above the ground term. It is also not sufficient to excite the daughter D2 or DCl to their lowest bound electronic states above their ground levels. In H2 (and similarly D2) the first excited bound electronic state lies ∼10.5 eV above the ground electronic state (Field et al. 1966). For HCl (DCl) this occurs at ∼9.5 eV (Alexander et al. 1998). Thus, we expect the D2 and DCl daughter products to be formed in their ground electronic states and attribute the observed spread in the KER distributions to rovibrational excitation of the daughter molecules.
Our DR results also demonstrate that the dissociation occurs soon after recombination, on a timescale much shorter than the ∼3 μs time of flight between the electron–ion interaction zone and the detector. If the dissociation proceeded more slowly, then we would expect some of the recombined parent molecules to dissociate downstream of the electron–ion interaction region. This would result in smaller fragment distances d at the detector and correspondingly smaller inferred values of Ek. The absence of any two-body DR events observed with Ek below the expected three-body dissociation limit demonstrates that dissociation occurs soon after electron capture, which is as we assume in our dissociation model.
5.3. Three-body Fragmentation Geometries
Using the Dalitz plots shown in Figure 4, we can determine the most likely fragmentation geometries for the D + D + Cl dissociation channel. Figure 4(d) shows the inferred data for the f(η1, η2) representation after deconvolving the experimental effects. We have parameterized f(η1, η2) using 10 pairs of [η1, η2] coordinates and linearly interpolated between the points in radial coordinates. The peak at (η1, η2) ≈ (0, −0.3) corresponds to dissociation in a linear D – Cl – D geometry and accounts for ∼40% of the dissociations. The peak at (η1, η2) ≈ (0, 0) corresponds to dissociation in an equilateral triangle geometry and accounts for ∼30% of the dissociations. The remaining area in the Dalitz plot corresponds to dissociations into all other geometries and accounts for the remaining ∼30% of the dissociations. However, given that we only use 10 pairs of coordinates in our model for f(η1, η2), it is possible that this third component may be an artifact from the numerical processing of our data.
It is interesting to note that the linear dissociation channel is so strong. The parent ion has a bent geometry with an equilibrium angle of 94° (Chattopadhyay 2010). This suggests that the dissociation triggered by the capture of a low-energy electron occurs along one or several repulsive potential surfaces of complex shape, so that the dissociation velocity vectors do not represent the original physical arrangement of the atoms. Consistent with earlier observations on, e.g.,  (Zhaunerchyk et al. 2007), this contradicts a simple "bond-breaking" picture of the DR process.
5.4. Fragmentation Branching Ratios
Table 1 gives the statistically weighted averages for the experimental branching ratios of the outgoing channels for electrons recombining with  . At this step of the analysis we have included the nondissociative channel leading to D2Cl as a possible physical recombination channel. As expected (see next paragraph), we find that the branching ratio for this nondissociative channel is consistent with zero, to within the experimental uncertainties, and set the branching ratio for this channel to zero. The resulting final branching ratios for the remaining three DR channels are listed in the last row of Table 1.
For the nondissociative channel to be nonzero the unlikely scenario would be required that the recombined D2Cl molecules remain internally excited by >12 eV for the ∼3 μs flight time from the interaction zone to the detector. However, this excitation energy lies ∼4.4 eV above the D2Cl dissociation energy. Thus, even if metastable D2Cl existed, we would expect some fraction of the molecules to dissociate during this time interval. These delayed dissociations would result in an enhancement in the measured signal at low fragment distances d, resulting in values for Ek or  that would be significantly lower than those derived from the molecular energetics of Equations (8)–(10). We find no such signatures in any of the
  and
and  distributions for any fragmentation channel. Thus, we conclude either that the nondissociative recombination channel of
  (Equation (11)) is indeed closed or that its rate coefficient is negligible in comparison to the DR channels (Equations (8)–(10)).
To the best of our knowledge, there are no published experimental or theoretical branching ratios for DR of any of the  isotopologues. There are, however, two estimates. Astrochemists have long assumed a branching ratio of 10% for the HCl+H fragmentation channel, largely motivated by their attempts to match the small HCl abundances observed in diffuse clouds (e.g., Neufeld et al. 2015, and references therein). Interestingly, this observationally motivated estimate agrees reasonably well with our results for the DCl + D channel. Conversely, Roueff & Herbst (2011) estimate the branching ratio for the H + H + Cl fragmentation channel to be 56%. They base their estimate on the apparent correlation between the three-body DR fragmentation branching ratio and the reaction exoergicity E0 observed for DR of other dihydride ions. However, there is a large scatter in the data of their correlation plot, suggesting that any correlation is very weak, at best. Our
  result of ≈86% for the D + D + Cl channel lies well above their estimated branching ratio and further adds to the scatter of the data on their correlation plot.
5.5. Astrophysical Implications
Our results appear unlikely to explain the discrepancy between the observationally inferred HCl and H2Cl+ abundances and the ∼3–5 times smaller predicted abundances (De Luca et al. 2012; Monje et al. 2013; Neufeld et al. 2015). The astrochemical models of Neufeld et al. (2015) use the DR rate coefficient for  from W. Geppert et al. (2009, private communication), with which our results are in good agreement. If the DR rate coefficient for
  were smaller than that for
  , as suggested by the work of Kawaguchi et al. (2016), then that could account for some of the discrepancy. However, the
  DR rate coefficient of Wiens et al. (2016) is an order of magnitude larger than that of Kawaguchi et al. (2016) and a factor of ≈2 larger than the DR rate coefficient for
  reported by us and by W. Geppert et al. (2009, private communication). Given the good agreement between the work of Wiens et al. (2016), W. Geppert et al., and us for DR of
  , we favor the
  DR rate coefficient from Wiens et al. (2016). If that is the case, then DR appears to be unable to explain the observed discrepancies.
Additionally, as noted above, we find good agreement between our measured branching ratio for DR of  forming DCl + D and the branching ratio currently being used by astrochemists for DR of H2Cl+ forming HCl + H, which is assumed to be the dominant HCl formation channel. Given the nearly identical structures of the various
  isotopologues, we expect that our results on
  are a good proxy for those of
  . Hence, the branching ratio also appears not to be the explanation for the observed HCl discrepancy.
It seems to us that at this point there are two issues to resolve. The first is for DR measurements on  rather than any isotopologues. The second is to measure DR for internally cold molecules. Our results here are valid for Trot ∼ 1200 K. But molecules in diffuse clouds radiatively relax to their ground vibrational and rotational states, since their radiative decay rates are faster than the typical collisional excitation rates (Spitzer 1978). To address these questions, we plan to perform DR studies on internally cold
  using the recently commissioned heavy-ion Cryogenic Storage Ring (CSR) located at the Max Planck Institute for Nuclear Physics (MPIK) in Heidelberg, Germany (von Hahn et al. 2016).
6. Summary
Using a merged-beams configuration, we have measured the absolute merged-beams rate coefficients for DR of  . From our results we have extracted a cross section that we have used to generate a total DR plasma rate coefficient for a translational temperature of 8 K. We have also measured the branching ratios for each of the three final channels.
Extrapolating our cross-section results, we have estimated plasma rate coefficient results for temperatures from 5 to 500 K. In general, we find good agreement between our results and those from other groups. Additionally, our measured branching ratio for forming DCl of 8.7% ± 2.9% is in good agreement with the observationally inferred value currently used for DR of  forming HCl. Our results, in combination with those of other groups, appear unlikely to explain the observed discrepancies between the inferred abundances of HCl and
  in molecular clouds and predictions from astrochemical models. Clearly, though, further measurements on internally cold
  are needed to truly resolve this issue.
Lastly, from our KER measurements, we find that the molecular fragments in the  and D + DCl channels are internally highly excited, and we have presented the excitation distribution of the molecular fragments. Our results also indicate that three-body dissociation of the bent parent molecular ion results in a linear dissociation geometry ∼40% of the time, in an equilateral triangular geometry ∼30% of the time, and in all other geometries the remaining ∼30%.
We thank the MPIK accelerator and TSR crews for their excellent support. O.N. and D.W.S. were supported in part by the NSF Division of Astronomical Sciences Astronomy and Astrophysics Grants program and by the NASA Astronomy and Physics Research and Analysis Program. D.S. acknowledges the support of the Weizmann Institute of Science through the Joseph Meyerhoff program. The support of Max-Planck-Society is acknowledged. The work has been supported in part by the German-Israeli Foundation for Scientific Research (GIF under contract no. I-900-231.7/2005). W.G. acknowledges partial support by the COST Action CM0805: "The Chemical Cosmos: Understanding Chemistry in Astronomical Environments."