
Abstract
This paper investigates the thermal conductivity of silicene nanosheets (SiNSs) via molecular dynamic simulation. It shows that the thermal conductivity of pristine SiNSs is about 25–30 W mK−1 and exhibits anisotropic behaviour. Moreover, it is found that isotopic doping is efficient in reducing the thermal conductivity of SiNSs. When SiNSs are randomly doped with 30Si at the doping percentage of 50%, a maximum reduction of about 20% is obtained. This reduction can be increased when the dopants are arranged into a superlattice pattern. The thermal conductivity of these superlattice-structured SiNSs changes non-monotonically as the thickness of their lattice layers decreases. Detailed analysis of the phonon spectra demonstrates that the competing mechanism between the interface scattering and confinement effects of the phonon modes is responsible for this non-monotonical behaviour.
Export citation and abstract BibTeX RIS
1. Introduction
Silicene, a recent development of the two-dimensional nanostructure of silicon, has been fabricated by epitaxial growth on a silver surface [1–3]. Similar to graphene, silicene is also a single layer of silicon atoms arranged in a stable hexagonal lattice structure but with a slight local buckling [4]. Excitingly, the band structures of low buckled silicene resemble those of graphene and the charge carriers in silicene behave like Dirac massless fermions with ultra-high Fermi velocities [5]. Graphene has ultra-high thermal conductivities of 3000–5000 W mK−1 [6]. In contrast, recent molecular dynamic (MD) simulations showed that the in-plane thermal conductivity of silicene at room temperature is in the range of 20–60 W mK−1 [7–10], which is much lower than that of bulk silicon (150–200 W mK−1). With excellent electric transport properties and low thermal conductivity, silicene is promising as the thermoelectric material for next-generation power generators or refrigeration applications [11, 12].
Although thermoelectric materials have such advantages as high reliability, being lightweight and environmental benignancy, their low efficiency significantly limits their wide applications [13]. The efficiency of thermoelectric materials can be characterized by the figure-of-merit ZT = S2σT/λ, where S, σ and λ are the Seebeck coefficient, electrical conductivity and thermal conductivity, respectively, and T is the absolute temperature [14]. A simple approach for efficiency improvement is to minimize the thermal conductivity λ or maximize the power factor S2σ or both. To compete with the traditional energy conversion methods, the figure-of-merit should meet ZT > 3. However, up till now, even improved bulk materials have seldom realized ZT > 1 [15]. Therefore, nowadays research in this area has been directed towards nanoscale materials due to their large surface-to-volume ratio and explicit surface reconstruction effect.
A recent study based on the combination of the non-equilibrium Green's function method and MD simulation has demonstrated that silicene nanoribbons (SiNRs) can exhibit excellent thermoelectric performance [16]. This performance is achieved by reducing their width to suppress the thermal conductivity. However, narrow SiNRs have low mechanical strength and structural stability and it is challenging to control their size distribution. Thus, it would be advantageous to develop approaches that reduce the thermal conductivity of silicene without needing to change its size.
Isotope doping provides an efficient method to tune the thermal conductivity of nanomaterials [17]. The MD simulations demonstrated that by isotope doping, the thermal conductivity of graphene and silicon nanowires can be dramatically reduced even at a low doping percentage [18–21]. Moreover, ultra-low thermal conductivity can be achieved if the dopants are arranged into a superlattice structure [21]. Isotope doping has the advantage that it would not affect the electronic properties of the nanostructures since all the isotopic atoms have the same electronic structure.
Therefore, this study focuses on the thermal conductivity of silicene nanosheets (SiNSs) and the effect of isotopic doping on it. The SiNSs will be doped in two manners: random pattern and superlattice pattern. The effect of the doping percentage, the thickness of the superlattice layers and the quality of the layer interfaces will be investigated. A detailed analysis of the phonon modes will be conducted in order to understand the underlying mechanisms.
2. Simulation model
The direct non-equilibrium MD (NEMD) method is applied to calculate the thermal conductivity using the large-scale atomic/molecular massively parallel simulator (LAMMPS) package [22]. Figure 1(a) illustrates the model configuration of an armchair oriented SiNS. Initially, all the silicon atoms are placed in a honeycomb-lattice structure of which the lattice constant is set to be 2.30 Å as reported from experimental results [1]. In addition, a small out-of-plane displacement δ = 0.44 Å is applied to the silicon atoms as shown in figure 1(b) to mimic the local buckling experimentally observed in silicene.
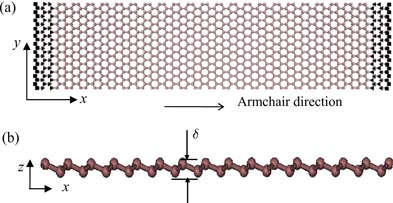
Figure 1. Schematic of (a) armchair oriented SiNSs and (b) the small local out-of-plane buckling.
Download figure:
Standard image High-resolution imageAt first, the initial configuration is relaxed using the constant pressure and temperature (NPT) ensemble near T = 0 K for 50 ps with the time step Δt = 0.5 fs. The periodic boundary conditions are applied along both the length X and width Y directions during the relaxation. Three widely used potentials, Tersoff [23], MEAM [24] and Stillinger–Weber (SW) [25], are tested for a better description of the atomic configuration of SiNSs. It is found that after the relaxation, the bond length of SiNSs produced by both the SW and Tersoff potentials stays at around 2.30 Å, a value close to that reported from ab initio simulation for free-standing silicene [26], while that obtained by the MEAM potential reaches 2.42 Å (about 5% increase). A bond length larger than the real value can significantly affect the thermal conductivity of SiNSs according to the previous simulations [7, 8]. Therefore, only the SW and Tersoff potentials are adopted for thermal conductivity calculations here.
Upon the relaxation of the system, its temperature is increased to T = 300 K. Then, the constant volume and constant temperature (NVT) simulation is conducted for 50 ps to ensure that the system is in an equilibrium state.
Afterwards, the system is switched to the constant volume and energy (NVE) ensemble to keep the energy conserved. Fixed boundaries are applied at both ends of the SiNSs, as denoted by the solid squares, to replace the periodic boundary condition along the X-direction. The atoms denoted by triangle symbols next to the two fixed boundaries are placed in two Nosé–Hoover thermostats. The temperature of the left thermostat is set to be T − ΔT; while that of the right thermostat is set to be T + ΔT. In all the simulations, ΔT is kept as 50 K.
The simulation is conducted for 5 × 10⁶ steps to allow the system to reach a steady state, during which a stable temperature gradient ∇T can be established along the length of the X-direction. To maintain this temperature gradient, a small amount of heat Δξ is added into the right thermostat; while the same amount of energy is removed from the left thermostat at each time step. At the thermostats, phonons scatter at the fixed boundaries and give rise to nonlinearity of the temperature distribution. This study takes only the linear portion of the temperature distribution for the calculation of ∇T. As a result, the thermal conductivity λ can be obtained based on Fourier's law λ = −J/∇T, where J is the heat flux given by J = Δξ/(AΔt) with A being the cross-section area. Therefore, the thermal conductivity can be calculated by λ = −Δξ/(AΔt∇T). For the calculation of A, the thickness of silicene is needed. However, it is not a well-defined quantity and can be chosen in several ways such as using the van der Waals diameter of the Si atoms [7], the distance between the Si (1 1 1) planes [8] and the bond length of bulk silicon [10]. This study employs the distance between the Si (1 1 1) planes, in analogy to the adoption of the interlayer distance of graphite as the thickness of graphene for thermal conductivity calculation [27].
3. Results and discussion
In nature, 28Si has the highest abundance of 92%, compared with its isotopes 29Si (5%) and 30Si (3%) [28]. Besides these three, 42Si and 43Si have also been observed [29, 30]. Here, the pristine SiNSs are considered as consisting of only 28Si atoms. The thermal conductivity λ of pristine SiNSs is calculated for various lengths. Here, the width of the SiNSs is set as around 3 nm. The simulation shows that when the width takes a larger value, the λ of SiNSs remains almost unchanged. Figure 2 shows that the λ of both the armchair and zigzag oriented SiNSs first dramatically increases with the length (L < 60 nm) and then gets close to the value for infinitely long SiNSs. This value is found to be 61.7 and 68.5 W mK−1 for armchair and zigzag SiNSs, respectively, when the Tersoff potential is used; while it is 25.4 and 27.7 W mK−1 for armchair and zigzag SiNSs, respectively, when the SW potential is used.
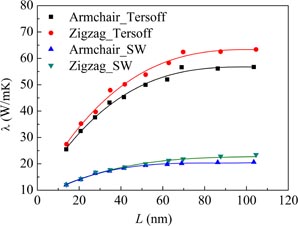
Figure 2. Dependence of the thermal conductivity λ on the length L of SiNSs.
Download figure:
Standard image High-resolution imageThe results obtained by both potentials demonstrate that silicene has much lower thermal conductivity than bulk silicon. Moreover, it is found that the λ of zigzag SiNSs is about 10% larger than that of armchair SiNSs, which implies that silicene demonstrates chirality dependence in thermal conduction. Such anisotropic thermal conducting behaviour has also been reported for graphene and can be interpreted by the different lengths of path for a phonon to pass along two chiral directions [31]. For the same system length L, the phonon paths along the armchair and zigzag directions are 1.35 L and 1.15 L, respectively. A longer path means more phonons scattering which would lead to a lower thermal conductivity.
It is noted that the λ of SiNSs predicted by the Tersoff potential is almost three times that predicted by the SW potential. Previous MD simulations have demonstrated that the thermal conductivity of two-dimensional materials such as graphene can be significantly affected by their morphology [27]. The present study shows that the initially applied small local buckling disappears during the simulation when the Tersoff potential is used, but can remain when the SW potential is applied. Since the SW potential can produce the morphology of SiNSs that is close to the experimental observations, the results produced by it are presented in the following discussion.
The effect of isotopic doping is also studied by taking armchair orientated SiNSs as examples. The length of the SiNSs is taken as 41.4 nm and kept the same in all the following simulations. At first, the 28Si atoms of the pristine SiNSs are randomly replaced by 29Si or 30Si atoms. Figure 3 shows the λ of 29Si- and 30Si-doped SiNSs as a function of the doping percentage f. As f increases, λ first decreases and then increases. Similar trends have been observed in the doping studies of graphene nanoribbons [16, 18], carbon nanotubes [32, 33], and silicon nanowires [21].
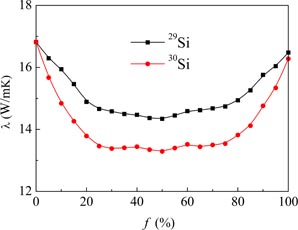
Figure 3. Dependence of the thermal conductivity λ of SiNSs on the random doping percentage f.
Download figure:
Standard image High-resolution imageThe minimum value of λ is reached at around f = 50% and a reduction of about 20% is achieved for 30Si doping. It is remarkable that λ changes dramatically at the two ends, i.e., when f < 20% and f > 80%. Such changes can be explained by the localization mechanism of phonon modes [19]. For a small value of f, each doping atom can localize certain phonon modes. Due to this localization, the dopants are unfavourable for thermal transport. As f increases, the number of these localized phonon modes increases, leading to a dramatic reduction in λ. However, as f increases, the dopants become close to each other and start to affect their neighbours, slowing down the increase of the localized modes and therefore the decrease in λ. When f increases beyond 50%, the 29Si or 30Si atoms become dominant with the 28Si becoming the dopants. Therefore, as f further increases, the doping effect weakens, leading to a reverse trend in λ.
A superlattice is a periodic structure constructed from layers of two (or more) materials aligned next to each other. Semiconductor superlattice structures have recently attracted intensive research interest due to their potential in reducing thermal conductivity [34–37]. In this study, isotopic-superlattice structured SiNSs (IS-SiNSs) are constructed by arranging 28Si and 30Si atomic layers alternatively along the X-direction, as shown in figure 4. The lengths of the 28Si and 30Si layers are denoted by l28 and l30, respectively, and set to be equal to each other, which gives the result of doping percentage f = 50%.

Figure 4. Schematic of the isotopic-superlattice structured SiNSs. Rectangular boxes delineate smooth and rough interfaces, the latter of which is constructed by randomly replacing half of the 28Si (30Si) atoms at the interfaces by the 30Si (28Si) atoms.
Download figure:
Standard image High-resolution imageThe interfaces in the superlattice structure play an important role in the thermal conductivity [38]. To investigate the effect of interface quality, the smooth interfaces of IS-SiNSs are roughened by randomly replacing half of the 28Si (30Si) atoms at the interfaces with 30Si (28Si) atoms, as delineated in the rectangular box (figure 4). For the IS-SiNSs with lp ⩽ 1.38 nm which is the length of four zigzag chains, when the interfaces are roughened, the IS-SiNSs degenerate to be equivalent to the randomly doped SiNSs. In other words, in order to preserve the superlattice structure in the roughened IS-SiNSs, the periodic length lp should be larger than 1.38 nm.
Figures 5(a) shows the dependence of the thermal conductivity λ on the periodic length lp for 30Si- doped IS-SiNSs with smooth and rough interfaces. It is noted that as lp decreases, λ first decreases to its minimum value around lp = 2.76 nm and then increases. At this critical point, the λ of IS-SiNSs with smooth and rough interfaces accounts for only 70% and 58% of that of the prestine SiNSs, respectively. The λ of IS-SiNSs is also calculated by using the Tersoff potential and the same trend is observed, indicating that the non-monotonic dependence of λ on lp is an intrinsic characteristic of IS-SiNSs and is independent of the potential used. Such non-monotonic dependence has also been observed in several other superlattice structures, including the isotope-doped silicon nanowires [21], Si/Ge superlattice [34] and graphene/nitride boron superlattice [39].
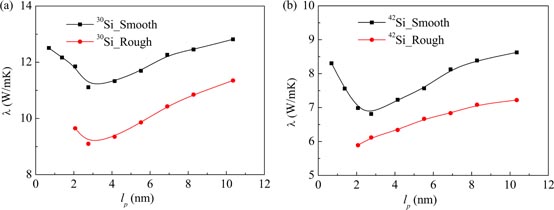
Figure 5. Dependence of the thermal conductivity λ on the perodic length lp for (a) 30Si and (b) 42Si-doped IS-SiNSs with smooth and rough interfaces.
Download figure:
Standard image High-resolution imageAt any given lp, the λ of IS-SiNSs with rough interfaces is always lower than that of IS-SiNSs with smooth interfaces. Moreover, when the 30Si atoms in the former IS-SiNSs are replaced with heavier isotopic atoms 42Si, λ turns to decrease monotonically with lp (figure 5(b)). It is noteworthy that 42Si atoms are radioactive and may not be adoptable in real applications. However, the doping of 42Si atoms allows us to study the effect of mass on isotopic doping, which may provide guidance for studying the thermal properties of other isotopic-doped superlattice structures.
The non-monotonic dependence of λ on lp can be explained by two competing mechanisms governing heat conduction in SiNSs, namely interface phonon scattering and phonon confinement effects. Firstly, the mechanism of interface phonon scattering is applied to demonstrate the reduction in λ as lp decreases. The phonon spectra P(ω) of SiNSs composed of a single type of silicon atoms (28Si, 30Si or 42Si) are calculated by performing the fast Fourier transform on the velocity auto-correlation function [40]:

where ω and vj(t) denote the angular frequency and velocity of the atom j at time t, respectively. The ensemble average in equation (1) is substituted by time averaging, which is performed over 50 ps after the realization of the equilibrium state. During the time averaging, the sample velocities are extracted from the simulation every 5 fs.
Figure 6 shows the calculated phonon spectra. It is observed that the highest frequency of the phonon modes decreases as the mass of silicon atoms increases, indicating the softening of the system. As a result, phonon spectra mismatch arises between the 28Si and 30Si (or the 28Si and 42Si) layers in IS-SiNSs, leading to incoherent phonon scattering at the layer interfaces. As the periodic length of the superlattice decreases, the number of the interfaces increases. Thus, the phonons are more frequently and intensively scattered as they propagate along the heat flux direction, and their mean free path is also significantly reduced. Hence, λ decreases as the periodic length decreases. When the interfaces of IS-SiNSs are roughened, the transmission of phonons across the interfaces becomes more diffusive, i.e., the transmitted phonons are distributed in a more random pattern, which intensifies the interface phonon scattering effect and induces an additional resistance to in-plane transport, and thus further reduces λ.
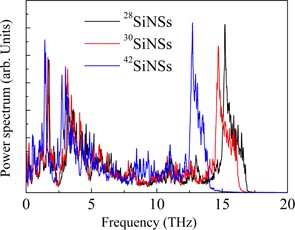
Figure 6. Phonon spectra of SiNSs composed of single types of Si atoms (28Si, 30Si or 42Si).
Download figure:
Standard image High-resolution imageBesides the interface phonon scattering effect, the spectrum mismatch between the 28Si and 30Si (or the 28Si and 42Si) layers also gives rise to the phonon confinement effect. Such an effect has previously been observed in graphene superlattice structures and found to be disadvantageous for thermal transport [41, 42].
Figure 7 shows the phonon spectra of the 28Si, 30Si and 40Si layers in the IS-SiNSs with different periodic lengths. For the IS-SiNSs with large lp = 10.35 nm, the maximum frequencies of the phonon modes in the 28Si,30Si and 42Si layers are 17.2 THz, 16.7 THz and 14.8 THz, respectively (figures 7(a) and (c)). Consequently, phonon modes with the frequency higher than 16.7 (or 14.8) THz would be confined in the 28Si layers of the 30Si-doped (or 42Si-doped) IS-SiNSs. If these modes are confined perfectly, no 30Si or 42Si atoms will be excited to vibrate at frequencies higher than 16.7 or 14.8 THz, and thus these modes will not contribute to the thermal transport. However, the confinement in real materials is not so ideal and the 30Si or 42Si atoms can be slightly excited at these high frequencies, especially for small periodic length, as indicated in figures 7(b) and (d).
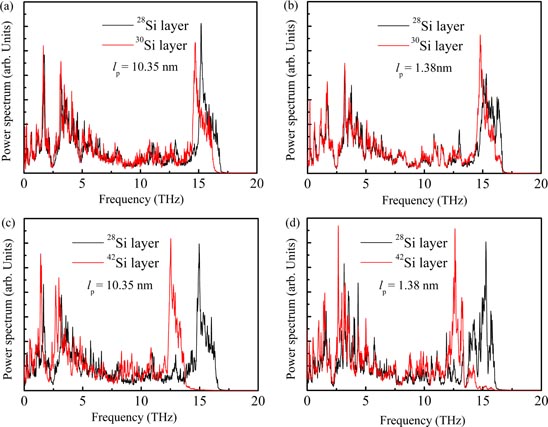
Figure 7. Phonon spectra of 28Si, 30Si and 42Si layers in the (a)–(b) 30Si- and (c)–(d) 42Si-doped IS-SiNSs with smooth interfaces for large and small periodic lengths.
Download figure:
Standard image High-resolution imageWhen the periodic length lp = 1.38, phonon modes with frequencies higher than 16.7 THz and 14.8 THz appear in the phonon spectra of the 30Si and 42Si layers, respectively, though the spectrum powers at these frequencies are weak. Hence, the confined modes are enabled to transfer heat from one layer to another at small periodic lengths, resulting in the weakening of the confinement effect.
To investigate the dependence of the confinement effect on lp, the overlap S between the phonon spectra of the neighbouring layers in the IS-SiNSs is calculated using the following formula [43]:

where P1(ω) and P2(ω) are the phonon spectra powers of the 28Si and 30Si layers (or the 28Si and 42Si layers), respectively. The larger the overlap, the less the spectra mismatch between the superlattice layers will be and thus the weaker the phonon confinement effect will be. Figure 8 shows the dependence of S on lp.
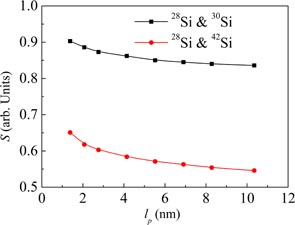
Figure 8. Dependence of the phonon spectra overlap S between the 28Si and 30Si or 28Si and 42Si layers on the periodic length lp.
Download figure:
Standard image High-resolution imageIt is noted that as lp decreases, S increases monotonically, indicating a weakening phonon confinement effect. This observation is consistent with the fact that the interaction of the confined phonon modes in different superlattice layers increases as their thickness decreases [44]. Recall that the decrease in lp also leads to an enhanced phonon scattering effect by reducing the phonon mean free path, and thus the scattering effect competes with the confinement effect in affecting the thermal conductivity. In the range of lp ⩾ 2.76 nm, the enhancement of interface scattering is dominant when lp decreases, thus leading to the decrease of λ. However, for lp ⩽ 2.76 nm, the weakening of phonon confinement becomes dominant as lp decreases, and thus results in an increase in λ. This competition mechanism gives rise to the non-monotonic dependence of λ on lp. When the interfaces inside the 42Si-doped IS-SiNSs are roughened, the interface scattering effect is enhanced and outweighs the weakening of phonon confinement even for lp ⩽ 2.76 nm, and thus leads to the continuous decrease of λ (figure 5(b)).
The normalized thermal conductivities of 30Si-doped SiNSs (41.4 nm length) with different doping patterns are summarized in table 1. The thermal conductivity of pristine 28SiNSs is denoted by λ0. It is found that IS-SiNSs have lower thermal conductivity than randomly doped SiNSs. For the IS-SiNSs with rough interfaces, their thermal conductivity is the lowest and reaches only 58% of λ0.
Table 1. Normalized thermal conductivity λ/λ0 for 30Si-doped SiNSs with different patterns.
| Randomly doped SiNSs | Smooth IS-SiNSs | Rough IS-SiNSs | |
|---|---|---|---|
| λ/λ0 | 0.79 | 0.70 (lp = 2.76 nm) | 0.58 (lp = 2.76 nm) |
The temperature dependence of λ is also investigated for both pristine and 30Si-doped SiNSs, as shown in figure 9. The period length lp of the IS-SiNSs is taken at the critical point as 2.76 nm. Since thermal vibration at low temperature has the quantum nature, classical MD simulation of it will become unreliable. For silicon nanowires and thin films, both experimental and theoretical studies show that the quantum effect becomes remarkable only when temperature is lower than 100 K [45]. Thus, the MD simulation in this study focuses on thermal conductivity above 100 K. It shows that the λ of both pristine and isotopic doped-SiNSs monotonically decrease with temperature T. At the same T, the λ of isotope-doped SiNSs is always lower than that of pristine SiNSs, and the magnitude difference becomes smaller as T increases, implying that isotopic doping is more efficient in reducing λ at lower temperatures.

Figure 9. Temperature dependence of thermal conductivity for pristine and isotopic-doped SiNSs.
Download figure:
Standard image High-resolution image
4. Conclusion
MD simulations are conducted to study the thermal conductivity λ of SiNSs. Simulation results indicate that the λ of SiNSs is around 25–30 W mK−1 and exhibits anisotropic behaviour. Moreover, it is found that isotopic doping is efficient in reducing λ. When the SiNSs are doped with 30Si atoms at a doping percentage of 50%, a maximum reduction of around 20% can be achieved. This reduction can be further increased to around 40% when the doping atoms are arranged in a superlattice structure. As the periodic length lp of the superlattice structure decreases, the thermal conductivity changes non-monotonically. The λ reaches a minimum value at the critical point lp = 2.76 nm and then increases. However, when the interfaces in IS-SiNSs are roughened, the non-monotonic dependence of λ on lp can turn monotonic if heavy isotopic atoms are doped.
Detailed analysis of the phonon spectra demonstrates that the competition mechanism between the interface scattering and the confinement effect of the phonon modes is responsible for these phenomena. This study provides useful information for the potential thermoelectric applications of silicene as well as for future investigations of thermal transport in superlattice structures.
Acknowledgments
The authors acknowledge the Academic Research Fund Tier 1 from the Ministry of Education, Singapore (Grant No M401050000). A*STAR Computational Resource Centre, Singapore, is acknowledged for providing computational support. HWZ acknowledges the National Programme on Key Basic Research Project (grant no: 2011CB013000) and the Beijing Natural Science Foundation (Grant No 2122027).