Abstract
Internal stresses (residual stresses) and their evolution under electromechanical loading play a significant role in the performance and lifetime of ferroelectric materials. Internal stresses can be induced by the manufacturing process or the packaging conditions. At a finer scale, due to the heterogeneity of ferroelectric materials (polycrystalline structure), part of the ferroelectric strain must normally be accommodated locally, resulting in internal stresses when an electromechanical load is applied. In most modelling approaches the contribution of crystalline elastic anisotropy to internal stresses is neglected compared to the domain switching contribution. Using a micromechanical modelling approach, we examine the contribution of crystalline elastic anisotropy to the macroscopic behaviour and to the internal stress distribution in ferroelectric polycrystals under electromechanical loading. It is shown that the predicted macroscopic ferroelectric strain and the level of intergranular stress can be underestimated by up to 50% if crystalline elastic anisotropy is neglected. Consequently it is recommended that, contrary to current practice, crystalline anisotropy be included in the micromechanical modelling of ferroelectric ceramics.
Export citation and abstract BibTeX RIS

Content from this work may be used under the terms of the Creative Commons Attribution 3.0 licence. Any further distribution of this work must maintain attribution to the author(s) and the title of the work, journal citation and DOI.
1. Introduction
Internal (residual) stresses and their evolution play a significant role in the performance and lifetime of electromechanical devices, especially under repeated electromechanical loading [1]. These internal stresses can arise due to manufacturing processes, material heterogeneity and the evolving ferroelectric domain structure. The latter can rapidly induce microcracking if the material is submitted to cyclic loadings, which is a primary cause of fatigue in bulk ferroelectric ceramics under a.c. conditions [2, 3]. Internal stresses also have an important influence on ferroelectric domain switching behaviour since they affect the spatial distribution of the stored elastic energy. This in turn has an impact on the macroscopic ferroelectric properties [4]. For all these reasons, a quantitative understanding of the internal stresses generated in ferroelectric materials under electromechanical loading is required. This can be addressed from a modelling approach. Micromechanical models for ferroelectric behaviour (e.g. [5–9]) include some aspects of the microstructural complexity of ferroelectric materials, and particularly their polycrystalline structure and the existence of ferroelectric domains. Most are sophisticated enough to allow the investigation of the effects of intergranular stresses, but in focusing their attention on the prediction of the macroscopic response, including the effects of the piezoelectric anisotropy they have neglected the role of crystalline elastic anisotropy. The purpose of this paper is to make use of a recently proposed multiscale model for reversible ferroelectric behaviour [10] to investigate the role of crystalline elastic anisotropy in the macroscopic behaviour and in the development of intergranular stresses in ferroelectric ceramics. Indeed high crystalline elastic anisotropy has been recently shown in ferroelectric ceramics [11] and could be a key parameter for the prediction of the performance and lifetime of piezoelectric devices. The standard classification of internal stresses is first recalled in order to define the intergranular stresses considered here. The multiscale model used for the determination of these internal stresses is then briefly described. The methodology used to investigate the role of crystalline anisotropy on ferroelectric behaviour is then presented and the results finally discussed.
2. Internal stresses in polycrystalline materials
Internal stresses in multiphase or polycrystalline materials (figure 1) are classically categorized into three types [12–15]. Type I applied or residual stresses are usually the focus in macroscopic structural analysis [16]. They do not take account of material microstructural heterogeneity. They balance externally applied forces or self-equilibrate over the whole specimen if they are residual stresses. However, polycrystalline materials are inherently heterogeneous at the grain scale since the difference in crystallographic orientation of adjacent grains makes them respond differently. Type II stresses can be defined at this scale to account for stress fluctuations between grains located close to each other but with different crystallographic orientations. The average type II stress for a given type of similarly oriented grains may be non-zero and can be measured by diffraction techniques [15]. A grain family being defined as the set of grains having a specific crystallographic orientation, the average stress σχ in a grain family χ is then the sum of type I and type II stresses. Due to the effects of the neighbouring grains, to grain boundaries, to potential micro-cracks and to intragranular defects such as precipitates or dislocations, the stress inside a grain is not uniform and fluctuations are also present at this scale. They are described by type III stresses that define the deviation at a given point from the average stress σχ in the grain family. In the case of ferroic materials, an intermediate scale could be introduced between type II and type III stresses to describe the deviation from the average stress σχ of the stress σα in a set of domains with a given orientation α.
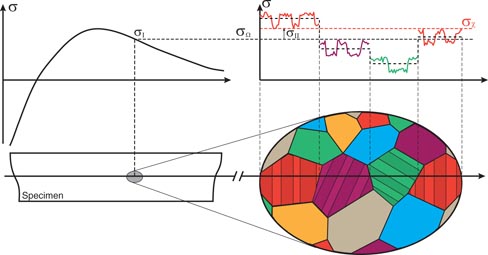
Figure 1. Schematic view of internal stresses in a polycrystalline specimen. In the polycrystal, different colours denote different grain orientations. Internal stresses can be categorized according to characteristic length scales over which they self-equilibrate. The macro-stress (σI or σΩ) is the average stress over a relatively large region including a large number of grains. Inside such a region, the second-order stress (σII) is the average deviation from the macro-stress in a given grain family. For polycrystals a grain family is defined as the set of grains having a specific crystallographic orientation. Inside a grain family, the third-order stress σIII is the deviation at a given point from the average stress σχ in the grain family. The stress σ(x) at a given point is then the sum of σI, σII and σIII. In the case of ferroic materials, an intermediate scale could be introduced between type II and type III stresses to describe the deviation from the average stress σχ in the grain family of the stress σα in a set of domains with a given orientation α. These interdomain variations (a subset of the intragranular variations) are represented on the figure with different average stress values from one domain family to another. In each grain, domain families α are shown with different shades of the grain family colour.
Download figure:
Standard image High-resolution imageIn this paper, the investigation is limited to intergranular stresses. Only average stress per grain family σχ are discussed. Interdomain stresses and type III fluctuations are not considered, although they are also affected by crystalline anisotropy. The local maximum stress levels being higher than the average stress, the effects of stress are hence underestimated. However it is believed that the average stress σχ per grain family is a good indicator of local loading and an important parameter for the prediction of fatigue or damage in piezoelectric ceramics [3, 17, 18]. It was also shown that intergranular elastic interactions significantly modulate the macroscopic response of ferroelectric ceramics [19–21]. Complementary to applied external loadings, the analysis of intergranular contributions provides a better insight into the mechanisms responsible for the performance and lifetime of ferroelectric materials and devices.
3. A multiscale model for ferroelectric behaviour
Here ferroelectric behaviour is defined using a micromechanical description [10] summarized below. A ferroelectric single crystal is described as a set of K domain families each corresponding to a given local polarization Pα. For example, K = 6 for tetragonal materials (α corresponding to the six 〈1 0 0〉 directions) and K = 8 for rhombohedral materials (α corresponding to the eight 〈1 1 1〉 directions). In each domain, the polarization Pα is uniform and aligned with an easy axis α (equation (1)). P0 is the magnitude of the spontaneous polarization of a ferroelectric domain. Each domain also undergoes a uniform ferroelectric strain
 , which depends on its orientation. Assuming that this ferroelectric strain is isochoric, the ferroelectric strain tensor can be written as a function of the saturation ferroelectric strain
 (equation (1)). I is the second-order identity tensor.

The single crystal constitutive law relies on the free energy Wα of a domain family α (equation (2)).

 is the standard piezoelectric tensor at the ferroelectric domain scale. The free energy only depends on the electromechanical loading at the single crystal scale (average electric field Eχ and stress σχ) and on material parameters (P0,
and
).
is the standard piezoelectric tensor at the ferroelectric domain scale. The free energy only depends on the electromechanical loading at the single crystal scale (average electric field Eχ and stress σχ) and on material parameters (P0,
and
).
In order to describe the complex microstructure resulting from a given electromechanical loading, the volume fraction fα of each domain family α is introduced. This internal variable has already been introduced in previous models (e.g. [7]). In the proposed approach the volume fractions are explicitly calculated (equation (3)) by means of a Boltzmann probability function [10, 22, 23].

As is an adjustment parameter. Its value can be related to the initial slope χ0 of the polarization curve under no applied stress (As = 3 χ0/P02) [10]. Assuming that the domain wall volume is negligible compared to the volume of ferroelectric domains, the response of the multi-domain single crystals can be obtained by an averaging operation over all the domain families. The dielectric induction and the total strain at the single crystal scale are then given by:

Polycrystalline behaviour can be deduced from appropriate averaging of single crystal behaviour. The classical self-consistent scheme [24] is adopted to deduce the polycrystal response from the single crystal behaviour. Given the macroscopic applied stress σΩ and electric field EΩ, the electromechanical loading at the single crystal scale is defined by equation (5).
 and
and
 are respectively the stress and electric field concentration tensors. They account for the influence of the heterogeneity of the elastic and dielectric properties on the stress and electric field distributions within the polycrystal.
 and
and
 are respectively the stress and electric field incompatibility tensors. They account for the misfit between local and overall strain or dielectric induction in the creation of internal stresses and electric field. The practical calculation of the localization operators is detailed in [10]. They derive from the resolution of basic inclusion problems [25], and depend on the single crystal properties and on the material overall properties.
 and
and
 are the inelastic strains at the macroscopic and single crystal scale respectively.
 and
and
 are the non-dielectric contributions to the dielectric induction (D* = D −
  .E) at the macroscopic and single crystal scale respectively. Initial intergranular residual stresses are usually present, notably as a consequence of the fabrication process. They can be incorporated by adding the corresponding term
 to the definition of σχ. Once the local electromechanical loading is obtained from equation (5), the free energy Wα of each domain family α is calculated (equation (2)) and then the volume fractions (equation (3)). The average response of each single crystal being known (equation (4)), the last operation is the homogenization step to define the macroscopic response of the material (equation (6)). The localization operations defined by equation (5) make use of the macroscopic response of the polycrystal
 ,
,
 so that the procedure is self-consistent.

In this paper, the calculation was performed on an isotropic polycrystal with a tetragonal structure as presented in [10]. The approach is restricted to reversible (anhysteretic) behaviour but hysteresis effects can be added afterwards by adding to the anhysteretic electric field E used in the calculation an irreversible contribution Eirr to account for the fact that additional energy is needed to reach a given polarization level compared to the idealized anhysteretic case. The detailed procedure can be found in [10]. Single crystal elastic, dielectric and piezoelectric anisotropies are taken into account through the use of material properties defined at the domain scale. Polycrystalline anisotropy is taken into account through the use of a discrete orientation distribution function to define grain orientations. Here, a 546 orientation distribution function was used to represent the pseudo-random grain orientation of the polycrystal. Except for As (which is specific to the proposed modelling), the properties used for the single crystal were taken from [26] to represent tetragonal lead zirconate titanate (PZT). Elastic behaviour was taken to be uniform within a single crystal
 and isotropic (Young's modulus EΩ = 60 GPa and Poisson's ratio νΩ = 0.37). This assumption, classical in the literature, neglects the role of crystalline elastic anisotropy and will be discussed in next section. Dielectric behaviour is taken to be uniform within a single crystal (α = χ) and isotropic (dielectric permittivity = 0.02 µF/m). The piezoelectric properties are transversely isotropic about the direction of the spontaneous polarization (d15 = 5.8 × 10⁻¹⁰ m/V, d31 = −2.1 × 10⁻¹⁰ m/V, d33 = 4.5 × 10⁻¹⁰ m/V). The spontaneous ferroelectric strain is
 and the spontaneous polarization is P0 = 0.3 C m−2. The value for As is 10−5 m3 J−1.
The model allows the prediction of polarization and strain of single crystals, and textured or isotropic polycrystals under complex electromechanical loadings [10]. It can be applied to thin films if the corresponding crystallographic texture and initial residual stresses
due to fabrication process are known. The analysis is conducted here on a bulk polycrystal. The model not only provides the macroscopic polarization-electric field and strain-electric field curves but also an estimate of intergranular (type II) internal stresses in the grains of a polycrystal as a function of their crystallographic orientation. In principle initial residual stresses should be considered in equation (5). Such internal stresses can arise as a consequence of the fabrication process, for instance resulting from thermal strain mismatch due to anisotropic coefficients of thermal expansion. This study only aims at examining the influence of elastic anisotropy. The initial state (no applied stress–no electric field) is assumed to be a residual stress-free state
 so that the subsequent intergranular stresses are the results of domain switching and intrinsic piezoelectric effects only. These intergranular stresses are extracted from the calculation and plotted in figure 2 as a function of the applied electric field when no macroscopic stress is applied. They are shown in terms of the maximum principal tensile stress
 , the maximum principal compressive stress
 and the maximum shear stress τmax within the material. To extract these values, the average intergranular stress tensor has been recorded for each crystallographic orientation. The diagonal principal stress tensor has then been calculated (see Mohr's circles inset in figure 2). The maximum value over all the crystallographic orientations has then been selected for the plot. Figure 2 thus gives an estimate of the maximum level of intergranular (type II) stresses in a polycrystal under no applied macroscopic (type I) stress. It is clear from this figure that even in the absence of macroscopic mechanical loading the levels of local stress are very significant. If repeated loading is considered these levels of stress can lead to fatigue and failure. Moreover, it should be remembered that the internal stresses in the polycrystal are underestimated by this method since intragranular fluctuations are not considered.
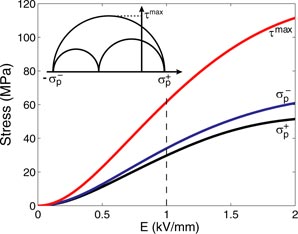
Figure 2. Maximum intergranular stress values (type II) within the polycrystal as a function of the applied electric field under no macroscopic applied stress
 .
is the maximum tensile principal stress,
is the maximum compressive principal stress (absolute value) and τmax is the maximum shear stress within the material.
.
is the maximum tensile principal stress,
is the maximum compressive principal stress (absolute value) and τmax is the maximum shear stress within the material.
Download figure:
Standard image High-resolution image4. Method to analyse the role of crystalline elastic anisotropy
In the previous section the elastic behaviour of the grains was considered to be isotropic. Single crystal elastic anisotropy is often neglected because of its contribution to the overall behaviour supposed negligible compared to domain switching [27]. This section aims at a quantitative evaluation of this contribution. For a single crystal with cubic elastic symmetry, the principle is to consider several crystalline elastic stiffness tensors having different anisotropy ratios r (r = (C11 − C12)/2C44). Here the elastic coefficients for the single crystal have been chosen so as to give the same isotropic macroscopic elastic stiffness according to a self-consistent scheme. The calculations are detailed below. We consider a PZT polycrystal with an isotropic elastic behaviour at the macroscopic scale. The elastic properties can then be expressed in terms of Young's modulus EΩ and Poisson's ratio νΩ. We choose the same properties as in the previous section. These properties can also be expressed in terms of shear modulus μΩ and bulk modulus kΩ:

Several values of crystalline elastic anisotropy can lead to the same macroscopic properties. The elastic properties of the single crystal obey the cubic symmetry and are given by two shear moduli
 and
and
 and a bulk modulus kχ (equation (8)). The anisotropy ratio r is defined by
 .
.
The effective isotropic elastic properties of the polycrystal can be deduced from single crystal properties using standard homogenization procedures [28]. They are given by the effective shear modulus
 and bulk modulus
 :
:

μ* and k* are the shear and compressibility modulus of the Hill constraint tensor given by equation (10).

 and
and
 are respectively the shear and bulk modulus of the isotropic infinite medium chosen for the basic Eshelby inclusion problem on which the homogenization procedure is based [28]. If the self-consistent scheme is chosen,
 and
and
 . Introducing this scheme in equation (9), for given macroscopic properties EΩ and νΩ, and for a given crystalline anisotropy ratio r, the crystalline elastic properties can be expressed as:
with
It is then possible to define different sets of crystalline elastic coefficients (
,
, kχ) corresponding to different local anisotropy ratio r but leading to the same macroscopic elastic properties (μΩ, kΩ). The influence of crystalline anisotropy on the macroscopic properties and on the distribution of intergranular stresses can hence be investigated. This is the object of next section.
5. Role of crystalline elastic anisotropy on macroscopic response and intergranular stresses
The material parameters used in section 3 are kept for this study, except for the crystalline elastic properties which are now taken to be anisotropic (cubic symmetry). The macroscopic elastic properties are kept constant (EΩ = 60 GPa and νΩ = 0.37). A range of crystalline anisotropy ratios r from 0.25 to 2 is considered. As an example, an anisotropy ratio of 0.3 has been found recently in a rhombohedral PZT 55-45 ceramic [11]. The loading configuration considered here is an applied field of 1 kV mm−1 combined with a uniaxial compression stress of amplitude σ along the same direction.
Figure 3 shows the predicted changes in macroscopic induction as a function of the anisotropy ratio r. The calculation has been performed for five levels of applied compressive stress from 0 to 200 MPa. The reference level of dielectric induction for an isotropic single crystal (r = 1) under stress for an applied field of 1 kV mm−1 is given in the inset.
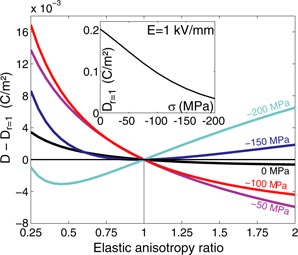
Figure 3. Changes in the predicted macroscopic induction as a function of the elastic anisotropy ratio r = (C11 − C12)/2C44 for different levels of applied compressive stress σ (electric field 1 kV mm−1, compression stress parallel to the electric field). The inset shows the reference dielectric induction for the isotropic single crystal (r = 1).
Download figure:
Standard image High-resolution imageThe dielectric response shows a moderate sensitivity to the crystalline elastic anisotropy. In the absence of applied stress and for an electric field of 1 kV mm−1, the variations due to elastic anisotropy are less than 2% in the range of anisotropy ratios considered here. This is related to the fact that an isotropic permittivity has been considered for the single crystal, so that the material is homogeneous from the dielectric point of view. The only heterogeneity effects arise from domain switching and piezoelectric effect that creates an heterogeneity of stress within the material. These effects tend to increase with increasing compressive stress. At 1 kV mm−1 under a 100 MPa compressive stress, the predicted dielectric induction is 15% higher for r = 0.3 and 4% lower for r = 1.7 compared to the isotropic configuration (r = 1). It can also be noticed that the sensitivity evolves non monotonically with the level of compressive stress. This can be explained by the multiplicity of the mechanisms by which stress acts on the macroscopic response. The effect of stress on domain switching is first dominant but then tends to saturate while the piezoelectric effect evolves linearly with the applied stress. The effect of crystalline elastic anisotropy remains here a second-order effect compared to the effect of the applied electric field.
Figure 4 shows the predicted changes in macroscopic strain as a function of the anisotropy ratio r. The calculation has also been performed for five levels of applied compressive stress from 0 to 200 MPa with an applied field of 1 kV mm−1. The reference level of strain for an isotropic single crystal (r = 1) under stress for an applied field of 1 kV mm−1 is given in the inset. In the calculation, the zero strain level has been taken as the strain under no applied electric field for the considered level of stress. This means notably that the elastic contribution to the macroscopic strain is not represented here.
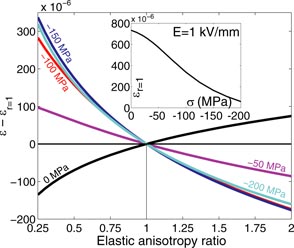
Figure 4. Changes in the predicted macroscopic strain as a function of the elastic anisotropy ratio r = (C11 − C12)/2C44 for different levels of applied compressive stress σ (electric field 1 kV mm−1, compression stress parallel to the electric field). The inset shows the reference strain for the isotropic single crystal (r = 1).
Download figure:
Standard image High-resolution imageThe predicted macroscopic strain depends strongly on the crystalline elastic anisotropy ratio. At 1 kV mm−1 and even in the absence of applied stress, the predicted strain is 16% lower for r = 0.3 and 8% higher for r = 1.7 compared to the isotropic configuration (r = 1). The variation reaches 75% under a 100 MPa compression for an anisotropy ratio of 0.3. In other terms, for r = 0.3, the predicted macroscopic ferroelectric strain is overestimated by nearly 20% under no applied stress and underestimated by 43% under a compressive stress of 100 MPa if crystalline elastic anisotropy is neglected in the calculation. In that case it means that the contribution of elastic anisotropy to the macroscopic strain is of the same order of magnitude as that of domain switching and intrinsic piezoelectric effects. The change in strain as a function of the anisotropy ratio reaches a maximum for a compression level of 100 MPa and then stabilizes. However, since the strain decreases with the applied compressive stress (see insert of figure 4), the relative variation keeps increasing with stress intensity. It is also noteworthy that the application of a compressive stress first suppresses the role of elastic anisotropy essentially to zero at around −25 MPa but that at stresses above this it becomes increasingly significant until saturation is reached around −100 MPa.
Thus, a knowledge of crystalline anisotropy is needed for the prediction of the macroscopic strain response of ferroelectric ceramics. This is related to the influence of local anisotropy in the distribution of internal stresses, which influence in return intrinsic and extrinsic piezoelectric effects. The dependence of predicted intergranular stresses to crystalline anisotropy is shown in the following.
Figure 5 shows the difference between the maximum intergranular compressive principal stress
and the applied stress σ as a function of the crystalline elastic anisotropy ratio r. It gives a picture of how crystalline anisotropy influences the prediction of type II internal stresses. The method to calculate
is the same as defined in section 3. The calculation has been performed for five levels of compressive stress between 0 and 200 MPa, under an applied electric field of 1 kV mm−1.

Figure 5. Maximum principal compressive stress variations by comparison to the applied stress σ as a function of the single crystal anisotropy ratio r = (C11 − C12)/2C44 for different levels of applied compressive stress σ (electric field 1 kV mm−1, compression stress parallel to the electric field). This plot shows the influence of crystalline anisotropy on the prediction of type II internal stresses in ferroelectric ceramics.
Download figure:
Standard image High-resolution imageIt is clear that the difference between the applied stress and the maximum local stress is significant whatever the anisotropy ratio. This is the mark of intergranular stress heterogeneity within the material. The application of a compressive stress first tends to reduce intergranular stress heterogeneity for stresses up to 50 MPa, but the stress heterogeneity then goes up again. The reasons for this non monotonic effect lies in the competitive influence of domain switching, piezoelectric effect and elastic heterogeneity contributions.
The crystalline elastic anisotropy ratio plays a significant role in the prediction of internal stress fluctuations within the material. The influence is negligible in the absence of applied stress but increases with stress intensity. For an anisotropy ratio r = 0.3, the predicted maximum deviation of stress from the applied stress σ is 16 MPa under an applied compressive stress of 100 MPa, and 50 MPa under 200 MPa, to be compared to 10 MPa and 26 MPa respectively obtained when considering an isotropic single crystal. This means that for r = 0.3 the maximum principal component of the type II stress tensor (σII) is underestimated by nearly 40% at 100 MPa and 50% at 200 MPa if crystalline anisotropy is ignored. Considering isotropic crystal behaviour can then provide a misleading estimate of internal stresses in ferroelectric ceramics.
The curves obtained exhibit discontinuities in slope. The reason for this is that the plotted curves are actually the envelopes of stress curves for all crystallographic orientations. The crystallographic orientation subjected to the highest loading intensities varies as a function of the elastic anisotropy, and the 'knees' on the curves show the anisotropy ratios at which the most-loaded crystallographic orientation shifts from one orientation to another.
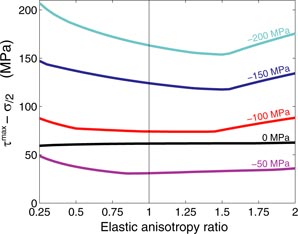
The results can also be plotted for the maximum shear stress τmax obtained by the same method. Figure 6 shows the difference between the maximum intergranular shear stress τmax and the macroscopic shear stress
 as a function of the crystalline elastic anisotropy ratio r.
Figure 6. Maximum shear stress variations by comparison to the macroscopic shear stress
as a function of the single crystal anisotropy ratio r = (C11 − C12)/2C44 for different levels of applied compressive stress σ (electric field 1 kV mm−1, compression stress parallel to the electric field). This plot shows the influence of crystalline anisotropy on the prediction of type II internal stresses in ferroelectric ceramics.
Download figure:
Standard image High-resolution image
Very similar conclusions can be drawn from the analysis of maximum shear stress τmax as for the maximum compressive stress
. We observe however much higher amplitudes in the intergranular variations. The influence of crystalline elastic anisotropy is again negligible under no applied stress but increases with stress intensity. For an anisotropy ratio r = 0.3, the predicted maximum variation of shear stress (compared to the macroscopic shear stress
) is 85 MPa under an applied compressive stress of 100 MPa, and 200 MPa under 200 MPa, to be compared to 76 MPa and 163 MPa respectively obtained when considering an isotropic single crystal. In that case (r = 0.3) it means that the maximum shear component of the type II stress tensor (σII) is underestimated by 10% at 100 MPa and 18% at 200 MPa if crystalline anisotropy is ignored.
The results presented here have considered a specific material under a specific loading. The sensitivity of both the macroscopic response and the internal stress distribution to crystalline anisotropy depends on material parameters. Different materials exhibit a different balance between the respective roles of domain switching, intrinsic piezoelectric effect and internal stresses. The sensitivity to crystalline anisotropy varies also as a function of the applied electromechanical loading. The proposed micromechanical model provides a way of assessing this sensitivity for different materials and for a whole gamut of multiaxial loading configurations.
6. Conclusions
The role of crystalline elastic anisotropy on the ferroelectric response of polycrystalline ceramics has been investigated using a micromechanical model. Crystalline elastic anisotropy was found to have a significant influence on the macroscopic strain-electric field response of ferroelectric ceramics under electromechanical loading. For an anisotropy ratio r = 0.3, the predicted macroscopic ferroelectric strain under an electric field of 1 kV mm−1 is overestimated by nearly 20% under no applied stress and underestimated by 43% under a compressive stress of 100 MPa if crystalline anisotropy is neglected in the calculation. From the variations of the average intergranular (type II) stresses as a function of the single crystal elastic anisotropy ratio, it can be concluded that, although domain switching and intrinsic piezoelectric effects are the main contributors to internal stresses in ferroelectric ceramics, material elastic heterogeneity also plays a significant role. In the case of an applied field of 1 kV mm−1 under uniaxial compression and for a crystalline anisotropy ratio r = 0.3, it was found that the maximum component of type II stresses is underestimated by 40% under a uniaxial compression of 100 MPa and 50% under a uniaxial compression of 200 MPa if crystalline elastic anisotropy is neglected.
This modelling study has considered only the effect of crystalline elastic anisotropy. Other sources of intergranular stresses can be considered, and notably in connection with specific fabrication procedures. Further work would be required to quantify the level of these internal stresses that can also contribute significantly to the behaviour of ferroelectrics. The present study considering an elastic anisotropy typical of PZT ceramic shows the key influence of crystalline anisotropy on both macroscopic behaviour and internal stresses distribution in ferroelectric polycrystals. This suggests that, contrary to current practice, crystalline anisotropy should not be neglected in the modelling of ferroelectric behaviour. This is particularly the case when repeated electromechanical loading is considered. It is expected that models underestimating the variations of internal stresses in piezoelectric ceramics will fail to predict damaging and fatigue processes successfully. The design of optimized smart devices based on ferroelectric materials should then include crystalline elastic anisotropy effects as a significant factor on both macroscopic response and lifetime prediction. The proposed micromechanical model provides an efficient tool to quantitatively evaluate the role of local anisotropy effects for different material properties and different loading configurations.
Acknowledgments
This work was supported at the University of Manchester by the Engineering and Physical Sciences Research Council (EPSRC) under the grant EP/J010685/1. LD gratefully acknowledges sabbatical leave support granted by Univ Paris-Sud.