


Abstract
Half-life values are widely used in nuclear chemistry to model the exponential decay of the activity of radionuclides. The analysis of existing half-life data values reveals a general lack of information on the performed experiments and, in a few cases, an almost complete absence of uncertainty budgets. This is the situation for 31Si, the radionuclide produced via neutron capture reaction recently used to quantify trace amounts of 30Si in a sample of the 28Si-enriched material produced for the determination of the Avogadro constant. In particular, the now recommended 157.36(26) min value is the weighted average of ten data acquired between the 40s and the 90s and published without a detailed discussion of the uncertainty budget. In order to improve the 31Si half-life value we carried out repeated observations of the 31Si decay rate via γ-ray spectrometry measurements. This paper reports the result we obtained, including details of the experiment and the evaluation of the uncertainty.
Export citation and abstract BibTeX RIS
1. Introduction
A special issue of the journal Metrologia was recently dedicated to the evaluation of uncertainties in radionuclide metrology [1]. The measurement of the half-life, t1/2, of radionuclides was one of the covered topics [2]. In particular, it was reported that for many radionuclides the dispersion of the half-life values obtained in different determinations is larger than anticipated from their uncertainties. Moreover, details on the experiment and how the uncertainty was evaluated are occasionally missing.
The reliability of recommended half-life values concerns different fields, including analytical techniques based on radioactivity [3]. Since half-life correction factors are used to rescale the measured activities to a reference time, the value of the half-life may bias the result of the quantified analyte and error propagation may affect the combined uncertainty.
This was the case of a recent measurement of the 30Si mole fraction, x(30Si), of a silicon single crystal highly enriched in 28Si used for the determination of the Avogadro constant [4]. The relative contribution of the adopted 31Si t1/2 value [5] to the combined uncertainty of x(30Si) was 35%. Although the data used to derive the recommended value are not discrepant, a close check of the referenced papers confirms the lack of details on experiments and uncertainty evaluation. For example, the uncertainty of one of the most recent published data [6] was intentionally increased from 0.012 min to 0.5 min by evaluators [5] to account for systematic effects.
Hence, aiming at improving the knowledge of the 31Si half-life, we carried out an experiment based on neutron activation and γ-counting. Details of the measurement are reported in the following, including the equation model, the corrections and the uncertainty budget of the result.
2. Measurement model
The way we propose to measure the 31Si t1/2 is to carry out an experiment consisting of production of 31Si via neutron capture reaction and observation of the exponential decay of the 31Si activity via γ-ray spectrometry. The observation is a series, hereafter called sequence, of successive count rate measurements of the 1266.1 keV γ-photons emitted during the radioactive decay of a 31Si source [2]. The experiment is repeated several times to reduce the statistical uncertainty.
The 1266.1 keV γ-photons count rate at the beginning of the ith count of the jth sequence, Cij(tdij), starting at tdij and lasting tcij, is
where λ = ln(2)/t1/2 is the 31Si decay constant, nij, δij and fij are the net count of the 1266.1 keV γ-photon peak, the dead time correction and the pile-up correction of the ith count of the jth sequence, respectively.
The nij value is obtained by subtracting the background count, bij, from the gross count, gij. The δij and fij values depend on the rate of pulses at the input gate of the γ-spectrometer and correct for the lost counts due to dead time and pile-up, respectively. In the case of λtcij ≪ 1 and tdeadij ≪ tcij,
where tdeadij is the dead time during tcij, i.e. the overall time the detection system spent with the input gate inhibited, and µ is a (positive) constant, hereafter called pile-up factor, due to residual errors after compensation for count loss following leading edge pile-up. Hereafter, tdeadij/tcij is defined as the relative dead time obtained by measuring in live-time correction mode and indicates the fraction of lost counts during tcij. In the case of a low rate of pulses, ρ, at the input gate of the γ-spectrometer, tdeadij/tcij corresponds to ρτ, where τ is the dead time per pulse [2].
In equation (2), tdeadij/tcij might be replaced by ρτ to compute the pile-up correction as a function of ρ. However, the knowledge of ρ would requires an additional rate meter connected to the electronics whereas the tdeadij/tcij value is directly measured with negligible uncertainty and embedded in the γ-spectrum information.
The Cij(tdij) value is proportional to the 31Si activity, with the constant of proportionality being the detection efficiency of the γ-photons, η, which takes into account (i) the source-detector geometry, (ii) the intrinsic efficiency for the particular gamma-ray energy, (iii) the incomplete absorptions due to Compton scattering and (iv) the probability of emission of the observed gamma radiation.
If the jth sequence of counts is performed without moving the source and under stability conditions of the detection system, ηj is constant and the variation of the count rate, equation (1), with time can be modeled by

where  is the expected value of the count rate at the starting time of the first count of the jth sequence, td1j, and εij is the error term, i.e. the deviation of the count rate mainly due to counting statistics. Here and hereafter, the mark (^) is used to define the expected value only in the equations used as fitting models and omitted elsewhere.
3. Experiment
The detection system used in this study consists of a coaxial Ge detector ORTEC® GEM50P4-83 (relative efficiency 50%, resolution 1.90 keV FWHM at 1332 keV) connected to a digital signal processor ORTEC DSPEC 502.
The rise time and flat top digital filter shaping-time constants were set to 12 µs and 1 µs, respectively, corresponding to a dead time per pulse, τ, of approximately 38 µs [7]. The acquisition was performed in extended live-time correction mode according to Gedcke-Hale method with pulse pile-up rejection in automatic set threshold; the system corrected for coincident pulses with the exception of events closely spaced in time below its fast time resolution.
Since the end cap of the detector is placed inside a low-background graded lead shield located in an underground laboratory, the input pulse rate due to background is limited to approximately 15 pulses per second. The temperature of the room is controlled at 23 °C.
The stability of the detection system was checked by recording a sequence of 750 successive counts of the 661.8 keV γ-photons emitted during the radioactive decay of a 137Cs source. The uninterrupted observation time was 375 h.
The pile-up correction factor was measured by performing several counts of the 661.8 keV γ-photons of the 137Cs source with the addition of a 152Eu source located at different positions with respect to the detector end cap to change the rate of pulses at the input gate of the γ-spectrometer [8]. Two sequences of 34 counts were repeated with the 152Eu source in six different positions and two sequences of 34 counts were repeated without the 152Eu source. The overall observation time was 320 h and consisted of 476 counts.
In both cases, the 137Cs source was fixed at about 60 mm from the detector end cap to keep constant the detection efficiency of the 661.8 keV γ-photons. In addition, the counting window, tc, was adjusted on line to reach a 0.1% relative uncertainty of the 661.8 keV γ-peak net count due to counting statistics, i.e. a net count value close to 106.
The measurement of the 31Si half-life was carried out with a 6 g sample of a high purity natural silicon single crystal. This sample was used as a 31Si source produced by the activation of 30Si via the neutron capture reaction 30Si(n,γ)31Si. Twelve repeated neutron activations and observations of the decay rate were performed. On average, a single sequence lasted 400 min and consisted of 26 successive counts. The overall observation time was 169 h and consisted of 310 counts.
Each neutron irradiation lasted 3 h and was carried out at the central thimble of a 250 kW TRIGA Mark II reactor. After activation, the 31Si source was fixed at about 10 mm from the end cap of the detector. The 31Si decay rate was observed by recording a sequence of counts of the 1266.1 keV γ-photons collected with a constant detection efficiency. The counting window was adjusted on line to achieve a 1% relative uncertainty of the 1266.1 keV γ-peak net count due to counting statistics, i.e. a net count value close to 104.
4. Data analysis and discussion
The net areas of the γ-peaks were estimated from the collected spectra using the WAN32 analysis algorithm of the ORTEC® Gamma Vision software [9].
The zoom of three γ-spectra showing the 661.8 keV 137Cs γ-peak and fit residuals collected during the measurement of the pile-up correction factor is plotted in figure 1. The γ-peak in figures 1(a)–(c) refers to a relative dead time of the detection system, tdeadij/tcij, of 0.077, 0.188 and 0.286, respectively.

Figure 1. Zoom of three γ-spectra collected during the measurement of the pile-up correction factor showing the 661.8 keV 137Cs γ-peak and the fit residuals obtained with (a) 0.077, (b) 0.188 and (c) 0.286 relative dead time.
Download figure:
Standard image High-resolution imageThe zoom of three γ-spectra showing the 1266.1 keV 31Si γ-peak and fit residuals collected during a sequence performed for the measurement of the 31Si half-life is plotted in figure 2. The γ–peak in figures 2(a)–(c) refers to a tdeadij/tcij, of 0.079, 0.191 and 0.287, i.e. at the end, middle and start count of the sequence, respectively.

Figure 2. Zoom of three γ-spectra collected during the measurement of the 31Si half-life showing the 1266.1 keV 31Si γ-peak and the fit residuals obtained with (a) 0.079, (b) 0.191 and (c) 0.287 relative dead time.
Download figure:
Standard image High-resolution image4.1. Stability and pile-up of the detection system
The stability and pile-up factor of the detection system was checked and measured, respectively, by processing the γ-spectra recorded during the sequences of counts of the 137Cs source.
The count rate of the 137Cs 661.8 keV γ-photons measured at the ith count of the jth sequence, Cij(tdij), and corrected for decay at the starting time of the first count of the first sequence, td11, is
where Cij(tdij) is obtained from (1) using the 137Cs decay constant, λ(t1/2 = 30.08y), and the net count of the 661.8 keV γ-peak, nij. Since the γ-photons counting was performed with a constant detection efficiency, Cij(td11) is constant as well.
In addition, the following model applies:

where  is the expected value of Cij(td11) and
  is the γ-photons count rate measured at the ith count of the jth sequence uncorrected for pile-up and corrected for decay at td11.
The single sequence of 750 counts collected for the stability test was performed at a fixed relative dead time/input pulse rate, 0.077 (i.e. 7.7% of lost counts)/2000 s−1. Therefore, j = 1 (single sequence) and i = 1, 2, ..., 750 (counts); the δi1 and fi1 values are constant. In the case of a stable detection system, the ratio of the Ci1 (td11) value, obtained from equation (4), to the average of the Ci1 (td11) values, Cave1 (td11), must vary due to counting statistics around the expected unity value without a deterministic drift. This was the case of the ratios obtained in this study and plotted in figure 3.
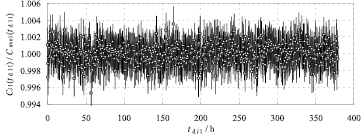
Figure 3. The normalized measured count rate of the 137Cs source corrected for decay as a function of time. The error bars indicate a 95% confidence interval due to counting statistics.
Download figure:
Standard image High-resolution imageThe average relative uncertainty due to counting statistics of the 661.8 keV γ-peak net count and evaluated by the WAN32 analysis algorithm is 1.048 × 10⁻³ whereas the experimental standard deviation of the ratios is 1.064 × 10⁻³. The experimental standard deviation is 1.5% higher than the expected standard deviation according to Poisson statistics. This (small) difference might be due to medium frequency instability of the detection system.
The fourteen sequences of 34 counts collected for the measurement of the pile-up factor were performed with the detection system working at seven different relative dead times/input pulse rates, i.e. 0.077/2000 s−1 (1st and 8th sequence), 0.116/3000 s−1 (2nd and 9th sequence), 0.153/4000 s−1 (3rd and 10th sequence), 0.189/5000 s−1 (4th and 11th sequence), 0.220/6000 s−1 (5th and 12th sequence), 0.253/7000 s−1 (6th and 13th sequence), and 0.288/8000 s−1 (7th and 14th sequence). Therefore, j = 1, 2, ..., 14 (sequences) and i = 1, 2, ..., 34 (counts); the δij and fij values are changing according to equation (2).
Linear least squares regression is applied to estimate the pile-up factor, µ, by fitting a straight-line to the natural logarithm of equation (5) averaged with respect to the 34 counts of the jth sequence,  , and normalized to the
  value. Expressly, the measured variable, yij, is
 ![$\ln \left[{{C}_{\text{pu} ~\text{ave}j}}\left({{t}_{\text{d11}}}\right)\text{/}{{C}_{\text{pu}11}}\left({{t}_{\text{d11}}}\right)\right]$](https://content.cld.iop.org/journals/0026-1394/54/3/410/revision2/metaa6edfieqn006.gif) , the independent variable xij is tdead avej/tc avej and the estimated parameters are the intercept
, the independent variable xij is tdead avej/tc avej and the estimated parameters are the intercept ![$\ln \left[{{\hat{C}}_{ij}}\left({{t}_{\text{d11}}}\right)\text{/}{{C}_{p\text{u}11}}\left({{t}_{\text{d11}}}\right)\right]$](https://content.cld.iop.org/journals/0026-1394/54/3/410/revision2/metaa6edfieqn007.gif) and the slope −µ. Since the main contribution to the uncertainty of
and the slope −µ. Since the main contribution to the uncertainty of  is the fixed 0.1% relative uncertainty of the 661.8 keV γ-peak net count, the standard deviation of the error term of yij,
  , is constant and close to
  .
.
The straight line fitting the data and the residuals are shown in figures 4(a) and (b), respectively. The error bars confirm that the logarithm of uncertainties due to counting statistics are constant. Thus, the straight-line fitting is recommended instead of the exponential function fitting required in the case of non-adapted uncertainties.

Figure 4. The straight line (a) and the residuals (b) obtained by fitting the data collected to determine the pile-up factor. The data collected in two repeated sequences for each tdead avej/tc avej value are shown. The error bars indicate a 95% confidence interval due to counting statistics.
Download figure:
Standard image High-resolution imageSince the residuals of three out of fourteen data are somewhat larger than the expanded uncertainty due to counting statistics, there must be an additional influence factor affecting the estimated 4.45(8) × 10–3 pile-up factor, µ. Here and hereafter the uncertainties (k = 1) in parentheses apply to the last respective digits. Furthermore, the µ value obtained using the 152Eu as interfering source might be biased due to a possible energy dependence of the correction [10]. In fact, the 152Eu γ-spectrum includes 23 γ-peaks with energies between 120 keV and 1500 keV; the resulting effect is different with respect to the pile-up occurring in the case of single 1266.1 keV 31Si γ-peak counting.
It may be observed that the residuals confirm the application of the pile-up correction defined in (2) at least up to relative dead times/input count rates close to 0.300/8300 s−1. In addition, the fraction of the 38 µs dead time per pulse equivalent to µ is 0.17 µs and represents the ultimate limit of the pile-up rejection system.
4.2. The decay constant of 31Si
The decay constant of 31Si was determined by processing the γ-spectra recorded during the twelve sequences of counts of the neutron activated 31Si source. The duration of a single sequence and the number of performed counts, N, depended on the 31Si activity at the start of the observation. Specifically, the N values were 26 (1st sequence), 29 (2nd sequence), 25 (3rd sequence), 28 (4th sequence), 26 (5th sequence), 32 (6th sequence), 25 (7th sequence), 14 (8th sequence), 27 (9th sequence), 31 (10th sequence), 25 (11th sequence) and 22 (12th sequence).
The relative dead time/input pulse rate varied, on average, from 0.30/8300 s−1 (tc = 460 s) to 0.06/1400 s−1 (tc = 33 min) whereas the maximum and the minimum values, 0.31/8600 s−1, and 0.03/550 s−1, were reached at the first and last count of the 6th sequence which lasted 9.2 h. Furthermore, the ratio of the background count, b, to the net count, n, of the 31Si 1266.1 keV γ-photons, α, was in the range between 0.010 and 0.035. Since the collected net count values were close to 104, the background counts beneath γ-peak ranged from 100 to 350 (170 in the examples of the 1266.1 keV γ-peaks in figure 2), corresponding to γ-peak background rates from 9 × 10⁻⁴ s−1 to 0.8 s−1, respectively.
The count rate of the 1266.1 keV γ-photons at the beginning of the ith count of the jth sequence, Cij(tdij), is computed according to (1), where j = 1, 2, ..., 12 and i = 1, 2, ..., N. The δij and fij values are obtained from (2).
Linear least squares regression is applied to estimate λ, and the corresponding t1/2, by fitting twelve straight lines to the twelve series of data obtained by taking the natural logarithm of (3) normalized to the  value. Specifically, the measured variable, yij, is
 ![$\ln \left[{{C}_{ij}}\left({{t}_{\text{d}ij}}\right)\text{/}{{C}_{1j}}\left({{t}_{\text{d1}j}}\right)\right]$](https://content.cld.iop.org/journals/0026-1394/54/3/410/revision2/metaa6edfieqn012.gif) , the independent variable xij is tdij and the estimated parameters are the twelve intercepts,
, the independent variable xij is tdij and the estimated parameters are the twelve intercepts, ![$\ln \left[{{\hat{C}}_{j}}\left({{t}_{\text{d}1j}}\right)\text{/}{{C}_{1j}}\left({{t}_{\text{d1}j}}\right)\right]$](https://content.cld.iop.org/journals/0026-1394/54/3/410/revision2/metaa6edfieqn013.gif) , and the shared slope, −λ. Since yij depends on λ, the solution is obtained iteratively until convergence.
, and the shared slope, −λ. Since yij depends on λ, the solution is obtained iteratively until convergence.
The main contribution to the uncertainty of Cij(tdij) is the 1% relative uncertainty of the 1266.1 keV γ-peak net count. Therefore, the standard deviation of the error term of yij, εij/Cij(tdij), is constant and equal to 0.01.
The regression analysis was performed with the Levenberg Marquardt algorithm of the OriginLab® software using the line model in global multi-data fit mode [11]. The twelve straight lines fitting the data and the residuals plotted with respect to tdij − td1j are shown in figures 5(a) and (b), respectively. The error bars confirm that the logarithm of uncertainties due to counting statistics are constant.
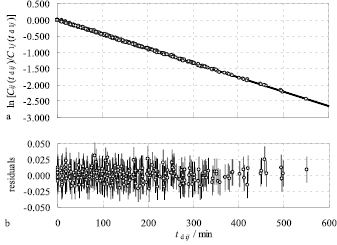
Figure 5. The twelve straight lines (a) and the residuals (b) obtained by fitting the data collected to determine the 31Si decay constant. The error bars indicate a 95% confidence interval due to counting statistics.
Download figure:
Standard image High-resolution imageThe resulting 31Si decay constant, λ, is 4.4103 × 10⁻³ min−1 with an associated (fitting) uncertainty of 0.0046 × 10⁻³ min−1. It should be noted that the multi-data fitting of twelve repeated observations of 31Si lasting about 3 half-lives allowed to average the effect of counting statistics and to reach a 0.1% (fitting) uncertainty.
4.3. Uncertainty
In the case of an ideal linear relationship between the activity of the source and the counting rate of the detection system, the residuals are expected to be pure stochastic and due to the Poisson nature of radioactive decay. Thus, the only contribution to the uncertainty of λ would be the fitting. However, medium- (cyclic) and low-frequency (drift) deviations must carefully be considered because they can significantly affect the uncertainty also when they are hidden in the residuals. The most important sources of these deviations are (i) instability of the detection efficiency, (ii) pile-up and dead time, (iii) geometrical changes in source positioning, (iv) spectral interference and (v) background signals [2].
The effect of counting statistics can be anticipated using equations (34) and (37) reported in [2] and based on the number, N, of activity measurements, A, and associated relative uncertainties, u(A)/A, repeated at regular time during an observation lasting T. Although in this study the activity (count rate) measurements, were not equally spaced in time, the resulting relative uncertainty, u(λ)/λ, with T = 400 min, N = 26 and u(A)/A = 0.01 is about 0.003 for a single sequence. The corresponding value for the mean of twelve of these sequences, 0.0009, is close to the evaluated (fitting) relative uncertainty, 0.0010.
The results of the stability test didn't show significant additional variability from any cyclic variations or drift of the detection efficiency system other than the expected statistical 0.001 relative standard deviation. Thus, 30% of this standard deviation is conservatively assigned as potential maximum drift of the system during a single sequence and the corresponding 0.0003 is given as a reasonable upper limit for the contribution to u(A)/A.
The pile-up correction, f, obtained from (2) with a pile-up factor, µ, of 4.45 × 10⁻³ and a relative dead time, tdead/tc, of 0.30 (at the start count of a sequence) and 0.06 (at the end count of a sequence) is 1.0013 and 1.0003, respectively. Due to the energy dependence of µ, a conservative 30% error is assigned to the (corrected) 0.001 relative variation of f between the start and end counts of a sequence and leads to an average relative uncertainty,  , i.e. at t = 0 and t = 400 min, of 0.000 15 [2]. Since the counting time, tc, and the dead time, tdead, are known with a negligible uncertainty, the contribution to u(A)/A of the dead time correction, δ, obtained from (2) is negligible as well.
During a single observation, the position of the 31Si source was fixed with respect to the detector, therefore the effect of geometrical changes in source positioning is absent.
Given the high-purity of the silicon sample used as a source, the 1266.1 keV γ-peak was free from spectral interference. The Compton continuum underlying the γ-peak was approximately flat and due to natural background (see figure 2). To achieve the 0.01 relative uncertainty due to counting statistics, the net count of the γ-peak, n, reached a constant value (close to 104) in every count. Hence, the effect of a possible and undisclosed departure of the γ-peak from the Gaussian shape is considered constant during the sequence. In addition, the upper limit for the background contamination fraction of the fitted γ-peak area is fixed at 10% of the maximum background to the net count ratio, α, occurred during the experiments, i.e. 0.0035. The 30% variation of α usually observed between the start and end of a sequence leads to an average relative uncertainty,  , i.e. at t = 0 and t = 400 min, of about 0.000 53.
In agreement with [2], a propagation factor 2/λT is assumed for the u(A)/A due to (i) variations or drift of the detection efficiency system, (ii) pile-up correction and (iii) background contamination. The corresponding relative uncertainties, u(λ)/λ, are 0.000 34, 0.000 18 and 0.000 60, respectively; these values and the corresponding contributions to the combined uncertainty are listed in table 1.
Table 1. Uncertainty budget for the measurement of the 31Si decay constant. The resulting combined relative uncertainty, uc(λ)/λ, is also given.
| Uncertainty component | ui(λ)/λ | Index (%) |
|---|---|---|
| Counting statistics | 0.001 04 | 68 |
| Instability of the detection system | 0.000 34 | 8 |
| Pile-up and dead time | 0.000 18 | 2 |
| Background signals | 0.000 60 | 22 |
| uc(λ)/λ | 0.001 26 | 100 |
In summary, an overall relative uncertainty of 0.0013 is evaluated for λ. The main contributors are counting statistics, 68%, and background contamination, 22%.
4.4. Comparison with literature data
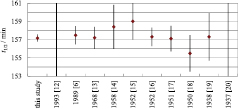
The presently adopted 31Si half-life value, 157.36(26) min [5], is the weighted average of ten selected values reported in high quality peer-reviewed journals: 163.0(58) min [12], 157.5(5) min [6], 157.2(6) min [13], 158.4(12) min [14], 159(1) min [15], 157.3(5) min [16], 157.1(7) min [17], 155.5(10) min [18], 157.3(13) min [19] and 170(10) min [20]. These values are shown in figure 6 and compared with the result obtained in this study, i.e. 157.16(20) min.
Figure 6. The literature 31Si half-life values compared with the result obtained in this study. The reference and the publication year are reported. The error bars indicate a 95% confidence interval.
Download figure:
Standard image High-resolution image
5. Conclusions
The 31Si half-life was determined with repeated measurements of the activity of a 31Si source activated using neutron irradiation. The value was determined by applying the linear least squares regression of data collected in several decay observations. The possible effects that might affect the result such as instability of the detection system, pile-up, dead-time and background have been limited and, whenever possible, corrected for. The relevant uncertainties were evaluated and propagated following the suggestions reported in [2].
The resulting 31Si half-life value reached a relative uncertainty of 0.13% and is in agreement with the presently recommended value, given with a 0.16% relative uncertainty, obtained as the weighted average of ten data previously acquired and published with poor information concerning details of experiments and uncertainty budgets.
Acknowledgments
This work was jointly funded by the Italian ministry of education, university, and research (awarded project P6-2013, implementation of the new SI) and by the European Metrology Research Programme (EMRP) participating countries within the European Association of National Metrology Institutes (EURAMET) and the European Union.