
Abstract
Monte Carlo simulations play a crucial role for in-vivo treatment monitoring based on PET and prompt gamma imaging in proton and carbon-ion therapies. The accuracy of the nuclear fragmentation models implemented in these codes might affect the quality of the treatment verification. In this paper, we investigate the nuclear models implemented in GATE/Geant4 and FLUKA by comparing the angular and energy distributions of secondary particles exiting a homogeneous target of PMMA. Comparison results were restricted to fragmentation of 16O and 12C. Despite the very simple target and set-up, substantial discrepancies were observed between the two codes. For instance, the number of high energy (>1 MeV) prompt gammas exiting the target was about twice as large with GATE/Geant4 than with FLUKA both for proton and carbon ion beams. Such differences were not observed for the predicted annihilation photon production yields, for which ratios of 1.09 and 1.20 were obtained between GATE and FLUKA for the proton beam and the carbon ion beam, respectively. For neutrons and protons, discrepancies from 14% (exiting protons–carbon ion beam) to 57% (exiting neutrons–proton beam) have been identified in production yields as well as in the energy spectra for neutrons.
Export citation and abstract BibTeX RIS
General scientific summary Monte Carlo simulations play a crucial role for in-vivo treatment monitoring based on PET and prompt gamma imaging in hadrontherapy. The accuracy of the nuclear fragmentation models implemented in these codes might affect the quality of the treatment verification. In this paper, we investigate the nuclear models implemented in GATE/Geant4 and FLUKA by comparing the angular and energy distributions of secondary particles exiting a homogeneous target. Despite the simple set-up, discrepancies were observed between the two codes. The number of high energy (>1 MeV) prompt gammas exiting the target was about twice larger with GATE than with FLUKA both for proton and carbon ion beams. Such differences were not observed for the predicted annihilation photon production yields, for which ratios of 1.09 and 1.20 were obtained between GATE and FLUKA for proton and carbon ion beams. For neutrons and protons, discrepancies from 14% to 57% have been identified in production yields.
For more information on this article, see medicalphysicsweb.org
1. Introduction
Monte Carlo (MC) particle transport methods are increasingly used in medical physics, in particular for the development of innovative techniques for proton and carbon ion therapies. Popular MC packages in this field are Geant4 (Agostinelli et al 2003), on which the GATE package (Jan et al 2011) is based, FLUKA (Ferrari et al 2005, Battistoni et al 2007), PHITS (Nose et al 2005) or MCNPX (LANL 2008). These codes are increasingly employed to validate the analytical simulation tools used to calculate treatment plans (Paganetti et al 2004, Newhauser et al 2007, Parodi et al 2012, Grevillot et al 2012). For such applications, the accuracy of the code is of foremost importance as it might ultimately impact the quality of the treatment plan. MC simulations have also proved to be helpful for in-vivo treatment verification based on positron emission tomography (PET) (Parodi et al 2002, 2005, Pshenichnov et al 2006, Knopf et al 2008). Indeed, inaccuracies in the positioning of the patient or anatomical modifications can be detected using PET acquisitions of the annihilation photons resulting from the nuclear reactions undergone by incident ions (Parodi et al 2007b). The method consists in comparing the spatial distribution of the annihilation photons predicted by MC simulations based on the treatment plan with the actual PET image. The analysis of any mismatch between the MC simulated image and the PET image makes it possible to detect errors in dose delivery due to patient mispositioning, organ motion or organ deformation. This dose-delivery verification strategy, however, relies heavily on the accuracy of the nuclear fragmentation models implemented in the codes for the specific products used for monitoring.
The GEANT4 code was originally developed for applications in high energy physics. In that energy range, some experimental validations of the hadronic physics integrated in the code have been reported (Geant4-Website 2012a). Conversely, the FLUKA code has been developed and successfully applied both in the high and the low energy ranges. Extensive validations of the hadronic physics against thin target experimental data have been published (Ferrari and Sala 1998, 2002, Battistoni et al 2007, Rinaldi et al 2011). In the framework of dose calculations in hadrontherapy, the aforementioned codes were also compared with experimental data. For protons, Grévillot et al (2010), Koch et al (2008) and Parodi et al (2007a) showed a good agreement between simulated and experimental depth dose profiles with differences in range smaller than 1 mm. However, some disagreements were observed in the distal fall-off regions with maximum discrepancies of 5% observed between the distal dose predicted by FLUKA and experimental results (Parodi et al 2007a). When comparing lateral dose profiles obtained with Geant4 to experimental data, discrepancies up to 20% in the beam widening (FWHM) were observed (Grevillot et al 2010). These discrepancies highlighted the need for improving the multi-scattering models of Geant4 (Grévillot et al 2010). For carbon ions, available data are scarce (Pshenichnov et al 2006, Sommerer et al 2006, Lechner et al 2010). Comparisons between simulated and experimental data are however promising and suggest that current Geant4 and FLUKA codes correctly reproduce the fragmentation tails beyond the Bragg peak (Sommerer et al 2006, Böhlen et al 2010, Lechner et al 2010, Mairani et al 2010). Regarding the lateral beam widening, a good accuracy of FLUKA simulations has been reported in Mairani et al (2010).
The accuracy of the internal nuclear models plays an even more important role in the framework of nuclear imaging for hadrontherapy monitoring. However, experimental data regarding the production of secondary particles are scarce in this context (Parodi et al 2002, Gunzert-Marx et al 2004, 2008, Haettner et al 2006, Polf et al 2009, Testa et al 2009).
Regarding β+ production, comparison of FLUKA simulations based on previous versions of the MC internal models to experimental data in proton therapy or carbon ion therapy can be found in Parodi et al (2002, 2005), Sommerer (2007) and Sommerer et al (2009). Much improved results for protons can be obtained with the present FLUKA models, as demonstrated in this study. The carbon results also profit from the many developments in the Boltzmann master equation (BME) model implemented since Sommerer (2007). Similar studies were carried out in Pshenichnov et al (2006) using the Geant4 software. In Parodi et al (2002), (2005) and Espana et al (2011), a method consisting in convolving the energetic proton fluence with experimental cross-sections was used instead of entirely relying on the MC internal model of nuclear fragmentation. This method, which gives encouraging results in the protontherapy context, can however, not be used in carbon ion therapy today, because of the lack of appropriate experimental cross-section values. Recently, Seravalli et al (2012) compared the β+ emitter productions in depth of three MC codes (GATE/Geant4, MCNPX and PHITS) in homogeneous media in proton therapy. The study shows that for protons the internal models of these three MC codes do not accurately reproduce the spatial distribution of the main β+ emitters (11C, 150).
In the last six years, methods of range verification based on imaging of prompt gammas exiting from the patient have been explored (Min et al 2006, Polf et al 2009, Testa et al 2009, Moteabbed et al 2011, Bom et al 2012). Collimated gamma camera (Polf et al 2009, Testa et al 2009, Bom et al 2012, Smeets et al 2012) as well as Compton camera prototypes (Frandes et al 2010, Richard et al 2011, Kim et al 2012) have been developed or are under construction. Compared to PET imaging, prompt gamma imaging is characterized by higher numbers of emissions (Moteabbed et al 2011). Comparisons between experimental data and Geant4 simulations have been performed. They showed that the simulated spectra contained all the characteristic emission lines presented in the measured spectra with proton beams. For carbon ions, initial results reported a 12 times overestimation of the prompt gamma yields (deposited energy higher than 2 MeV, 90° angle with respect to the beam direction, 1.5 ns time-of-flight window) for Geant4 9.1 simulations (Le Foulher et al 2010). Results obtained with the Geant4 9.4 version (ENVISION deliverable 2012) are in better agreement with experimental data since the prompt gamma yield is overestimated by a factor of 2. On the other hand, simulations of the same data with FLUKA have steadily provided an overall agreement within 10–15% (Böhlen et al 2013).
Comprehensive experimental data regarding the production of secondary particles are missing in ion-beam therapy. When experimental data are lacking, a useful insight into the consistency of MC models can be obtained by comparing the prediction of different models implemented in the codes. In this work, we studied the consistency of depth dose profiles and secondary particle productions as predicted by two MC simulation codes used in the context of hadrontherapy, namely FLUKA and GATE/Geant4. Angular and energy distributions of particles resulting from nuclear interactions of primary protons and carbon ions in a homogeneous PMMA (PolyMethyl MethAcrylate) target were compared. The objective was twofold. First, it aimed at identifying potential inconsistencies in the results provided by the two codes to determine the models and model components requiring specific attention and additional validation for a sound use of MC simulations in the context of range verification. Differences smaller than 1% of the incident particle range are desirable for dosimetry applications. For imaging purposes, differences up to 20–30% will be acceptable for prototype dimensioning. A better agreement (differences smaller than 10%) will be necessary for a clinical imaging-based dose monitoring. As a second objective, this study describes a simple set-up with associated results that could be further referred to for validation of new versions of these two codes or for analysis of the results provided by other codes. This paper is organized as follows. Section 2.1 gives details on the simulation parameters used for each MC code. Sections 2.2, 2.3 and 2.4 describe, respectively, the common set-up, the scored quantities and the studied observables. Results are given in section 3 and then discussed in section 4.
2. Material and methods
Two MC codes, GATE/Geant4 and FLUKA, were employed in this work. Specific details of these codes are described in section 2.1 Special attention was paid on setting identical simulation parameters in the two codes, such as particle transport thresholds and production cuts. The simulated geometries are described in section 2.2 and the scored quantities as well as the observables of interest in our study are presented in sections 2.3 and 2.4.
2.1. GATE and FLUKA MC simulation codes
2.1.1. GATE
GATE version 6 (GATE-Website 2012) is an opensource MC simulation application enabling the modeling of emission tomography, transmission tomography and radiation therapy. GATE is based on the Geant4 toolbox (Geant4-Website 2012b). In this work, GATE version 6.1, based on Geant4 version 9.4, was used. As recommended by the Geant4 Electromagnetic Standard working group, the Opt3 electromagnetic standard package parameters were selected. A fine sampling of the stopping power and cross-section tables (20 bins/decade) was used for improved accuracy. In Geant4, production thresholds expressed in range can be tuned to optimize the computation times. Default values (1 mm) were used for all particles except for electrons for which the production thresholds were set to 12.7 cm and 0.114 mm in air and PMMA respectively. These values were consistent with the δ-ray production threshold (100 keV) which was adopted in the FLUKA simulations. Table 1 describes the hadronic physics list used in the GATE/Geant4 simulations.
Table 1. Hadronic models used in the GATE/Geant4 simulations. The 'generic ions' correspond to ions heavier than alpha particles.
| Hadronic process | Particles | Geant4 processes | Geant4 models | Geant4 datasets | Energy range |
|---|---|---|---|---|---|
| Elastic scattering | All particles except | G4HadronElastic | G4HadronElastic | G4HadronElastic | 0–500 GeV |
| low energy neutrons | Process | DataSet | |||
| Elastic scattering | Low energy neutrons | G4HadronElastic | G4NeutronHPElastic | G4NeutronHPElastic | 0–20 MeV |
| Process | Data | ||||
| Inelastic process | Protons | G4ProtonInelastic | G4BinaryCascade | G4ProtonInelastic | 0–500 GeV |
| for protons | Process | Cross Section | |||
| Inelastic process | GenericIon, Deuteron, | G4IonInelastic | G4QMDReaction | G4IonsShen | 0–500 GeV |
| for ions | Triton, 3He, Alpha | Process | Cross Section | ||
| Inelastic scattering | Neutron | G4NeutronInelastic | G4NeutronHPInelastic | G4NeutronHP | 0–20 MeV |
| for neutrons | Process | InelasticData | |||
| G4BinaryCascade | G4NeutronInelastic | 14 MeV–500 GeV | |||
| Cross Section |
The binary cascade (BiC) model (Pshenichnov et al 2006, Seravalli et al 2012) was applied to protons and neutrons except at low energies where the high precision G4NeutronHP package was used for neutrons. The BiC model was employed without internal calls to the precompound model (so-called 'modified BiC' hereafter) for all particles (Seravalli et al 2012). The quantum molecular dynamics (QMD) model recommended by Böhlen et al (2010) was activated for all ions (ions heavier than alpha particles, so-called 'generic ions', deuterons, tritons, 3He and alpha). To describe elastic interactions, the HadronElastic process was used for all particles. The G4HadronElastic model was applied for all particles except for low energy neutrons for which the G4NeutronHPElastic model was preferred.
2.1.2. FLUKA
FLUKA (FLUKA-Website 2012) is a general purpose MC package for calculations of particle transport and interactions with matter, widely used for an extended range of applications including activation studies, dosimetry, and particle therapy (Ferrari et al 2005, Battistoni et al 2007, Battistoni et al 2008). In this work, the FLUKA 2012 development version, applying the default settings for hadron therapy ('HADROTHE'), was used. This version of FLUKA contains a few physics improvements with respect to the presently distributed public version. For the sake of this paper, the only differences are some refinements in prompt gamma generation (Böhlen et al 2013), whose impact is small for the distributions presented here, and a new treatment (Cerutti et al 2012, Böhlen et al 2013) of (p,d) and (n,d) reactions which improves significantly the agreement with experimental data for 12C(p,x)11C and 16O(p,x)15O excitation functions. These developments will be included in the new release of the code which will likely occur toward the end of 2013. In FLUKA, the choice of the pre-selected defaults (e.g. HADROTHE, PRECISIO, etc) does not impact the physics description which is unique and cannot be changed. The HADROTHE default was chosen here since it does not have uselessly low default transport thresholds, which would be very CPU demanding, but disposes, on the other hand, of a fine dE/dx mesh which facilitates accurate range predictions. Between 125 MeV and 5 GeV per nucleon, nucleus–nucleus interactions were treated with an extensively modified version (Andersen et al 2004) of the rQMD-2.4 (relativistic QMD) model (Sorge et al 1989), while the BME model was employed for an appropriate handling of interactions below an energy of 125 MeV per nucleon down to the Coulomb barrier (Cerutti et al 2006). Inelastic hadron–nucleus interactions were described by the PEANUT (pre-equilibrium-approach-to-nuclear-thermalization) model (Ferrari and Sala 1998, Ferrari and Sala 2002). Using hadron therapy default settings, the particle transport threshold for all hadrons was set to 1 keV, except for neutrons which were transported down to thermal energies.
2.2. Simulation set-ups
A simple geometry involving a homogeneous phantom was used to compare the two codes with a limited number of confounding factors.
For the proton therapy case, a perfect line beam (no angular spread) of 107 protons irradiating a 10 × 10 × 60 cm3 PMMA (ρ = 1.19 g cm–3, C5H8O2) target placed in air was simulated (figure 1). In all simulations, the ionization potential value of the PMMA was fixed to I = 74 eV. The monoenergetic protons (134 MeV) were produced by a point source located 20 cm upstream from the entrance of the target and hit the target at the center of the entrance side.
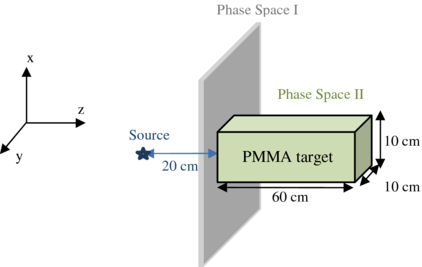
Figure 1. Set-up scheme.
Download figure:
Standard imageExactly the same set-up (figure 1) was simulated for a monoenergetic 260 AMeV carbon beam using 106 primary ions.
2.3. Phase space files
To compare particle properties at different levels in the simulations, phase spaces, that contain the essential properties of the simulated particles at a given geometric level, were used. The features of interest of all particles entering the target were stored in a ROOT (ROOT-Website 2012) file (corresponding to phase space I, figure 1) in a dedicated TTree. This 'Incoming' TTree included ten variables: the event ID, the PDG (Particle Data Group, PDG-Website 2012) id number of the particle, the atomic and mass numbers of the particle, the (x, y, z) particle coordinates and the (px, py, pz) particle momentum at the entrance of the target. Another TTree was used to store 15 features of interest of particles exiting from the target (phase space II—figure 1), namely all the variables included in the 'Incoming' TTree, the coordinates at which the particle was produced within the target as well as two temporal particle coordinates. The two temporal characteristics included the time of production of the secondary particle in the target (t_prod) and the time at which the secondary particle exited from the target (t_out).
2.4. Observables
2.4.1. Depth dose curves
The deposited dose was integrated in the xy plane. Depth dose curves computed along the main axis of the target, coinciding with the beam direction (z axis), were plotted with a 0.5 mm binning. Range estimations were conventionally calculated as the position of the 80% level of the distal fall-off.
2.4.2. Yields of particles exiting from the target
Using the PDG value, the number of particles exiting from the target (Nj) was integrated over the surface of the target for each particle type j (gammas, neutrons, protons, ions). Yields per primary were obtained by dividing Nj by the number of incident particles (protons or carbon ions).
2.4.3. Energy distributions of secondary particles
dNj/dE energy distributions were plotted for outgoing prompt gammas (t_prod <10 ns) and protons using the particle momentum information. In the previous expression, dNj is the number of particles of type j exiting from the target with an energy between E and E + dE. Depending on the considered secondary particles, either a 0.1 MeV (gammas) or a 1 MeV (proton) energy binning was used. For neutrons, 'lethargy' plots (equation (1)) were plotted to carefully analyze the low energy component. An energy-dependent binning (from 1.5 10−13 GeV at 1 10−13 GeV energy to 0.02 GeV at 0.13 GeV energy) was used.

2.4.4. Angular and energy double-differential plots of the secondary particles
By analyzing the particle momentum at the exit of the target, double-differential plots in angle and energy were drawn for secondary gammas, neutrons and protons. The polar angle θ (figure 2, equation (2)) was calculated for each outgoing particle. In equation (2), pxout, pyout and pzout correspond to the momentum components of the secondary particle at the exit of the target in the (O, x, y, z) referential.


Figure 2. Polar angle determination.
Download figure:
Standard image2.4.5. Production depth of secondary particles
The distributions of sites of β+ annihilations were calculated with the two MC codes. This allowed us to compare the performance of the hadronic models in the context of range monitoring using PET imaging. A time window (τ > 1 ms), applied to the production time (t_prod), was used to differentiate annihilation photons from prompt gammas. A similar study was performed for prompt gamma emission. In this case, only gammas that produced less than 10 ns after the end of the irradiation were selected. This 10 ns value was estimated by adding the transit time of incident particles from the source to the target to the order of magnitude of experimentally evaluated time-of-flight values (Le Foulher et al 2010). An energy threshold (E > 1 MeV) was additionally applied to keep only useful prompt gammas. Indeed, studies on prompt gamma detection for hadrontherapy monitoring have shown that an energy threshold of 1 MeV or more was necessary to get rid of most of the neutron-induced background (Min et al 2006, Testa et al 2009, Smeets et al 2012).
2.4.6. Time distribution of prompt gamma production
The time distribution of prompt gamma production (t_prod) was plotted for the two codes. As for the production depth analysis, only gammas characterized by t_prod < 10 ns and E > 1 MeV were selected. Curves were normalized to the same area to compare the shapes more easily.
3. Results
3.1. Depth dose curves
Figure 3 shows the normalized depth dose curves in PMMA (I = 74 eV) obtained with GATE/Geant4 and FLUKA for the proton beam (134 MeV) (a) and for the carbon ion beam (260 AMeV) (b). Statistical errors were too small (<0.5% from 0 to 115 mm depths for protons and <0.3% from 0 to 170 mm depths for carbon ions) to be plotted in figure 3. The point-to-point relative dose discrepancies between the two codes, i.e. the differences in normalized dose observed between the two codes at a certain depth, were superimposed. Using figure 3, range values of 111.69 and 116.09 mm for GATE and 111.40 and 116.55 mm for FLUKA were obtained for protons and carbon ions respectively.

Figure 3. Depth dose curves in PMMA (I = 74 eV) obtained using GATE/Geant4 and FLUKA for monoenergetic (a) protons (134 MeV) and (b) carbon ions (260 AMeV). Point-to-point relative dose discrepancies between the two codes are superimposed.
Download figure:
Standard image3.2. Yields of secondary particles exiting the target
Tables 2 and 3 show the yields of secondary particles exiting from the target obtained with the two codes for the proton and carbon ion beams. For photons, only gammas useful for dose monitoring based on prompt gamma imaging (E > 1 MeV) were analyzed.
Table 2. Yields of outgoing particles per primary particle obtained using GATE/Geant4 and FLUKA codes for a 134 MeV proton beam irradiating a homogeneous PMMA target.
| GATE/Geant4 | FLUKA | Ratio | |
|---|---|---|---|
| Gammas | 0.094 496 ± 0.000 097 | 0.049 312 ± 0.000 070 | 1.92 |
| (>1 MeV) | |||
| Neutrons | 0.087 136 ± 0.000 093 | 0.055 540 ± 0.000 074 | 1.57 |
| Protons | 0.001 292 ± 0.000 011 | 0.001 039 ± 0.000 010 | 1.24 |
Table 3. Yields of outgoing particles per primary particle obtained using GATE/Geant4 and FLUKA codes for a 260 AMeV carbon ion beam irradiating a homogeneous PMMA target.
| GATE/Geant4 | FLUKA | Ratio | |
|---|---|---|---|
| Gammas | 0.916 02 ± 0.000 96 | 0.442 28 ± 0.000 66 | 2.07 |
| (>1 MeV) | |||
| Neutrons | 2.9262 ± 0.0017 | 2.4884 ± 0.0016 | 1.17 |
| Protons | 0.401 70 ± 0.000 63 | 0.350 77 ± 0.000 59 | 1.14 |
| Ions | 0.059 52 ± 0.000 24 | 0.066 15 ± 0.000 26 | 0.89 |
3.3. Energy distribution of secondary particles
Energy distributions corresponding to all outgoing gammas (neither energy nor time selection) are shown in figure 4. As observed in section 3.2, GATE/Geant4 over-estimates production yields of gammas as obtained with FLUKA regardless of the energy. Differences in photon yields between GATE/Geant4 and FLUKA as large as 6.7 and 7.4 were obtained at some energies, for proton and carbon ion beams, respectively. For annihilation photons (t_prod > 1 ms), the ratio between the number of gammas produced by GATE to the number of gammas produced by FLUKA is equal to 1.09 and 1.20 for the proton beam and the carbon ion beam, respectively.
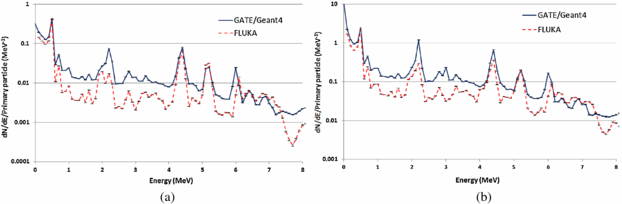
Figure 4. Outgoing gamma energy distributions per primary particle obtained with GATE/Geant4 and FLUKA for monoenergetic (a) protons (134 MeV) and (b) carbon ions (260 AMeV) irradiating a PMMA target. Neither energy nor time selection were used.
Download figure:
Standard imageThe energy distributions of outgoing protons obtained with GATE/Geant4 and FLUKA are shown in figure 5 for the proton beam and the carbon ion beam. Despite the fact that the shapes of the distributions are similar for the two codes, slight discrepancies in magnitude are observed for proton (figure 5(a)) as well as for carbon ion beams (figure 5(b)). For both incident beams, GATE/Geant4 predicts a somewhat higher number of secondary protons over most of the energy range.

Figure 5. Outgoing proton energy distributions per primary particle obtained with GATE/Geant4 and FLUKA for monoenergetic (a) protons (134 MeV) and (b) carbon ions (260 AMeV) irradiating a PMMA target.
Download figure:
Standard imageFigure 6 shows lethargy plots corresponding to outgoing neutrons obtained with GATE/Geant4 and FLUKA for the proton and the carbon ion beams. For both beams, GATE/Geant4 overestimated the leakage of neutrons with energies from 1 eV to 100 MeV compared to FLUKA. An average overestimation of 1.5 was calculated for this energy range. Large discrepancies were also observed for energies lower than 1 eV: for these energies, FLUKA predicted about 3.5 times larger neutron leakage than GATE/Geant4. For carbon ions, a good agreement was observed from 30 to 300 MeV with maximum relative differences of 15% (figure 6(b)).

Figure 6. Lethargy plots corresponding to outgoing neutrons obtained using GATE/Geant4 and FLUKA for monoenergetic (a) protons (134 MeV) and (b) carbon ions (260 AMeV) irradiating a PMMA target.
Download figure:
Standard image3.4. Angular and energy double-differential plots of secondary particles
Figures 7 and 8 show the angular and energy double-differential plots obtained with GATE/Geant4 and FLUKA for the proton beam and the carbon ion beam. Plots corresponding to three types of particles (neutrons, gammas and protons) are displayed. For gammas, neither energy nor time selection were used.

Figure 7. Angular and energy double-differential plots of outgoing neutrons, gammas and protons (MeV−1 sr−1) produced by the irradiation of a PMMA target by monoenergetic (134 MeV) protons, as predicted by GATE/Geant4 and FLUKA. For gammas, neither energy nor time selection were used.
Download figure:
Standard image
Figure 8. Angular and energy double-differential plots of outgoing neutrons, gammas and protons (MeV−1 sr−1) produced by the irradiation of a PMMA target by monoenergetic (260 AMeV) carbon ions, as predicted by GATE/Geant4 and FLUKA. For gammas, neither energy nor time selection were used.
Download figure:
Standard image3.5. Production depth of secondary particles
Figure 9 compares the location of production of the outgoing annihilation photons (t_prod > 1 ms, no energy discrimination) along depth generated by the GATE/Geant4 and FLUKA simulations. For the proton beam (figure 9(a)), the most important difference concerns the distal fall-off region. The slope of this region, that is steeper in the GATE/Geant4 simulations, leads to a significant discrepancy in the determination of the fall-off position (defined as the depth at 80% of the maximum): 105.20 mm for GATE against 103.54 mm in the FLUKA simulations. This 1.66 mm difference is quite significant compared with the 0.29 mm difference observed in the proton ranges (figure 3(a)). For the carbon ion beam, global shapes are fairly similar between the two codes except at the end of the range of the carbon ions (figure 9(b)). Differences in the amplitudes of the production peaks (ratio of 1.22) as well as in the fragmentation tails are observed. 114.87 mm and 116.70 mm fall-off positions were determined from figure 9(b). This 1.83 mm difference between the two codes is higher than the 0.46 mm difference already observed comparing the carbon ion ranges (figure 3(b)).
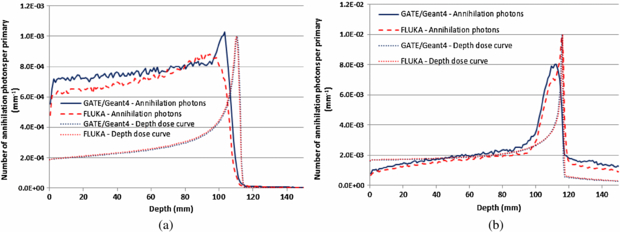
Figure 9. Comparison of the location of production of the annihilation photons (t_prod > 1 ms, no energy discrimination) exiting from the target obtained using GATE/Geant4 and FLUKA for (a) the proton beam (134 MeV) (b) the carbon ion (260 AMeV) beam.
Download figure:
Standard imageFigure 10 compares the location of production of the outgoing prompt gammas (t_prod < 10 ns, E > 1 MeV).

Figure 10. Comparison of the location of production of the prompt gammas exiting from the target obtained using GATE/Geant4 and FLUKA for (a) the proton beam (134 MeV) (b) the carbon ion (260 AMeV) beam.
Download figure:
Standard imageFor protons (figure 10(a)), in addition to the production yield discrepancy, a difference is observed in the determination of the fall-off position (defined as the depth at 80% of the maximum): 108.40 mm for GATE/Geant4 against 109.68 mm in the FLUKA simulations. This 1.2% difference is mainly due to the shape of the distal fall-off that is sharper in the FLUKA simulations. For carbon ions (figure 10(b)), values of 115.94 mm and 116.49 mm are obtained for GATE/Geant4 and FLUKA respectively. This 0.55 mm difference (0.5%) between the two codes is negligible given the 0.46 mm difference already observed when comparing the carbon ion ranges (figure 3(b)).
3.6. Prompt gamma time distribution
Comparisons of the times of production of the prompt gammas predicted by the two codes are shown in figure 11 for the proton beam and for the carbon ion beam, where curves were normalized to the same area. The t = 0 value corresponds to the time at which incident particles (protons or carbon ions) are produced. For the proton beam (figure 11(a)), a good agreement in shape is observed between the two codes except for the last part (2.1 < t_prod < 2.4 ns). On the contrary, discrepancies are observed for t_prod < 1.8 ns for the carbon ion beam (figure 11(b)).
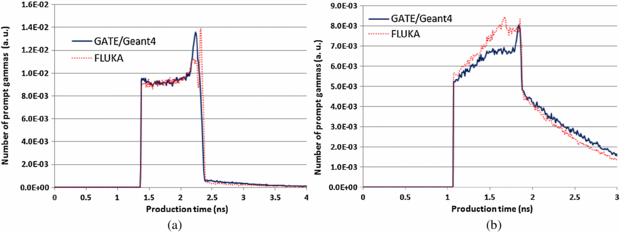
Figure 11. Time distributions of prompt gamma productions obtained using GATE/Geant4 and FLUKA for (a) the proton (134 MeV) beam, (b) the carbon ion (260 AMeV) beam.
Download figure:
Standard image4. Discussion
As already demonstrated by recent studies (Seravalli et al 2012), a good agreement between GATE/Geant4 and FLUKA was obtained for depth dose deposit. The differences in range were respectively equal to 0.29 mm (0.3% of the range) and 0.46 mm (0.4% of the range) for protons (134 MeV) and carbon ions (260 AMeV) irradiating a PMMA target (figure 3). These differences, lower than 1% of the range, fulfill the dose precision requirement. Point-to-point relative dose discrepancies between the two codes (figure 3) confirm this good agreement: mean discrepancies of 2.3% and 0.8% were observed in front of the Bragg peak for protons and carbon ions respectively. These results, combined with the comparison of each code to experimental data (Parodi et al 2007b, Koch et al 2008, Grévillot et al 2010), validates the modeling of the dose deposit in the beam direction for the two codes.
Despite the very simple target and set-up, discrepancies were observed between the codes when comparing the spatial and time distributions of secondary particles exiting the PMMA target. In the next paragraphs, results are analyzed for each observable and each particle type. Comparisons to experimental data are also discussed to facilitate the interpretation of the simulated results.
Regarding outgoing high energy (>1 MeV) gamma yields, ratios of 1.92 and 2.07 were obtained between GATE/Geant4 and FLUKA for proton and carbon ion beams, respectively (tables 2 and 3). Comparing Geant4 9.1 simulations to experimental data, (Le Foulher et al 2010) showed that Geant4 simulations overestimated prompt-gamma ray detection yields by a factor of 12. These results, obtained with an old version of Geant4, included only the prompt gammas emitted with a 90° angle with respect to the beam direction and depositing energies higher than 2 MeV. Though they cannot be compared directly to our results, they show that an improvement of Geant4 hadronic models is needed. For that purpose, work on the dynamic part describing ion–ion collisions and mainly the QMD model is in progress. The de-excitation stage (statistical part) was also recently improved by the Geant4 developers by including the Fermi break-up as a default option (Geant4-Website 2012c). These improvements lead to an overestimation of the detected prompt-gamma yield by a factor of 2 today (ENVISION deliverable 2012). The experimental prompt gamma yield can however be accurately reproduced with Geant4 by tuning the tolerance factor of the photon evaporation model (Lestand et al 2012). FLUKA reproduced the above measurements (Le Foulher et al 2010) within 10–15% (Böhlen et al 2013). A more detailed comparison of FLUKA with experimental prompt gamma yields will be presented separately in an upcoming paper.
In figure 4, the comparison of outgoing gamma energy distributions shows that the prompt gamma yield predicted by GATE/Geant4 exceeds that predicted by FLUKA for the entire energy spectrum (0–8 MeV), except for the energy region where the contribution from annihilation photons dominates. The agreement between the two codes observed in the 501–521 keV range (differences within 6% for t_prod > 1 ms) is important when using simulations for assisting the development of β+ imaging systems. Indeed, prototyping such new systems often requires an accurate estimate of the gamma annihilation yields in order to adjust the efficiency of the system.
Figure 9 compares the positions of production of the annihilation photons. It confirms the fairly good agreement between the two codes. It however also shows some discrepancies higher than 1 millimeter in the range determination. These differences in the distal fall-off might have a significant impact on the determination of the range of the incident particles based on PET imaging. Previous works (Parodi et al 2002, 2005, Espana et al 2011, Seravalli et al 2012) resorted to a convolution of simulated particle fluences with experimental cross-section data in order to overcome possible deficiencies in the code internal models. Figure 12 depicts the depth of production of the β+ emitters (11C, 15O) due to the reactions (12C(p,x)11C, 16O(p,x)15O) obtained by combining the fluence of the protons in the PMMA target (GATE/Geant4 and FLUKA simulations) with experimental cross-sections (Parodi et al 2002, EXFOR-Website 2012), compared to the positions of production of the annihilation photons (figure 9(a)) and β+ emitters (11C, 15O) obtained using GATE/Geant4 and FLUKA internal models. As in all the study, 134 MeV monoenergetic protons were considered. A multiplication by a factor of 2 was applied to the β+ emitter curve in order to mimic the production of two annihilation photons per β+ disintegration. The lower and upper boundary curves for the experimental cross-sections were derived from the EXFOR database (EXFOR-Website 2012), while the central fit has been taken from (Parodi et al 2002). The simulated depths of production of the β+ emitters obtained using the proton fluences computed with GATE/Geant4 or FLUKA folded with the central fit were already validated against experimental data (Parodi et al 2002, Seravalli et al 2012). The difference between the FLUKA and GATE/Geant4 internal models was quite important. Results simulated with FLUKA internal models better reproduced the shape and magnitude of the curves based on experimental cross-sections. The Geant4 BiC model has therefore to be improved in order to suppress the 11C production peak at the end of the proton range. It is also well visible that the convolution method, if limited to these two reactions, underestimates the total production of β+ emitters, since it does not account for all the possible reaction channels leading to β+ emitter production. The comparison of the experimental back-projected activity distributions of annihilation photons produced by carbon ion beams in PMMA with simulated results obtained with an older version of FLUKA can be found in Sommerer (2007) and Sommerer et al (2009). In the results presented here, an improved version of the BME model (Cerutti et al 2012) has been used.

Figure 12. Depths of production of the β+ emitters (11C, 15O) obtained combining the fluence of the protons in the PMMA target (GATE/Geant4 and FLUKA) to experimental cross-sections compared to the depths of production of the annihilation photons and depths of production of the β+ emitters (11C, 15O) obtained using the internal models of GATE/Geant4 and FLUKA.
Download figure:
Standard imageGATE/Geant4 strongly overestimated the outgoing neutron production yield predicted by FLUKA in proton therapy (+57%) (table 2). A lower difference was observed for carbon ions with a 17% greater yield with GATE/Geant4 compared to FLUKA (table 3). Experimental data exist about neutron production generated by proton or carbon ion beams on both thin and thick targets (Kurosawa et al 1999, Gunzert-Marx et al 2008, Braunn et al 2009, Bedogni et al 2012, Iwamoto et al 2012). Gunzert-Marx et al (2008) give experimental values considering a 200 AMeV carbon ion beam irradiating a 12.78 cm thick water target. In this study, a 0.54±0.11 neutron production yield was obtained in the forward hemisphere. Only neutrons with an energy >20 MeV were considered. The same set-up as the one described in Gunzert-Marx et al (2008) was simulated in GATE/Geant4 and we observed a 0.79 production yield. Results, which overestimated the experimental data by about 46%, are, however, in the same order of magnitude given the large uncertainty affecting the experimental data. Indeed, only four angular distributions from 0° to 30° were measured. The 0.54 fragment yield was obtained by integration of extrapolating exponential functions.
Regarding outgoing neutron energy distributions (figure 6), discrepancies were observed between GATE/Geant4 and FLUKA for proton and carbon ion beams for the entire energy range and more particularly for thermal neutrons with energies lower than 0.5 eV. For these energies, FLUKA predicted about 3.5 times larger neutron leakage than GATE/Geant4. Neutrons produced from nuclear reactions are of much higher energy, hundreds of keV and above. They are subsequently moderated, mostly because of the hydrogen content, down to thermal energies. Given the much smaller discrepancies between the two codes at energies above 100 keV, only a difference between the two codes in neutron transport and moderation might explain this finding. FLUKA has been extensively benchmarked in similar conditions. For example, it has been shown to reproduce accurately the moderation down to thermal energies and eventual detection of neutrons in polyethylene spheres irradiated with calibrated monoenergetic neutron beams (Birattari et al 1998). Figure 13 shows the neutron energy spectra obtained using GATE/Geant4 and FLUKA at 0°, 10°, 20° and 30° angles for the carbon ion beam for neutron energies >20 MeV. At small angles, a broad maximum was observed at about half of the projectile energy per nucleon (130 MeV) for the FLUKA code. This maximum was moved forward higher energies (∼200 MeV) in GATE simulations. At larger angles, no maximum was observed and the neutron emission yield decreased when energies increased. Finally, the maximum neutron energy was about twice the incident particle energy per nucleon in FLUKA simulations but smaller in GATE simulations (∼420 MeV). These observations suggest that FLUKA simulations better reproduce observations related to neutron production compared to GATE/Geant4 (Gunzert-Marx et al 2008).
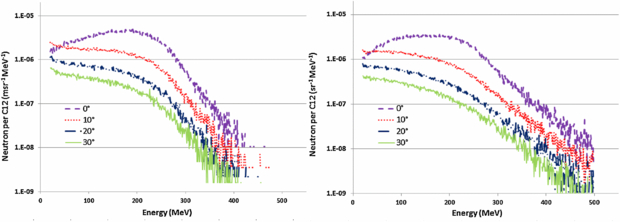
Figure 13. Energy spectra of outgoing neutrons corresponding to 0°, 10°, 20° and 30° angles obtained using GATE/Geant4 (left) and FLUKA (right) for the carbon ion beam (260 AMeV) configuration.
Download figure:
Standard imageIn this study, only secondary neutrons produced inside the PMMA target were considered. In a clinical setting, the treatment nozzle highly contributes to the amount of secondary neutrons, especially in passive scattered proton therapy (Zheng et al 2007). It should thus be simulated for experimental validation of the neutron energy spectra. GATE and FLUKA MC codes were used to evaluate the secondary neutron dose resulting from two different collimators in protontherapy (Moskvin et al 2012, Diffenderfer et al 2012). These two studies, that led to opposite conclusions for the two codes, clearly highlighted the need for comparison studies between MC codes.
Protons exiting from the target are increasingly studied in carbon ion therapy (Henriquet et al 2012). Carbon ions lead indeed to high proton production yields, comparable to the yields of prompt gamma of energies >1 MeV (table 3), and can be detected with intrinsic efficiencies close to 1. They can therefore be a good alternative to annihilation photons and prompt gammas for ion range monitoring in hadrontherapy. In this study, a fairly good agreement was obtained between the two codes regarding the proton yield in carbon ion therapy (ratio equal to 1.14—table 3). As for the outgoing neutron comparison, the experimental set-up proposed by (Gunzert-Marx et al 2008) was simulated in GATE/Geant4. A 0.32 production yield was obtained. This yield overestimated the 0.20±0.03 experimental value obtained in Gunzert-Marx et al (2008). Figure 14 compares the energy spectra of secondary protons obtained with GATE/Geant4 and FLUKA at 0°, 10°, 20° and 30° angles for the carbon ion beam for proton energies larger than 20 MeV. As observed in the experimental study, the shapes of the proton and neutron energy spectra were similar for 10°, 20° and 30° angles. However, contrary to the neutron spectra, the maxima were not observed at about 130 MeV for the 0° angle neither with GATE/Geant4 nor with FLUKA. With FLUKA, the proton spectra extended to about twice the energy per nucleon of the primary ions which is in good agreement with experimental data.

Figure 14. Energy spectra of secondary protons corresponding to 0°, 10°, 20° and 30° angles obtained using GATE (left) and FLUKA (right) for the carbon ion beam (260 AMeV) configuration.
Download figure:
Standard imageFigures 7 and 8 summarize the angular and energy distributions of all particles of interest for the in-vivo treatment verification in hadrontherapy. An overall good agreement in shapes was obtained between the two codes for the two treatment modalities except for forward high energy neutrons in the proton beam configuration. These graphs are of foremost importance for optimizing the positioning of proton imaging systems in carbon ion therapy.
In protontherapy and carbon ion therapy, conventional beams have energies ranging from 70 to 250 MeV and from 50 to 430 AMeV. In this study, only results corresponding to intermediate energies were presented. The same comparison was also carried out for lower energies of 70 MeV (proton beam) and 130 AMeV (carbon ion beam). Results showed that trends observed at intermediate energies could be extended to lower energies for prompt gammas and annihilation photons. For secondary neutrons and protons, conclusions about the comparison of the two codes can be slightly different as a function of the beam energy. For example, a better agreement between the two codes was observed in the production yield (0.98 ratio between GATE/Geant4 and FLUKA for a 70 MeV energy against 1.24 for the 134 MeV beam) as well as in the energy spectra of secondary protons at low energy for the proton beam. On the contrary, discrepancies between GATE/Geant4 and FLUKA increased when comparing neutron production yields predicted by the two codes for the carbon ion beam (1.68 ratio against 1.17 for the 260 AMeV beam).
Different physics lists have been tested during this work for GATE/Geant4 simulations. The physics list proposed in section 2.1.1 provided the best agreement compared to experimental data in the context of dose monitoring based on emission tomography systems in hadrontherapy. Compared to the set of parameters described in Jarlskog and Paganetti (2008), a different inelastic process was used for ions, and the G4HadronElastic process was used instead of the G4UHadronElastic recommended by Jarlskog and Paganetti (2008) for elastic interactions. The use of the G4UHadronElastic process can attenuate the discontinuity observed at 32 MeV in the angular and energy double-differential plot of outgoing neutrons (figure 7) (Jarlskog and Paganetti 2008). It is, however, no longer available in the last version of Geant4 (9.5). For FLUKA, no change of the physics models is possible and the default ones were therefore used for this comparison. The settings described in this paper are strongly recommended to people using GATE/Geant4 or FLUKA, limited to the production/transport cuts in this case, for the prototyping of secondary particle imaging systems. The results reported in this study could also be used for checking that the codes are properly used, for the validation of new versions of the codes and/or for analysis of the results provided by other codes.
5. Conclusion
Energy and angular distributions of secondary emissions of foremost importance for the in-vivo treatment verification in hadrontherapy have been compared for two simulation tools, FLUKA and GATE/Geant4. Set-ups involving monoenergetic protons (134 MeV) and carbon ions (260 AMeV) irradiating a homogeneous PMMA target have been studied.
For proton and carbon ion beams, the codes predict yields of annihilation photons differing by less than 20% while the yields of useful prompt-gamma rays differ significantly (∼100% for proton and carbon ion beams). This first result is promising for the prototyping of new PET imaging systems using MC codes. For neutrons and protons, discrepancies in the production yields have been highlighted especially for the proton beam configuration. For outgoing neutrons, differences in shape in the energy spectra were also observed. The comparison to experimental data seems to argue in favor of the FLUKA results. Additional experimental data are still needed to further evaluate the quality of the nuclear fragmentation models implemented in Geant4 and FLUKA for the production of secondary emissions. A similar study involving a heterogeneous phantom including muscle and lung tissues is currently being carried out, to compare the two MC codes in a more realistic case.
Acknowledgments
This study was performed under the European collaboration ENVISION which focuses on the development of novel imaging modalities for in-vivo dose monitoring and quality assurance of heavy charged particle therapy. It has been supported by the European FP7 project ENVISION (grant agreement no. 241851).