Abstract
During particle therapy irradiation, positron emitters with half-lives ranging from 2 to 20 min are generated from nuclear processes. The half-lives are such that it is possible either to detect the positron signal in the treatment room using an in-beam positron emission tomography (PET) system, right after the irradiation, or to quickly transfer the patient to a close PET/CT scanner. Since the activity distribution is spatially correlated with the dose, it is possible to use PET imaging as an indirect method to assure the quality of the dose delivery. In this work, we present a new dedicated PET system able to operate in-beam. The PET apparatus consists in two 10 cm × 10 cm detector heads. Each detector is composed of four scintillating matrices of 23 × 23 LYSO crystals. The crystal size is 1.9 mm × 1.9 mm × 16 mm. Each scintillation matrix is read out independently with a modularized acquisition system. The distance between the two opposing detector heads was set to 20 cm. The system has very low dead time per detector area and a 3 ns coincidence window, which is capable to sustain high single count rates and to keep the random counts relatively low. This allows a new full-beam monitoring modality that includes data acquisition also while the beam is on. The PET system was tested during the irradiation at the CATANA (INFN, Catania, Italy) cyclotron-based proton therapy facility. Four acquisitions with different doses and dose rates were analysed. In all cases the random to total coincidences ratio was equal or less than 25%. For each measurement we estimated the accuracy and precision of the activity range on a set of voxel lines within an irradiated PMMA phantom. Results show that the inclusion of data acquired during the irradiation, referred to as beam-on data, improves both the precision and accuracy of the range measurement with respect to data acquired only after irradiation. Beam-on data alone are enough to give precisions better than 1 mm when at least 5 Gy are delivered.
Export citation and abstract BibTeX RIS

Content from this work may be used under the terms of the Creative Commons Attribution 3.0 licence. Any further distribution of this work must maintain attribution to the author(s) and the title of the work, journal citation and DOI.
General Scientific Summary PET dose monitoring in particle therapy can be done in the treatment room by using an in-beam system or by quickly moving the patient to a close scanner. The first modality would be preferable, since it would allow shorter acquisition times thus reducing registration errors and biological washout. However, the high radiation noise produced during the irradiation could make in-beam acquisitions impossible until the irradiation is finished or paused as in the inter-spills. This reduces the advantage of in-beam monitoring over full-ring solutions in several clinical contexts. In this work we use a low dead-time acquisition system, able to sustain the high activity rates present during the irradiation. Results show how this new 'full-beam' acquisition modality can improve the precision of conventional in-beam acquisitions, thus reducing or eliminating the acquisition time in the treatment room. For more information on this article, see medicalphysicsweb.org
1. Introduction
Dose range in proton therapy is subject to several sources of uncertainty, including the incompleteness of physical models (Pia et al 2010) and the effects of registration and patient movement (Hui et al 2008). These uncertainties worsen the already limited capabilities in predicting relative biological effectiveness for all tissues, especially those close to the Bragg peak. As a result, the use of beam angles that would place the distal edge close to critical structures is discouraged (Grassberger et al 2011). This partially neutralizes the advantage of charged particles with respect to photons.
One of the main actions that are being taken in order to overcome these problems is to research effective methods for in vivo verification of the beam delivery and, in particular, of the proton range in the patient. Since the sum of range uncertainties typically exceeds 2 mm, except in some cases, such as lung or deep-seated treatments, where it might be bigger (Paganetti 2012), an in vivo range verification tool has to provide both millimetric accuracy and precision in order to effectively contribute to the clinical practice. If effective, an in vivo monitoring would allow better treatment planning by assuring the detection of discrepancies between the planned and the actual delivery close to critical organs. Also, it could support experimental activities for better understanding uncertainties and their sources, thus contributing to increase the reliability of safety margins and eventually to enhance the number and diversity of beam directions.
The most used in vivo range verification method is positron emission tomography (PET) (Enghardt et al 2004, Knopf et al 2009, 2011). PET monitoring is based on the fact that during proton therapy several positron emitters are generated in the irradiated region (Bennett et al 1978, Litzenberg et al 1992). These emitters, e.g., 11C, 13N and 15O, have half-lives that allow to examine the subject during and after the irradiation with a PET scan (Parodi et al 2002). The resulting images can then be used to measure indirectly the delivered dose (Del Guerra et al 1997, Parodi and Enghardt 2000). Another similar method exists, where the detected radiation comes from prompt gamma emission after nuclear excitation by the protons in tissue (Polf et al 2009a, 2009b). Prompt gamma detection has the main advantage of a more direct correlation between the photon signal and the dose range with respect to PET. However, it still suffers from low detector efficiencies, thus leaving PET as the only practical method at this time (Moteabbed et al 2011).
The PET signal results from inelastic nuclear reactions with energy thresholds ranging from 3 to 20 MeV. Therefore the distal activity fall-off is correlated, but not directly matched to the dose distribution. Thus, there is much interest in determining how the β+ activation can be used to estimate the dose distribution (Oelfke et al 1996, Parodi and Bortfeld 2006, Attanasi et al 2008a, Grogg et al 2013, Knopf and Lomax 2013).
The established method is to use a Monte Carlo-simulated distribution of the positron emitters and compare the predicted image with the measured image (Parodi et al 2007a, Paganetti et al 2008). Other methods use analytical forward or back-filters that transform the axial dose profile into the activity profile (Parodi and Bortfeld 2006) and vice versa (Attanasi et al 2008a, 2011). A successful estimation of the dose range from the activity depends on the accuracy of underlying cross section data (España et al 2011) and requires in any case PET images of excellent quality (Remmele et al 2011, Aiello et al 2013). However, achieving high image quality is not always possible. PET imaging for proton therapy is subject to geometrical and temporal constraints that are absent in clinical PET applications (Crespo et al 2006, Nishio et al 2010). For systems placed around the immobilized patient in the beam line, i.e., in-beam, the angular coverage is limited by the free passage needed for the beam port. Conversely, full-ring systems need to be placed out of the beam line, thus requiring a mechanical movement between the irradiation and the monitoring. This reintroduces registration uncertainties, partial waste of the emitted radiation and worsens the effects of biological washout.
A systematic comparison of these modalities shows that off-beam monitoring is not recommended, except for some specific tumours or unless the PET system is placed in the same treatment room (i.e., in-room) (Shakirin et al 2011).
In-beam monitoring is the first clinical implementation of PET for monitoring of radiotherapy. It was launched in 1997 at the experimental carbon ion therapy facility at GSI Helmholtzzentrum für Schwerionenforschung (centre for heavy ions research), Darmstadt, Germany (Enghardt et al 2004). The PET installation is completely integrated into the therapy facility and has the potential to provide the best quality feedback for treatment monitoring, since it requires no additional time to move the patient to the PET scanner. The ability to detect alignment errors is lower than in other modalities. However, the artefacts due to incomplete angular coverage can be mitigated, at least with respect to the beam direction, by increasing the detectors size and reducing the gaps between the two heads (Crespo et al 2006). Additionally, counting statistics can be improved if the acquisition is performed also during the dose delivery.
The main technological problem consists in filtering out data acquired during particles extraction, because the strong beam-induced background noise floods the PET detectors (Enghardt et al 2004, Parodi et al 2005, Crespo et al 2005). Such noise might originate from the decay of β+-emitters with half-lives in the millisecond range (e.g., 8B, 9C and 12N) with correspondingly high β+-endpoint energies, positron generating processes accompanying nuclear reactions and random coincidences with the γ-decay of excited nuclear levels (Pawelke et al 1997). Therefore, the effect is either a broadening of the β+ activity spatial distribution or a paralysis of the acquisition system due to excessive random coincidence data that do not carry any information regarding the β+ distribution (Enghardt et al 1999, Parodi et al 2002). Thus, state of the art in-beam PET solutions are only applicable to synchrotron-based facilities and their effectiveness is limited by the accelerator duty cycle (Nishikido et al 2010, Tashima et al 2012, Nishio et al 2010, Shakirin et al 2011).
Based on previous experiences with the first dedicated in-beam DoPET system (Vecchio et al 2009), we developed a new in-beam PET, with wider detectors and modularized acquisition for better counting performances (Sportelli et al 2011a). In the following we present the first reconstructed PET images of the activity produced during the continuous irradiation of a polymethyl methacrylate (PMMA) phantom at the CATANA cyclotron-based proton therapy facility. The new architecture and the improved dead time at the front-end (Belcari et al 2007) allowed to mitigate the effects of random coincidence rates and to acquire valid PET data in the high noisy environment produced by the irradiation (Sportelli et al 2012).
The paper is organized as follows: in section 2, the distribution of PET activity in time is described to give an idea of the trade-off between acquisition duration and available statistics. The PET system, the experimental set-up and the software algorithms used for image reconstruction and range determination are described in section 3. Section 4 reports the obtained results: counting statistics, energy spectra, in-beam images and activity ranges. In section 5 we discuss and conclude the work.
2. PET activity and range verification quality
Positron emitters production rate during irradiation is proportional to the current of the accelerator, i.e., to the treatment dose rate. The production of radioisotopes competes with the decay process. For most of the observed radioisotopes the irradiation condition is far from the secular equilibrium and the result is a continuous increase on the β+ activity. After the irradiation, the β+ decay is the only process occurring and the expected behaviour of the activity over time is a sum of exponential decays which is the convolution of the contribution of the various isotopes present in different quantities and decaying at different speeds.
We are interested in quantifying the amount of statistics available from most abundant isotopes produced by a continuous irradiation (beam-on) as compared to those available after the end of it (beam-off). To do so we assume that the PET detectors have sufficiently low dead time, in order not to paralyze during the irradiation because of the high background noise. In this kind of comparison, the proportion between beam-on and beam-off data is independent from the dose rate, i.e., it only depends on the half-life of each produced isotope and the involved time intervals. For simplicity let us consider two main isotopes produced by protons on PMMA, i.e., 15O and 11C, in a likely scenario in which the irradiation lasts 3 min and the acquisition 10 min. Assuming that the production is a constant process, we can describe these behaviours in arbitrary units for each separated isotope. To give an idea of the proportions between beam-on and beam-off available data, we report in figure 1 (left) the activity rates calculated as the result of the production–decay processes, with the corresponding integral contribution of data acquired during and after the irradiation (right).

Figure 1. Expected activity rates for 15O (a) and 11C (c). Integral of the activities over time for 15O (b) and 11C (d). In (b) and (d) the grey line is the annihilation integrated activity over time for beam-on only acquisitions, the black line is the integrated activity that can be acquired after the beam shut down.
Download figure:
Standard image High-resolution imageSince one of the main limiting factors in state of the art PET for in vivo monitoring is the low statistics, we aim at demonstrating that in-beam data, taken while the beam is on, can effectively contribute to improve the statistical accuracy of the reconstructed image.
In the following discussion we use three dataset types: we refer to the data acquired during the irradiation as 'beam-on' data; all the remaining data is referred to as 'beam-off' data. We call 'full-beam' data the union of both datasets for a given acquisition. In order to characterize the trade-off between acquisition duration and reconstruction noise, beam-off data are reconstructed at 60, 180, 300 or 600 s after the end of the irradiation. To evaluate the impact of beam-on data in range verification, we will compare the activity ranges calculated on the reconstructed images and their statistical precision for a given monoenergetic irradiation and for each dataset.
3. Materials and methods
3.1. The PET system
A planar positron imaging system was arranged at the beam line at CATANA proton therapy facility (INFN, Catania, Italy) (Cirrone et al 2004) as in previous experiments (Attanasi et al 2008b). In comparison to the previous system (Vecchio et al 2009), the two detector heads were increased four-fold, i.e., from 5 cm × 5 cm to 10 cm × 10 cm (Rosso et al 2013). The number of detector modules per detector head was increased from 1 to 4. The gap between each module is 6 mm. Each module is composed of 23 × 23 LYSO crystals of 1.9 mm × 1.9 mm × 16 mm. The energy response of the used LYSO crystals is characterized by a high-energy tail due to optical effects (Bonifacio et al 2010). The PET system was installed on the patient chair and the centre of its detection area was aligned with the isocentre of the beam line in the treatment room (Sportelli et al 2012, Rosso et al 2013). The distance between the two opposing detector heads is adjustable from 7 to 30 cm. The field of view (FOV) is 10 cm × 10 cm × D cm, where D is the distance between the two detector heads. The point source resolution at the centre is 1.2 mm × 1.2 mm × 6.0 mm full width at half maximum.
The acquisition system features a custom modular board able to handle up to 18 modules (Sportelli et al 2011a). Coincidence detection is performed by a synchronous processor operating at 240 MHz and providing a coincidence resolution of 3 ns (Sportelli et al 2011b). The maximum data collection rate for detected coincidences is about 1 million counts per second (cps), though this limit has been never reached with eight modules, because of the counting limits of single photons at the front-end.
The information of the on–off time points of beam irradiation is currently inferred from the count rates and double checked with the beam monitors with a resolution of 1 s. For future acquisitions it is planned to record the beam status from an external signal synchronized with the accelerator.
The detection efficiency was calibrated by using a 11 cm × 11 cm × 0.3 cm planar plastic container filled with 18F-fluorodeoxyglucose (FDG) placed at the middle of the FOV and parallel to the detectors surface. The calibration is used for a correction of the imaging uniformity and the detection sensitivity. The maximum coincidence counting rate observed with the planar source filled with 26 MBq of FDG is 300 kcps.
3.2. Experimental set-up
Eye melanoma treatments at CATANA use typically 62 MeV proton beams with dose rates that vary from 10 to 20 Gy min−1 (Cuttone et al 2011). Our measurements were performed with monoenergetic passively collimated proton beams of 62 MeV. Only pristine Bragg peaks were used, which are characterized by a peak-to-plateau ratio of 5. We did not apply any range modulation in order to simplify the analysis at the activity distal endpoint. This differs from the clinical practice, where a spread out Bragg peak (SOBP) obtained with a PMMA modulator wheel is generally used to cover the whole extension of the tumour in depth with the prescribed dose. In our experiment variable accelerator currents were delivered on the PMMA phantom with dose rates at the low end of the typical values, i.e., ranging from 0.7 to 9.7 Gy min−1. A homogeneous PMMA block phantom was placed at the centre of the FOV and irradiated with a beam of 34 mm diameter. The distance between the two heads was set at 20 cm. A list of the four performed irradiations is reported in table 1. The value of the absolute dose corresponds to the dose at the entrance of the phantom.
Table 1. Acquisitions performed at the CATANA facility.
| Acquisition | Total dose (Gy) | Delivery time (s) | Dose rate (Gy min−1) |
|---|---|---|---|
| 1 | 2 | 170 | 0.7 |
| 2 | 5 | 186 | 1.6 |
| 3 | 10 | 197 | 3.0 |
| 4 | 20 | 124 | 9.7 |
Each measurement was performed sequentially on initially inactive phantoms of PMMA. The dose and the beam current were preset at the beginning of the irradiation. The phantom was irradiated continuously until reaching the preset dose in the beam monitor. The dose rate was calculated as the total dose divided by the irradiation time. Activity position and intensity were measured during the irradiation plus 600 s immediately after the end of the irradiation.
Coincidence data were stored in a list mode format. Single, coincident and random counts rates were recorded in a separate file with binning intervals of one second. Random coincidence rates were measured, but their spatial distribution was not acquired.
3.3. Image reconstruction
Images were reconstructed using an iterative Maximum Likelihood Expectation Maximization (MLEM) reconstruction algorithm. The implemented algorithm makes use of a system model computed using a multi-ray variant of the Siddon algorithm (Moehrs et al 2008). Images and profiles used in this work were all obtained by performing five MLEM iterations. Each iteration took 5 s to be computed on a 64 bit Intel i5-2400 based machine with four cores running at 3.1 GHz. There are also plans for performing the same reconstruction on a GPU-based implementation (Sportelli et al 2013). Data were reconstructed using a LOR based data structure and applying a 350–850 keV energy window. The size of the reconstructed image is 100 × 100 × 100 voxels, 1 mm × 1 mm × 1 mm each, thus including the complete FOV up to 5 cm from the detectors surface. At present, no random or attenuation correction was applied.
3.4. Estimation of the activity distal fall-off
Several methods have been used for the estimation of the activity distal fall-off. The depth in the phantom where the distal fall-off of the activity profile occurs can be measured by finding, in the axial profile of the reconstructed activity distribution, the coordinate of the point where the activity falls at 20% or 50% of the maximum value reached along the beam path (Parodi and Bortfeld 2006, Parodi et al 2007b, Moteabbed et al 2011, Min et al 2013). A way to evaluate the precision of this estimation is to repeat this measurement for each  thin profile along the beam direction drawn in a defined region of interest (ROI) within the activated region. For irradiations along the axial direction of the scanner, the profiles are naturally defined by lines of voxels in the image space (Helmbrecht et al 2012, Min et al 2013, Surti et al 2011).
A problem in estimating the activity distal range on voxels lines is that such lines have much lower statistics with respect to macroscopic profiles over larger regions. The low statistics can cause spikes that make it difficult to properly determine the threshold level. Our approach has been to first detect the proximal and distal edges of each line as the two longest monotonic paths in the profile. In doing so, any relatively small spike with respect to the detected path was removed (figure 2). The position of each edge was then determined as the threshold level over the local path maximum. The proper choice of the range verification position in the fall-off region in the clinical practice can be controversial, because ranges obtained with high thresholds are affected by the width of the SOBP while those obtained with low thresholds are generally more sensitive to image noise and to the beam energy spread (Parodi et al 2007a). Thus, thresholds ranging from 20% to 50% are generally used (Knopf et al 2008). For our purposes a 50% threshold value is a reliable choice because in this study we have do not use SOBP. Also, lower thresholds would be more problematic due to the low statistics of the datasets involved in this study.

Figure 2. Example of range determination on voxel line profiles for two images with relatively low (a) and high (b) statistics. The lines marked in grey are the detected proximal and distal edges of each line profile, whose endpoints are circled in black. Horizontal dashed lines are the local threshold levels, while vertical ones are the detected edge positions used for range determination.
Download figure:
Standard image High-resolution imageFor irradiations performed with monoenergetic beams, like in the present set-up, one can suppose that the proton range is the same for each profile and then a constant depth for the distal activity fall-off can be expected. Thus, the precision of the range measurement was estimated by calculating the standard deviation of the measurements performed in each profile (σdepth). The accuracy of the measurement of the distal fall-off of the activity profile can be estimated as the deviation of the average depth (μdepth, t), as calculated from all the 1D profile measurements with data acquired up to a time t, from the estimation of the average depth, calculated in the same way, but using the whole statistics of 10 min of PET measurement with beam-off (μdepth, 600s). The latter is considered here as the best estimation, for each irradiation, of the depth of the activity distal fall-off, being the measurement with the lesser statistical error.
4. Results
4.1. Comparison of counting statistics
Total and random coincidence rates for the four acquisitions are shown in figure 3. During the irradiation the count rates for both true and random coincidences increase abruptly, indicating the presence of fast nuclear processes. The random to total coincidence ratio decreases during the irradiation. The maximum observed random to total coincidence ratio is 24.5%, at the beginning of the  irradiation. The acquisition rates at the beginning, at the end and right after the irradiation are reported in table 2.

Figure 3. Activity rates recorded during the four examined acquisitions. Vertical dashed lines mark the end of each irradiation. Solid lines represent the total coincidence rates, dot–dashed lines represent the randoms rates.
Download figure:
Standard image High-resolution imageTable 2. Total (T) and random (R) coincidence rates for the four acquisitions at the beginning, at the end and right after the irradiation.
| Irradiation begin | Irradiation end | After irradiation | |||||||
|---|---|---|---|---|---|---|---|---|---|
| # | T | R | R/T(%) | T | R | R/T(%) | T | R | R/T(%) |
| 1 | 1.3 kHz | 82 Hz | 6.6 | 2.9 kHz | 98 Hz | 3.4 | 1.9 kHz | 24 Hz | 1.3 |
| 2 | 2.4 kHz | 221 Hz | 9.0 | 6.7 kHz | 318 Hz | 4.7 | 4.4 kHz | 42 Hz | 1.0 |
| 3 | 5.4 kHz | 0.7 kHz | 12.2 | 12.8 kHz | 1.0 kHz | 7.4 | 8.5 kHz | 89 Hz | 1.0 |
| 4 | 17.0 kHz | 4.1 kHz | 24.5 | 35.8 kHz | 6.2 kHz | 17.4 | 19.1 kHz | 261 Hz | 1.4 |
4.2. Energy distribution of the acquired data
Energy histograms of the acquired coincidences are reported in figure 4. The black line corresponds to the coincidences acquired during the irradiation (beam-on). The grey line corresponds to the coincidences acquired after it (beam-off). Dashed lines mark the  energy window used for image reconstruction. The spectrum of beam-off data remains almost unchanged with the different dose rates, except for the
  intrinsic emission peak of
  , which is more evident at low dose rates, as expected. A high-energy tail is present in both beam-off and beam-on data due to optical attenuation in the used scintillating crystals (Bonifacio et al 2010). This tail goes from the
  peak to roughly
  . With higher dose rates, beam-on data show an increasing degradation of the annihilation photo-peak and a generally higher base level at all energies. This behaviour was also expected due to the radiation noise during the delivery. The fraction of events within the selected energy window is reported in table 3. While the beam is on, the fraction of events with energies
  is much higher and is increasing with the dose rate.

Figure 4. Energy histograms for beam-on and beam-off data related to the four examined acquisitions.
Download figure:
Standard image High-resolution imageTable 3. Percentage of events within and at the two sides of the  energy window used for image reconstructions. The sum of percentages may not be 100% due to rounding errors.
| Beam-off | Beam-on | |||||
|---|---|---|---|---|---|---|
 |
 |
 |
 |
 |
 |
|
| 1 | 29.1% | 68.8% | 2.1% | 27.8% | 61.9% | 10.3% |
| 2 | 25.6% | 72.3% | 2.1% | 25.2% | 63.7% | 11.1% |
| 3 | 23.4% | 74.5% | 2.0% | 25.6% | 62.2% | 12.2% |
| 4 | 22.4% | 75.7% | 1.9% | 26.0% | 54.6% | 19.3% |
4.3. Distal fall-off during and after the irradiation
The reconstructed images for acquisition 1 ( ) and 4 (
 ) are shown in figures 5 and 6, respectively, including beam-on only data (a), 60 s of beam-off data (b), 60 s of full-beam data (c) and 600 s of full-beam data (d). The ROIs used for range determination are marked with a dashed line. The ROIs are cylindrical with
  diameter and
  height. Profiles calculated on such images are shown in figure 7(a)–(d), i.e.,
  , and compared with images of the fourth acquisition (e)–(h), i.e.,
  . The dose range is reported as a black dashed line in each plot. Dose range has been calculated given the depth of the Bragg peak in homogeneous PMMA, i.e., 29 mm (Oelfke et al 1996), starting from the activity rising edge. In figure 7 it can be seen how the image background noise is higher when the reconstruction is performed with low statistics, i.e., low dose (a)–(d), rather than with high dose rates (e)–(h).
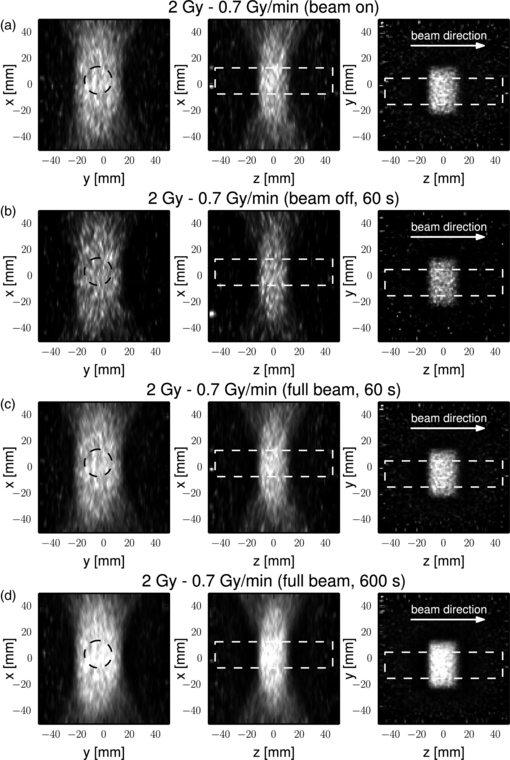
Figure 5. Reconstructed images of the  irradiation in three orthogonal planes, centred in the field of view, for different time-sets: beam-on only data (a), first 60 s of beam-off data (b), beam-on data plus 60 s of beam-off data (c), beam-on data plus 600 s of beam-off data (d). The region marked with a dashed line represents the cylindrical ROI used for range calculation. The diameter of the cylinder is
  , the height is
  .
.
Download figure:
Standard image High-resolution image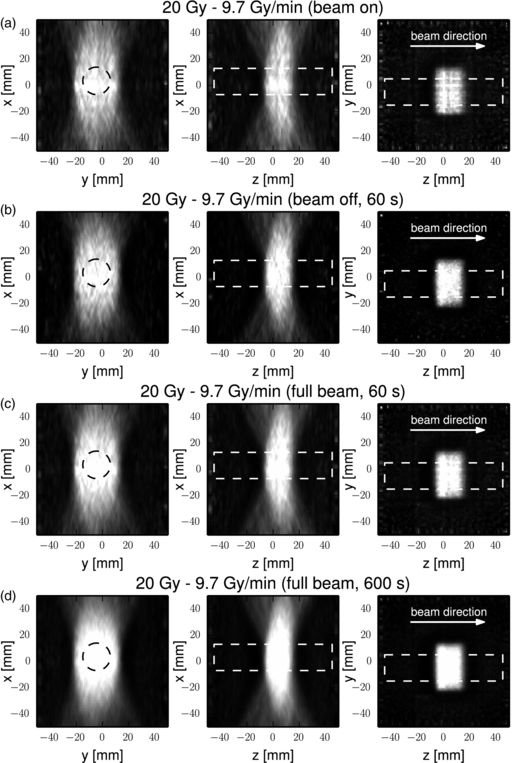
Figure 6. Reconstructed images of the  irradiation in three orthogonal planes, centred in the field of view, for different time-sets: beam-on only data (a), first 60 s of beam-off data (b), beam-on data plus 60 s of beam-off data (c), beam-on data plus 600 s of beam-off data (d). The region marked with a dashed line represents the cylindrical ROI used for range calculation. The diameter of the cylinder is
  , the height is
  .
.
Download figure:
Standard image High-resolution image
Figure 7. Profiles of the reconstructed images for 2 Gy (left column, (a)–(d)) and 20 Gy (right column, (e)–(h)) irradiations on different time-sets: beam-on only data ((a), (e)), first 60 s of beam-off data ((b), (f)), beam-on data plus 60 s of beam-off data ((c), (g)), beam-on data plus 600 s of beam-off data ((d), (h)). The plot is obtained by superimposing the profiles of each voxel line included in the ROI (see figures 5 and 6). The white dashed line is the mean of all voxel lines. The z coordinate of the dose range is indicated with a black dashed line. Dose range has been calculated given the depth of the Bragg peak in homogeneous PMMA, i.e., 29 mm, starting from the activity rising edge.
Download figure:
Standard image High-resolution imageThe noise level in the image is reflected in the distribution of the calculated distal ranges. figure 8 shows the variation of the average depth and the relative standard deviation of the measurement of the distal fall-off related to the activity profile for each of the four acquisitions here considered. For each acquisition μdepth and σdepth are reported as estimated from beam-on data only (t = 0, dotted line), beam-off data only (at  ,
,  ,
,  and
and  ), and full-beam data, including both beam-on and beam-off data. Values for μdepth, t and σdepth, t are also reported in table 4. Plots show that the value of μdepth, t derived with beam-off data only (grey line) is slightly underestimated with respect to the reference value of μdepth, 600s (highest statistics) when the acquisition time is short, while it converges to the latter as the time increases. The μdepth, 0s value (beam-on only) is overestimated with respect to μdepth, 600s in all cases but the 2 Gy irradiation. The inclusion of beam-on data (full-beam) always improves the convergence speed. As for image noise, a higher standard deviation is obtained for low doses and thus a less precise range is determined.

Figure 8. Means and standard deviations of activity ranges versus time for all the reconstructed images. The expected dose range of the used 62 MeV proton beams in PMMA is 29 mm.
Download figure:
Standard image High-resolution imageTable 4. Mean values for the range profiles of the four examined acquisitions. Standard deviations are reported within parentheses. Beam-on only column includes all data from the beginning to the end of the irradiation (EOI). All values are expressed in  .
.
| Beam-on only | Beam-off only | Full-beam | |||||||
|---|---|---|---|---|---|---|---|---|---|
| # | EOI | 60 s | 180 s | 300 s | 600 s | 60 s | 180 s | 300 s | 600 s |
| 1 | 18.7 (2.2) | 17.5 (3.0) | 18.5 (1,3) | 18.8 (1.0) | 18.9 (0.9) | 18.9 (1.5) | 18.9 (0.9) | 19.0 (0.8) | 19.1 (0.7) |
| 2 | 19.3 (0.8) | 18.6 (1.4) | 19.0 (0.5) | 19.0 (0.5) | 19.1 (0.5) | 19.3 (0.6) | 19.2 (0.5) | 19.3 (0.5) | 19.2 (0.5) |
| 3 | 19.2 (0.6) | 18.9 (0.7) | 19.0 (0.5) | 19.0 (0.4) | 19.1 (0.4) | 19.2 (0.5) | 19.2 (0.4) | 19.1 (0.4) | 19.1 (0.4) |
| 4 | 19.9 (0.6) | 19.0 (0.5) | 19.2 (0.3) | 19.2 (0.3) | 19.3 (0.2) | 19.5 (0.4) | 19.5 (0.3) | 19.4 (0.3) | 19.5 (0.2) |
In each of the four acquisitions, the largest mean range deviation from the reference value is seen in the images reconstructed with only 60 s of beam-off data. The same effect has been observed in all the acquisitions with less than one million events (figure 9), thus suggesting a systematic range determination error for very low statistics.

Figure 9. Means and standard deviations of activity ranges versus total acquired events for all the reconstructed images. The expected dose range of the used 62 MeV proton beams in PMMA is 29 mm.
Download figure:
Standard image High-resolution image
5. Conclusions
We have built and optimized a modular dual-head PET system for treatment monitoring in hadron therapy. The system can operate continuously in-beam and is able to successfully acquire the produced β+ activity in a field-of-view of 10 cm × 10 cm × 10 cm also during the irradiation. A distinction has been introduced between beam-on, beam-off and full-beam data, referring to the acquisition output during the irradiation, after or both, respectively. The question that has been addressed is if beam-on data can be used, either alone or jointly with beam-off data, to improve the quality of the system response for monitoring purposes. A set of PET measurements was then performed at the cyclotron-based proton therapy facility at CATANA, during the irradiation of a PMMA phantom at different dose rates and stopping the acquisition 10 min after.
As already observed in other studies, a characteristic high random count rate appears during the irradiation. This count rate is roughly constant with a continuous beam and increases quickly with the dose rate. Since the phantom activation increases during the irradiation, the randoms to total coincidences fraction decreases with time and becomes abruptly negligible right after the beam turns off. The maximum observed fraction at the beginning of an irradiation with 9.7 Gy min−1 dose rate is 24.5%. This value is of the same order of an acceptable randoms fraction in clinical PET imaging. However, the noise structure is different from random coincidence noise in conventional PET, thus future studies are expected to better characterize its nature with respect to useful β+ activity and to improve the techniques used for reconstructing such data.
The coincidence energy spectra of beam-on and beam-off data were also compared. A small flat contamination from radiation with energies up to  was observed in beam-on data (
 is the dynamic range of the system). With dose rates up to about
  no significant degradation of the energy spectra was observed, being the percentage of acquired events within the
  energy window up to 62.2% of the total.
For each measurement and modality we estimated accuracy and precision by studying the distribution of the activity ranges of a set of voxel lines within the activated material. Results show that the inclusion of beam-on data improves both the precision and accuracy of the proton range measurement with respect to data acquired after the irradiation only. The use of beam-on data is enough to give a precision better that 1 mm (σ) when at least 5 Gy are delivered. Alternatively, beam-on data can be effectively used to increase the available statistics for image reconstruction when the dose is lower. For the lowest available dose rate (2 Gy min−1), beam-on data did not produce sub-millimetric range precision, but the precision of the first 60 s of full-beam data is half with respect to that obtained with beam-off data only.
The PET reconstructed signal is not quantitative. No developments were carried out to study its capability as a quantitative instrument, but with proper calibration we expect its response to be linear within a wide range of input rates. There are no reasons a priori that would hamper its ability to give quantitative results more than in conventional PET systems.
The results of this investigation are promising for improving the quality and promptness of PET monitoring, though there is still a big margin for improvement. The proposed in-beam PET system has in principle the same geometrical limitations as previous in-beam solutions, but uses new electronics that allow to reduce the acquisition duration. It is compatible with Monte Carlo based simulations as well as with all the range verification techniques that have been used so far. However, it requires the detectors response to be included in the simulation model so as to take into account the artefacts due to the limited angular coverage. Washout effects are expected to be less prominent than in any other PET imaging technique, since the acquisition lasts only a few minutes from the beginning of the irradiation.
Future work is planned to increase the angular coverage of the system, in order to improve random coincidences management, to refine system synchronization with the beam and to characterize the detectors response. Extending the detectors area from 10 cm × 10 cm to 15 cm × 15 cm would require no major changes. The number of detector modules would increase from 8 to 18 and the software analysis would be more complex, but the overall acquisition architecture and implementation would remain the same.
Acknowledgments
This research has been supported by the INFN-RT 60141 POR CRO FSE 2007-2013, Spain's Ministry of Economy (TEC2010-21619-C04-03, TEC2011-28972-C02-02 and AMIT-CDTI), Comunidad de Madrid (ARTEMIS S2009/DPI-1802), FULLBEAM-300838 Marie Curie Intra European Fellowship within the '7th European Community Framework Programme' (FP7), ENVISION project (FP7) and the European Regional Development Funds (FEDER).