
Abstract
It was recently reported that the time-resolved measurement of diffuse reflectance and/or fluorescence during injection of an optical contrast agent may constitute a basis for a technique to assess cerebral perfusion. In this paper, we present results of Monte Carlo simulations of the propagation of excitation photons and tracking of fluorescence photons in a two-layered tissue model mimicking intra- and extracerebral tissue compartments. Spatial 3D distributions of the probability that the photons were converted from excitation to emission wavelength in a defined voxel of the medium (generation probability) during their travel between source and detector were obtained for different optical properties in intra- and extracerebral tissue compartments. It was noted that the spatial distribution of the generation probability depends on the distribution of the fluorophore in the medium and is influenced by the absorption of the medium and of the fluorophore at excitation and emission wavelengths. Simulations were also carried out for realistic time courses of the dye concentration in both layers. The results of the study show that the knowledge of the absorption properties of the medium at excitation and emission wavelengths is essential for the interpretation of the time-resolved fluorescence signals measured on the surface of the head.
Export citation and abstract BibTeX RIS
1. Introduction
The time-resolved near-infrared spectroscopy is one of the most advanced optical imaging techniques used in functional brain imaging, brain tissue oxygenation studies and brain perfusion assessment (Torricelli et al 2014). The time-resolved measurements allow one to reduce the influence of the changes in oxygenation and/or perfusion in extracerebral tissues (skin and skull) on the optical signals measured on the head of an adult (Liebert et al 2004, Wabnitz et al 2010, Kirilina et al 2012). In the recent years, this technique was extensively tested as a useful tool for estimation of brain oxygenation changes (Kacprzak et al 2007, 2012, Butti et al 2009, Murkin and Arango 2009, Hoshino et al 2010, Wabnitz et al 2010, Yokose et al 2010, Gagnon et al 2012, Milej et al 2014) and in assessment of brain perfusion disorders (Terborg et al 2004, 2009, Zolek et al 2006, 2008, Steinkellner et al 2010, Sakatani et al 2013, Weigl et al 2014). These last tests are based on time-resolved measurements carried out during inflow and washout of an exogenous optical contrast agent. Indocyanine green (ICG) is a popular and relatively safe dye which was commonly used in these studies (Kuebler et al 1998, Desmettre 1999, Intes et al 2003, Keller et al 2003, de Liguori Carino et al 2009, Sheng et al 2009, Elliott et al 2013). Recently, it was also reported that the fluorescence of the ICG can be utilized in brain perfusion assessment (Liebert et al 2006, 2013, Jelzow et al 2012, Milej et al 2012, Weigl et al 2014). It was shown that the fluorescence signals reveal a good specificity and can be measured with a higher contrast to noise ratio than the diffuse reflectance (Milej et al 2010).
Considering the classical diffuse reflectance measurements, assessment of the paths of photons penetrating inside the tissues remains a challenge. Distributions of these paths influence the sensitivity profiles of the measurement (Hiraoka et al 1993, Liebert et al 2008, Sawosz et al 2012). Many researchers use the Monte Carlo simulations as an effective tool for modeling of physical phenomena associated with the propagation of light in a medium of complex structure like living tissue (Okada and Delpy 2003a, 2003b, Liebert et al 2008, Fang and Boas 2009, Tian et al 2011). Several Monte Carlo codes were developed for time-resolved analysis of light penetration in tissue models (Steinbrink et al 2001, Liebert et al 2004, Fang and Boas 2009). Some other Monte Carlo algorithms consider additional effects like frequency changes of the light wave (related to the Doppler scattering) (de Mul 1992, Koelink et al 1994, Liebert et al 2006c, Wojtkiewicz et al 2009) or excitation of fluorescence and propagation of fluorescence photons through the medium (Swartling et al 2003, Liebert et al 2008).
In this paper we applied a Monte Carlo code proposed by Liebert et al (2008) allowing for effective time-resolved analysis of effects related to the excitation of fluorescence photons and their penetration in two-layered tissue model in which the layers mimic intra- and extracerebral tissues (Milej et al 2013). Distributions of times of arrival (DTAs) of fluorescence photons were derived for typical source–detector separations used in in-vivo studies. Spatial distributions of the generation and the visiting probabilities were also calculated. Finally correlations between these spatial distributions of the generation probability and DTAs, acquired on the medium surface were analyzed and discussed in context of potential utilization of measured DTAs in assessment of inflow of the dye into the intracerebral tissue compartment.
2. Monte Carlo simulations
The Monte Carlo algorithm used in this study was described in detail elsewhere (Liebert et al 2008). The algorithm is based on the assumption that the scattering properties of the medium at excitation and emission wavelengths are the same. In measurements of inflow and washout of the ICG this assumption is reasonable since the difference between the emission and excitation wavelengths is small. Typically in ICG-based measurements the excitation wavelength is selected between 760 and 780 nm (Liebert et al 2006, Kacprzak et al 2010, Jelzow et al 2012, Milej et al 2014, Weigl et al 2014). This selection is related to the maximum of absorption spectrum of the dye. Emission of the ICG can be observed in the range of wavelengths between 800 and 870 nm (Gerega et al 2012). Analysis of spectral properties of ICG was carried out in an in-vivo experiment and it was observed that the maximum of its absorption is located at about 790 nm and maximum of emission at about 820 nm (Gerega et al 2012). Considering limited variability of the reduced scattering coefficient µs' of the tissue in the 760–820 nm region (Srinivasan et al 2005, Niemz 2007) it can be assumed that scattering properties at excitation and emission wavelengths are similar.
The simulations are carried out in the reflectance geometry in a two-layered model where the optical properties of the individual layers are homogeneous. It is assumed that a photon penetrating from the source position can be converted to a fluorescence photon. The fluorescence photon after some propagation in the medium is reemitted at an escape point on the medium surface. Due to the assumption that the scattering properties at the excitation and emission wavelengths are the same, the path of the excitation photon as well as fluorescence photon can be derived using the same isotropic probability distributions of scattering direction and the length of travel between two consecutive scattering events. The Monte Carlo algorithm calculates a weight of every fluorescence photon Wm reemitted on the surface of the medium (Liebert et al 2008):

where q: index of a scattering event, i: index of a photon, Wsx: probability of survival of the excitation photon during its travel from the source position to the conversion position, Pc: probability of conversion of the excitation photon to the fluorescence photon, Wsm: probability of survival of the fluorescence photon during its travel from the conversion point to the escape point on the surface of the model. The weights of fluorescence photons are collected according to the distance between source and detector rSD and total time spent by the photon in the medium t. This procedure allows to calculate DTAs of fluorescence photons at different source–detector separations.
In addition, spatial distributions of the fluorescence generation probability Pg (Liebert et al 2008) were calculated for a fixed source–detector separation. This generation probability refers to the contributions to the fluorescence signal generated within a given voxel of size Δx, Δy, Δz centered around (x, y, z). The contributions related to the photon conversion probability within this voxel obtained for all photons which pass through this voxel with a total travel time within the interval (t − Δt/2, t + Δt/2) were summed up. The probability Pg that the photon will be converted in the defined voxel of the medium can be expressed as

where the coordinates of the qth scattering event are defined by xq, yq and zq:

The first summation extends over all scattering events q that occur within the given voxel.
Additionally, we have analyzed the visiting probability Pv (Hiraoka et al 1993) which is related to the trajectories of those photons which contribute to the fluorescence signal:

where Ni(x, y, z) is the number of scattering events that occurred inside the voxel for the photon i. All scattering events are summed up irrespective of the position where the excitation photon is converted to a fluorescence photon. The visiting probability is the probability that the photon traveled through the given voxel along its path from the source to the detector and that it was converted during its total travel from excitation to emission wavelength. The visiting probability does not depend on the position of the fluorescence conversion. In our model we neglected the fluorescence lifetime τF of the dye (see Liebert et al (2008)). With a finite τF the DTA would need to be convolved with the fluorescence decay. Similarly, for every voxel the time-dependent changes in probabilities should be convolved with the fluorescence decay. However, τF does not influence changes in moments of the DTAs, as long as it is constant on the bolus time scale (Gerega et al 2011).
The calculations shown in the present paper refer to the two-layered tissue model in which the upper layer (UP) mimics the extracerebral tissues (skin, skull) and the lower layer (LOW) simulates brain tissue. In all these simulations initial optical properties of both layers of the medium were selected within the range of optical properties typical for tissues in the human head (Jager and Kienle 2011): absorption coefficient of the medium at the excitation wavelength µax = µax,UP = µax,LOW = 0.1 cm−1, absorption coefficient of the medium at the emission wavelength µam = µam,UP = µam,LOW = 0.1 cm−1, reduced scattering coefficient of the medium at excitation and emission wavelengths µ'sx = µ'sx,UP = µ'sx,LOW = µ'sm = µ'sm,UP = µ'sm,LOW = 10 cm−1, refractive index of the medium n = 1.4. The absorption coefficient of the dye at the emission wavelength was assumed to be constant during the simulations µafm = µafm,UP = µafm,LOW = 0.001 cm−1. The superficial (extracerebral) layer was assumed to be 1 cm thick and the deeper (intracerebral) layer was 1 m thick (which mimics a semi-infinite medium). Both layers were assumed to be optically homogeneous. The photons are injected into the medium in a single point at angle of 90° to the surface. All fluorescence photons remitted on the surface of the ring-shaped detectors are collected regardless of their direction at the point of the escape from the medium. The DTAs of fluorescence photons were calculated for a set of 19 ring-shaped detectors, each 3 mm wide, and for 150 time windows of 25 ps each covering a total time interval from 0 to 3.75 ns. Results of simulations are presented for three of these detectors for which the inner radius (which refers to the source–detector separation) was 4, 14 and 29 mm.
In reports on time-resolved fluorescence measurements of ICG bolus tracking, statistical moments of the DTAs were previously analyzed and presented (Liebert et al 2006, Milej et al 2012). Therefore, in this study changes in the moments of DTAs of fluorescence photons caused by the simulated changes in the absorption coefficient of the fluorophore at excitation wavelength µafx for the two-layered tissue model were analyzed. Changes in the total photon count Ntot were analyzed together with the first moment of the DTA which is a measure of the mean time of arrival of fluorescence photons 〈t〉 and the second centralized moment of the DTA which is its variance V. For the definition of these moments see, e.g. Liebert et al (2003).
To model inflow and washout of a bolus of the contrast agent ICG, temporal absorption changes of the fluorophore µafx(T) were implemented independently for both layers of the medium according to the algorithm proposed by Leung et al (2007). It allows one to mimic the changes in concentration of ICG in the extra- and intracerebral tissue layers as a function of time (T). The maximum value of the dye absorption was assumed to be µafx, max = 0.05 cm−1, resulting from an ICG concentration of (0.22 µM) which may be observed in the brain tissue during in-vivo experiments after a small dose bolus of the ICG (1.5 mg) (Milej et al 2012). It was also assumed that in the initial pre-bolus phase the dye is distributed homogeneously in both layers of the model (µafx = 0.002 cm−1) which is related to the residual concentration of the dye resulting from previous ICG injection (Liebert et al 2006, Milej et al 2012). The Monte Carlo algorithm was implemented in C language. A single scenario allowing to observe inflow and washout effects (which consists of 90 combinations of µafx in both layers of the model) took about 1 h on a four-core processor (2.33 GHz) PC machine.
First, the spatial distributions of the generation and visiting probabilities were obtained as a function of time of arrival of fluorescence photons (t) for selected combinations of absorption coefficients in lower and upper layers of the medium. These distributions were obtained by summing up photons arriving at 14 selected total travel times t = 0.25, 0.5, ..., 3.5 ns within the interval (t − Δt/2, t + Δt/2) for Δt = 0.25 ns. Next, these spatial distributions of probability were derived for combinations of µafx in the upper and lower layers corresponding to the temporal course of the dye concentration change during the dynamic inflow and washout of the dye (function of T). Analysis of the spatial distributions of probability as well as DTAs obtained during each simulation was carried out in MATLAB (Mathworks Inc., USA). The probability distributions related to continuous wave measurement were obtained by summing up the 14 distributions obtained for different times of arrival t. The 3D distributions of the visiting and the generation probabilities calculated by the Monte Carlo simulations were obtained in a 60 × 60 × 50 mesh of voxels of 1 × 1 × 1 mm3. Two projections of these distributions were derived for presentation purposes: (i) projection on the plane which contains source and detector points (integration along the y axis) and (ii) projection on the surface of the medium (integration along the z axis). Example images of such distributions are shown in figure 1.
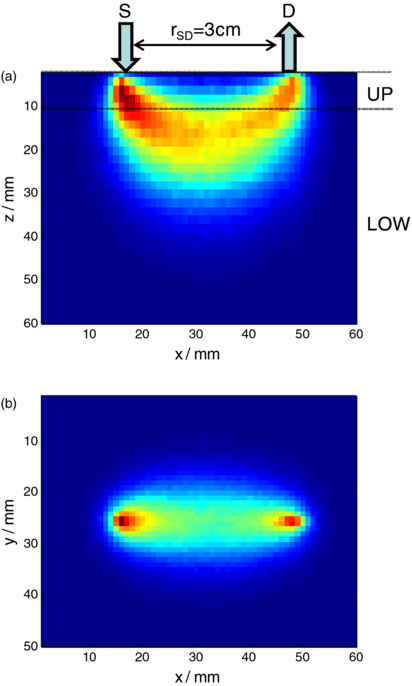
Figure 1. Example of spatial distribution of the generation probability related to continuous wave measurement obtained by summing up the distributions obtained for different times of arrival t. Two projections of the 3D distribution are presented: (a) projection on the plane that is perpendicular to the surface and contains the source and detector points (integration along the y axis) and (b) projection on the surface of the medium (integration along the z axis). rSD: source–detector separation, x, y, z: coordinates of the model. Distribution of the generation probability was derived for the two-layered model with the following optical properties: µax = µam = 0.05 cm−1, µ'sx = µ'sm = 10 cm−1, µafm = 0.001 cm−1, µafx,UP = µafx,LOW = 0.001 cm−1.
Download figure:
Standard image High-resolution image3. Results and discussion
3.1. Homogeneous model
First, basic features of the spatial distribution of the generation probability will be considered for a medium with homogeneous optical properties. Spatial distributions of the visiting and the generation probabilities were obtained for a homogeneous medium at source–detector separation rSD = 29 mm for different relations between absorption coefficient of the medium at excitation (µax) and emission wavelength (µam). These distributions are presented in figure 2. A strong correlation between the ratio of absorption coefficients and position of the highest generation probability value can be observed.
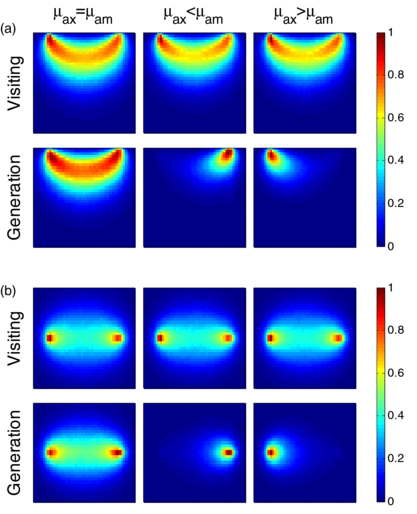
Figure 2. Spatial distributions of the visiting and the generation probabilities obtained for source–detector separation rSD = 29 mm for homogeneous optical properties of the medium: two projections of the distributions are presented in panels (a) and (b) for different relations between absorption coefficient of the medium at excitation (µax) and emission (µam) wavelengths. Simulations carried out for µ'sx = µ'sm = 10 cm−1, µafm = 0.001 cm−1, µafx,UP = µafx,LOW = 0.001 cm−1, µax = 0.1 cm−1, µam = 0.1 cm−1 (left column), µax = 0.1 cm−1, µam = 0.2 cm−1 (middle column) and µax = 0.2 cm−1, µam = 0.1 cm−1 (right column). Presented spatial distributions of the generation probability are related to continuous wave measurement and were obtained by summing up the distributions obtained for different times of arrival t.
Download figure:
Standard image High-resolution imageThe profiles of the visiting probability are quite similar in the three cases and similar to the banana-like shape known from diffuse reflectance sensitivity distributions (Sawosz et al 2012). In contrast, the generation probability profile forms a banana-shaped volume only when µax = µam (left column in the figure 2). When the absorption coefficient of the medium at the excitation wavelength µax is lower than the absorption coefficient of the medium at the emission wavelength µam the volume of high generation probability is localized close to the detector position (middle column in figure 2). This effect is connected with the high probability that the fluorescence photons excited along the path between source and detector will be absorbed by the medium itself before exiting the medium (high µam). In opposite, when the absorption coefficient of the medium at the excitation wavelength µax is higher than the absorption coefficient of the medium at the emission wavelength µam, the high generation probability volume is localized close to the source position (right column in figure 2). The fluorescence photons generated in this region reach the detector with a higher probability than the excitation photons. This phenomenon leads to a decrease of the probability that the excitation photon will reach on its path locations close to the detector. Additionally, the fluorescence photons excited inside the medium have a high probability to escape the medium at the detector location (low µam). It should be also noted that these phenomena influence significantly the distributions of the generation probability. However, they do not influence seriously the distributions of visiting probability which form the typical 'banana' shapes.
3.2. Two-layered model
Spatial distributions of the visiting and the generation probabilities for a two-layered model allow one to assess the influence of the absorption coefficients at the excitation and emission wavelengths on the results of in-vivo experiments during the inflow of the dye into extra- and intracerebral tissue layers.
Simulations were carried out for a two-layered medium in which: (i) the absorption coefficient of the dye at excitation wavelength in the upper layer µafx,UP was ten times higher than in the lower layer (µafx,UP = 0.01 cm−1, µafx,LOW = 0.001 cm−1) (results shown in figure 3) (ii) the absorption coefficient of the dye at excitation wavelength in the lower layer was 10 times larger than in the upper layer (µafx,UP = 0.001 cm−1, µafx,LOW = 0.01 cm−1) (results shown in figure 4). These assumptions mimic the situations with high dye concentration (maximum of the dye bolus) in one of the layers only. In addition, the influence of different absorption of the medium at the excitation and emission wavelengths (equal for both layers) was studied. The related absorption coefficients are given in the captions of figures 3 and 4. The other parameters (scattering, rSD) were kept the same as in the homogeneous case (see section 3.1).
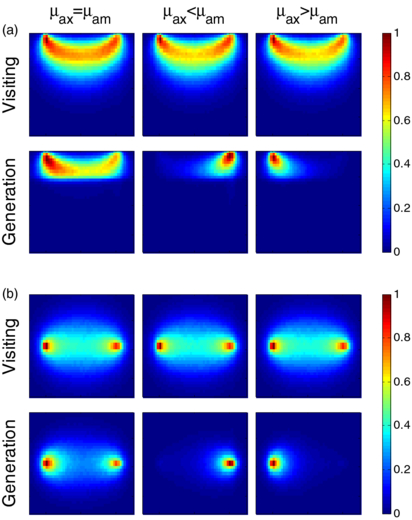
Figure 3. Spatial distributions of the visiting and the generation probability at source–detector separation rSD = 29 mm for the two-layered model with the following optical properties: µafx,LOW = 0.001 cm−1, µafx,UP = 0.01 cm−1, and for different relations between absorption coefficient of the medium at excitation (µax) and emission (µam) wavelengths. Two projections of the distributions are presented in panels (a) and (b). Simulations were carried out for µ'sx = µ'sm = 10 cm−1, µafm = 0.001 cm−1 and µax = 0.1 cm−1, µam = 0.1 cm−1 (left column), µax = 0.1 cm−1, µam = 0.2 cm−1 (middle column) and µax = 0.2 cm−1, µam = 0.1 cm−1 (right column). Presented spatial distributions of the generation probability are related to continuous wave measurement and were obtained by summing up the distributions obtained for different times of arrival t.
Download figure:
Standard image High-resolution image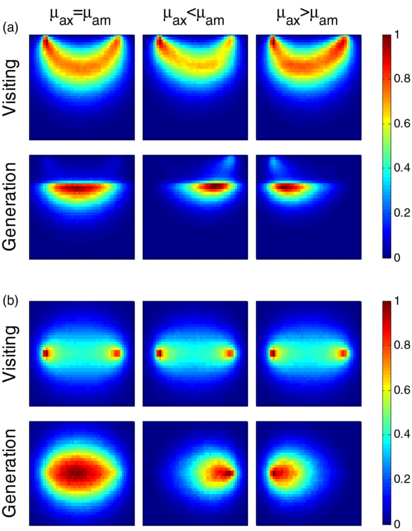
Figure 4. The same as in figure 3 but for µafx,LOW = 0.01 cm−1, µafx,UP = 0.001 cm−1.
Download figure:
Standard image High-resolution imageIt can be observed in figure 3 that the spatial distributions of the visiting and the generation probabilities are similar to those discussed above for a homogeneous medium (presented in figure 2). However, the probability of the generation of the fluorescence photons in the lower layer is significantly reduced because of the low absorption coefficient of the dye at the excitation wavelength in this layer µafx,LOW. Due to the increase in µafx in the upper layer compared to figure 2, for equal µax and µam the location of the high generation probability is moved toward the source position (left column in figure 3) which results from the same effects which were explained above for homogeneous case. Slight distortions in the shapes of 'bananas' in the visiting probability for cases of different µax and µam (middle and right column in figure 3) can be observed. These distortions are more clear for the case when the dye concentration is higher in the lower layer of the model (see middle and right column in figure 4(a)). Moreover, in this case the maxima of the generation probability are moved toward the lower layer of the model. Similarly to the homogeneous case, the location of the maxima depends on the ratio of the absorption coefficients of the medium at the excitation and emission wavelengths.
The location of the volume of the medium in which the generation probability is high was studied in detail in the case of high absorption of the dye at excitation wavelength for different source–detector separations (see figure 5). It can be noted that for short source–detector separation the volume of the high generation probability is located in the lower layer only when µax = µam (left column in figure 5). When one of the medium absorption coefficients is increased, the volume of the high generation probability moves toward the upper layer of the model (middle and right column in figure 5). With increase of the interoptode distance the volume of the high generation probability moves toward the lower layer for all three combinations of the absorption coefficients of the medium.
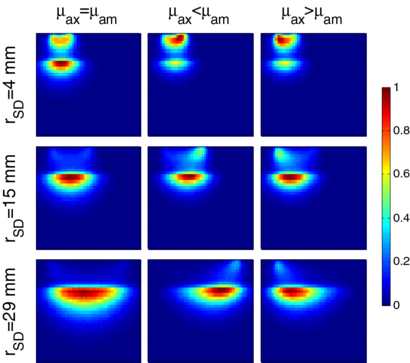
Figure 5. Spatial distributions of the generation probability at source–detector separations rSD 4, 15, 29 mm for the two-layered model with optical properties µafx,LOW = 0.01 cm−1, µafx,UP = 0.001 cm−1 and different relations between absorption coefficient of the medium for excitation and emission wavelengths. Simulations carried out for µ'sx = µ'sm = 10 cm−1, µafm = 0.001 cm−1 and µax = 0.1 cm−1, µam = 0.1 cm−1 (left column), µax = 0.1 cm−1, µam = 0.2 cm−1 (middle column) and µax = 0.2 cm−1, µam = 0.1 cm−1 (right column). Presented spatial distributions of the generation probability are related to continuous wave measurement and were obtained by summing up the distributions obtained for different times of arrival t.
Download figure:
Standard image High-resolution image3.3. Simulation of bolus dynamics
By simulating dynamic changes the dye-related absorption coefficients in both layers, the inflow and washout of a bolus of an optical contrast agent in the intra- and extracerebral tissues can be modeled. In next series of Monte Carlo calculations an inflow of the dye to the two layers of the model was simulated. Changes in absorption coefficient µafx of the dye at excitation wavelength in the upper and lower layers of the medium were corresponding to the inflow of the dye to the intra- and extracerebral tissues in typical in-vivo experiment. The dye inflow was simulated using the algorithm proposed by Leung et al (2007). In addition, it was assumed that before the inflow of the bolus a small amount of the dye was distributed homogeneously in both layers of the model. The time courses of the changes in absorption coefficient of the dye at excitation wavelength µafx are presented in figure 6(a). They were also used in our previous study (Milej et al 2012).

Figure 6. Changes in the statistical moments of the DTAs  and corresponding spatial distributions of the generation probability obtained for the two-layered medium with dynamic changes in absorption coefficient of the dye at excitation wavelength in upper and lower layers of the model µafx,UP and µafx,LOW. The time courses of the µafx,UP (circles) and µafx,LOW (squares) are presented in panel (a). The time courses of statistical moments of the DTAs presented in panels (b), (c) and (d) correspond to different ratios of absorption coefficient of the medium at excitation and emission wavelengths: (b) µax = 0.1 cm−1, µam = 0.1 cm−1, (c) µax = 0.1 cm−1, µam = 0.2 cm−1, (d) µax = 0.2 cm−1, µam = 0.1 cm−1. The distributions of the generation probability were obtained for seven instants (T1–T7) in time courses of changes in µafx marked in panel (a). Presented spatial distributions of the generation probability are related to continuous wave measurement and were obtained by summing up the distributions obtained for different times of arrival t.
Download figure:
Standard image High-resolution imageIn the analysis of the distributions of the generation probability, seven different instances (T1–T7) in the course (time scale T, seconds to minutes) of the change in the concentration of the fluorophore were considered. The values of the absorption coefficient of the dye at excitation wavelength µafx in the upper and lower layer of the model corresponding to these instances were used to create the 2D maps. The time courses of the statistical moments of the DTAs and the distributions of the generation probability presented in figure 6, panels (b), (c) and (d) correspond to different ratios of absorption coefficients of the medium at excitation and emission wavelengths.
It should be noted that the optical properties of the medium at excitation and emission wavelengths have a serious influence on the temporal variation of the distribution of the generation probability. Differences in time courses of statistical moments of the DTAs can be also observed. As it is shown in figure 6(b), in the case when the absorption coefficients at excitation and emission wavelengths are the same, the distributions of the generation probability form a 'banana' shape. During the increase of the dye absorption, it tends to cover the lower layer of the model. During the dye washout phase, the distribution returns to the 'banana' shape. This pattern of changes corresponds well to the distribution of the generation probability presented in figure 2. Furthermore, if the patterns of changes observed for cases in which µam is larger than µax (figure 6(c)) or vice versa (figure 6(d)) in the initial phase, a volume of the high generation probability is formed in the upper layer close to the source or to the detector, respectively. During the dye absorption increase in the lower layer, the volume of the high generation probability moves into the lower layer. Finally, the distributions return to the pattern observed in the initial phase when the volume of the medium in which the generation probability is high is located in the upper layer of the model. These patterns of changes in the distributions of the generation probability correspond well to the data presented previously in figures 3 and 4.
Analysis of changes in moments of the DTAs presented in figure 6 shows that:
- (1)an increase in the total fluorescence photons count is observed and the patterns of these increases are similar for all considered combinations of µax and µam.
- (2)When the absorption coefficients of the medium at both wavelengths are equal (panel b), an increase in the mean time of arrival of the fluorescence photons can be expected with later decrease and return to the initial value. This pattern of changes in the mean time of arrival of fluorescence photons was previously reported in in-vivo experiments carried out during inflow and washout of ICG (Liebert et al 2006).
- (3)In the case of high µam (panel c), a much smaller amplitude of increase in the mean time of arrival of the fluorescence photons can be observed. Such small amplitudes of increase were also registered during previous in-vivo studies (Milej et al 2012).
- (4)In the third case (µam < µax) (panel (d)), the increase in the mean time of arrival has a large amplitude and the subsequent decrease of the signal below the initial level has a comparably small amplitude.
- (5)The observed changes in the variance of the DTAs seem to be specific: a clear increase when µam = µax, a drop for µam > µax, and a bi-phasic change in the case of µam < µax.
3.4. Temporal evolution on the nanosecond time scale
In order to validate potential advantages of the time-resolved detection of fluorescence during inflow and washout of the dye in two tissue layers a time-resolved analysis of changes in the spatial distribution of the generation probability was carried out. In a first step a homogeneous medium was considered (see figure 7). The simulations were performed for nine different values of absorption coefficient at the excitation wavelength µax and constant absorption coefficient of the medium at the emission wavelength µafm. Distributions of the generation probability are presented for different times of arrival of the fluorescence photons on nanosecond time scale. It can be observed, that for the homogeneous medium the changes in the ratio of the absorption coefficients of the medium at the excitation and emission wavelengths lead to significant differences in the spatial distribution of the generation probability.
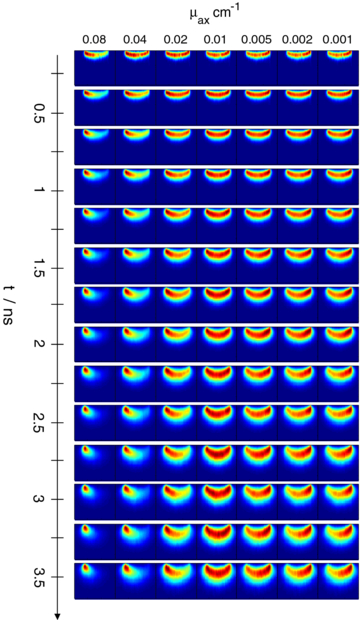
Figure 7. Evolution (on the ns time scale) of the spatial distributions of the generation probability obtained for a homogeneous medium and for different absorption coefficients of the medium at the excitation wavelength. The distributions are presented for different time windows of the DTA of fluorescence photons. Simulations were carried out for µam = 0.01 cm−1, µ'sx = µ'sm = 10 cm−1, µafm = 0.001 cm−1 and µafx = 0.001 cm−1.
Download figure:
Standard image High-resolution imageFor µax = µam (center column) the distributions form a 'banana' shape whereas for high µax the volume of the high generation probability moves toward the source position and in opposite, this volume moves toward the detector when µax is low. These effects are more pronounced for longer times of arrival of the fluorescence photons and are hardly visible for short times.
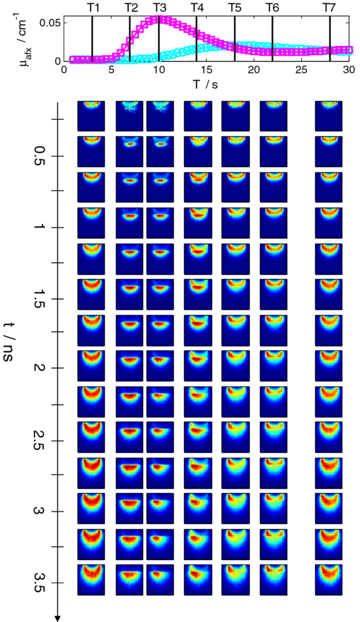
Finally, the time-resolved analysis was also applied for changes in the absorption coefficient of the dye at the excitation wavelength during the course of the inflow and washout of the dye in the intra- and extracerebral tissue compartments. The results are presented in figure 8.
Figure 8. Evolution (on the ns time scale t) of the spatial distributions of the generation probability for a two-layered medium with changes in absorption coefficient of the dye at the excitation wavelength µafx, which mimics the inflow of the dye into the intra- and extracerebral tissue layers. Simulations were carried out for µax = 0.1 cm−1, µam = 0.1 cm−1, µ'sx = µ'sm = 10 cm−1, µafm = 0.001 cm−1. The values of µafx in the upper and lower layers of the model were adapted from the seven instances (T1–T7) in courses of change in µafx(T) presented in figure 6(a).
Download figure:
Standard image High-resolution image
As it was presented previously, in the time-integrated DTAs shown in figure 6(b) (which were obtained for similar combinations of µax and µam), the distributions of the generation probability initially form the banana shape which can be observed also in the phase of the washout of the dye. In the phase of the increase of the µafx in the lower layer of the model the volume of the high generation probability moves toward this layer of the model. When the late times of arrival of the fluorescence photons (t) are analyzed the high generation probability located in the lower layer of the model can be observed for longer period of time (T) after the dye bolus. Moreover, the photons reemitted in the early time windows have low probability of being converted from excitation to the emission wavelength in the lower layer of the model (i.e. see upper row in figure 8). Comparison of the distributions of the generation probability obtained for late time windows (i.e. lower row in figure 8) with the integrals presented in figure 6(b) suggests that the photons reemitted from the tissue at longer times of arrival are with higher probability converted from excitation to emission wavelength in the lower layer of the medium.
4. Conclusions
We simulated effects related to the excitation, propagation and reemission of fluorescence photons in an optically turbid two-layered medium using an efficient Monte Carlo algorithm. The phenomena occurring during the inflow and washout of ICG into the intra- and extracerebral tissue layers were simulated and analyzed using this two-layered model. Results of the simulations may allow for an improved interpretation of fluorescence signals monitored on the surface of the head during an intravenous injection of ICG (Liebert et al 2006, Steinbrink et al 2008, Milej et al 2012) and may lead to understanding of differences in fluorescence signals measured in healthy subjects and patients (Weigl et al 2014).
First, it was confirmed that the volume of the high generation probability is located in the lower layer when the absorption of the dye in the lower layer is high (Liebert et al 2008). As reported before, this effect explains an increase in the mean time of arrival of the fluorescence photons (Liebert et al 2006, Steinbrink et al 2008). Second, it was presented that the lateral location of the volume in which the generation probability is high depends on the relation between the absorption properties of the medium at the excitation and emission wavelengths. It should be stressed that this effect is related to the absorption spectral properties of the medium itself and not of the properties of the ICG. Especially, the spectral properties of the most important chromophores contained in the tissue (like hemoglobin, lipids and water) in the wavelength range between 760 and 870 nm may contribute significantly to the effects observed in our studies.
It was observed that the volume of the high generation probability is located close to the source when the absorption of the medium at the excitation wavelength is high. On the other hand, it moves toward the detector position when the absorption of the medium at the emission wavelength increases. These effects were noted for the homogeneous medium as well as for the two-layered case. It was also noted that the location in which the generation probability is high moves toward the lower layer when the interoptode distance increases.
The above mentioned effects were observed when analyzing all photons exiting the medium regardless of the time of their reemission in respect to the pulse of the excitation light. This analysis is related to fluorescence CW signals measured on the surface of the medium. In the more detailed time-resolved analysis of the distributions of the generation probability we noted that the photons reemitted from the medium in early and late time windows of the DTAs are generated in different locations in the medium. As expected, the photons reemitted in late time windows were generated with higher probability in the deeper compartments of the model. For the study of the bolus in the lower layer it may therefore be advantageous to focus on late photons.
Spatial distributions of the generation probability were also obtained for realistic time courses of the changes in the absorption coefficient of the dye at the excitation wavelength resulting from changes in the concentration of the dye during inflow and washout. It was shown that the temporal pattern of the spatial distributions of the generation probability depends distinctly on the relation between the absorption coefficient of the medium at the excitation and emission wavelengths. The time courses of the statistical moments of the DTAs are interrelated to these temporal patterns of the spatial distributions of the generation probability. Moreover, it was found that these patterns of changes in statistical moments obtained for defined combinations of absorption coefficients of the medium are similar to typical time courses of moments of DTAs measured during in-vivo experiments on healthy volunteers (Liebert et al 2006, Steinbrink et al 2008, Milej et al 2012). It was also found that the signal of variance of the DTAs reveals specific time courses related to the combinations of optical properties of the medium. This specificity can be useful in the development of advanced algorithms for the analysis of measured DTAs.
We conclude, that the analysis of the distributions of the generation probability may allow one to understand the fluorescence signals measured on the surface of the turbid medium. The spatial distributions of the generation probability are related to the spatial sensitivity of the fluorescence measurement. Thus, the analysis of the distributions of the generation probability allows to explain the relation between the results of the time-resolved fluorescence measurement carried out on the surface of the medium and the spatial distribution of the dye in the medium under investigation. In this context, it should be noted that the volume in which the generation probability is high may cover compartments of different vascular composition in the intra- or extracerebral tissues leading to differences in time courses of fluorescence signals. Particularly, in the measurements carried out on the head the influence of large vessels localized in the extracerebral tissue compartments should be considered (Kirilina et al 2012). Results of our study suggest that the absorption properties of the medium (at excitation and emission wavelengths) should be carefully considered in attempts to reconstruct signals related to in the inflow and washout of the ICG into the extra- and intracerebral tissue layers (Steinbrink et al 2008, Jelzow et al 2012, Elliott et al 2013). It should be considered to measure these properties in parallel to the fluorescence measurements. In addition, it may be important to take into account the reabsorption of fluorescence which significantly influences the sensitivity of the fluorescence measurement to the changes in concentration of the dye distributed in the deeper tissue structures (Gerega et al 2012).
Acknowledgments
The studies have received funding from EC Seventh Framework Programme under grant agreement no 201076—project nEUROPt 'Non-invasive imaging of brain function and disease by pulsed near infrared light'. This work has been also supported by the Polish National Science Centre under grant agreement 2011/03/N/ST7/02598 and scholarship from the European Social Fund, Human Capital Operational Programme for the execution of the project 'Support for bio tech med scientists in technology transfer' (UDA-POKL.08.02.01-14-041/09).