

Abstract
Detector-, field size- and machine-specific correction factors are required for precise dosimetry measurements in small and non-standard photon fields. In this work, Monte Carlo (MC) simulation techniques were used to calculate the  and
and  correction factors for a series of ionization chambers, a synthetic microDiamond and diode dosimeters, used for reference and/or output factor (OF) measurements in the Gamma Knife Perfexion photon fields. Calculations were performed for the solid water (SW) and ABS plastic phantoms, as well as for a water phantom of the same geometry. MC calculations for the
  correction factors in SW were compared against corresponding experimental results for a subset of ionization chambers and diode detectors. Reference experimental OF data were obtained through the weighted average of corresponding measurements using TLDs, EBT-2 films and alanine pellets.
  values close to unity (within 1%) were calculated for most of ionization chambers in water. Greater corrections of up to 6.0% were observed for chambers with relatively large air-cavity dimensions and steel central electrode. A phantom correction of 1.006 and 1.024 (breaking down to 1.014 from the ABS sphere and 1.010 from the accompanying ABS phantom adapter) were calculated for the SW and ABS phantoms, respectively, adding up to
  corrections in water. Both measurements and MC calculations for the diode and microDiamond detectors resulted in lower than unit
  correction factors, due to their denser sensitive volume and encapsulation materials. In comparison, higher than unit
  results for the ionization chambers suggested field size depended dose underestimations (being significant for the 4 mm field), with magnitude depending on the combination of contradicting phenomena associated with volume averaging and electron fluence perturbations. Finally, the presence of 0.5 mm air-gap between the diodes' frontal surface and their phantom-inserts may considerably influence OF measurements, reaching 4.6% for the Razor diode.
Export citation and abstract BibTeX RIS
1. Introduction
Increased uncertainties in dosimetry measurements of small photon fields have been reported in a considerable body of literature and summarized in IPEM report 103 (Aspradakis et al 2010). These uncertainties affect both reference and relative dosimetry results and are mainly caused by a number of factors including the lack of lateral electron equilibrium on beam axis, the partial occlusion of the primary photon source, the perturbation of the electron fluence induced by the presence of non-water equivalent dosimeters and volume averaging effects. The International Atomic Energy Agency (IAEA) has provided a framework of an international approach to deal with the above issues and in cooperation with the American Association of Physicists in Medicine (AAPM) suggested a new formalism for dosimetry measurements in small and non-standard fields (Alfonso et al 2008). The suggested formalism was presented as an extension of currently used codes of practice (CoP) (e.g. TRS-398 (Andreo et al 2000), TG-51 (Almond et al 1999)), introducing a machine specific correction factor for reference dosimetry in treatment units where the conventional reference field cannot be established.
For relative output factor (OF) measurements, a corresponding correction factor was introduced to correct the experimentally determined detector-reading ratios, which—although being commonly used to estimate broad beam OFs—could lead to erroneous results in small fields. Since the introduction of the aforementioned correction factors and pending publication of a new CoP for small field dosimetry measurements, several research groups have used Monte Carlo (MC) and/or experimental (or semi-empirical based) techniques to obtain correction factors for the clinically available irradiation units, detectors and small field sizes (Pantelis et al 2010, 2012, Cranmer-Sargison et al 2011, De Ost et al 2011, Gago-Arias et al 2012, 2013, Francescon et al 2012, 2014a, 2014b, 2017, Charles et al 2013, Czarnecki and Zink 2013, Azangwe et al 2014, Benmakhlouf et al 2014, 2015, Papaconstadopoulos et al 2014, Morales et al 2014, Russo et al 2016, Lárraga-Gutiérrez et al 2015, Underwood et al 2015, Andreo et al 2016, Liu et al 2016, Mancosu et al 2015, Park et al 2016).
The Leksell Gamma Knife® (GK) (Elekta Instrument AB, Stockholm, Sweden) is a radiosurgery system for the treatment of intracranial lesions. In the latest GK models (ICON™ and Perfexion™ (PFX)), the treatment delivery system has been entirely redesigned. Compared to previous models, where all (201) 60Co sources were fixed on a truncated hemispherical surface exhibiting a constant source to focus distance of 400 mm (Somigliana et al 1999), in ICON and PFX, a total of 192 60Co sources are equally distributed over 8 sectors in a cylindrical configuration consisting of 5 rings exhibiting source to focus distances varying from 374 to 433 mm (Lindquist and Paddick 2007, Novotny et al 2009). Each sector can be moved independently along a conical surface to facilitate alignment of the sources with any of the three available collimation channels, labeled as 4 mm, 8 mm and 16 mm. Reference dosimetry measurements are performed in the larger available field of 16 mm diameter, while relative dosimetry data, including small field OFs and dose profiles, are pre-stored in the treatment planning system (GammaPlan™) and need only to be verified by the user. Both reference and relative dosimetry measurements are performed using either the standard Acrylonitrile Butadiene Styrene (ABS) (Novotny et al 2010) or the Leksell® GK Solid Water (SW) (McDonald et al 2011) 160 mm diameter spherical phantoms.
Being at the edge of what is considered 'small' (Li et al 1995, Das et al 2008), GK radiation fields pose a great challenge to medical physicists in regard to predicting their dosimetric properties (Mack et al 2002, Ma et al 2009, Moutsatsos et al 2009, Novotny et al 2009). Correction factors for relative dosimetry measurements in the GK-PFX small fields have been published by Benmakhlouf et al (2015). Using MC simulations, the authors showed that, among the five detectors studied, the output correction factors,  for the PTW 31018 Liquid Ionization Chamber (LIC) (PTW, Freiburg, Germany) and the SW phantom are equal to unity within ±0.4%. In view of that, the authors used the LIC to obtain reference OF data and experimentally determined output correction factors for a series of ionization chambers, diodes and diamond detectors.
In this work, a comprehensive MC model of the GK-PFX system validated in a previous work (Pappas et al 2016) was used to calculate reference and relative dosimetry correction factors for an extended range of dosimeters, compared to Benmakhlouf et al (2015). Moreover, the impact of plastic phantom materials, such as ABS and SW commonly used in GK clinical practice, on both reference and relative dosimetry correction factors was evaluated through corresponding MC calculations. Finally, MC simulations were employed to validate and enhance output correction experimental dosimetry results, initially presented by our group (Moutsatsos et al 2013). Apart from refining reference OF data obtained by alanine pellets, radiochromic films and TLDs, MC simulations were used to resolve and assess experimental dosimetry uncertainties owing to small air gaps between the detectors and the custom made phantom inserts used (Charles et al 2013, Barrett and Knill 2016, Underwood et al 2013).
2. Materials and methods
2.1. Small field dosimetry corrections factors
In GK-PFX units, reference dosimetry is conducted in the largest available field size of 16 mm nominal diameter, which comprises the machine specific reference (msr) field ( ) defined in the Alfonso et al (2008) formalism. Measurements are performed using ABS or SW plastic phantoms (McDonald et al 2011). Appropriate inserts are also used to position the reference point of an ionization chamber at the center of the phantoms which is situated at the Radiological Focus Point (RFP) (i.e. the point where the central axes of all 60Co sources intersect). Applying the formalism suggested by Alfonso et al (2008), calculation of the absorbed dose to water,
  at the reference point of
  , requires the multiplication of the measured dose with the
  correction factor. The latter is introduced to account for differences in detector's response in the calibration reference field (
 = 100 × 100 mm2) having a beam quality
  relative to the
  with beam quality
  , and is defined as:

where,  and
and  are the doses to water in water at
  with beam quality
  and at
  with beam quality
  , respectively.
  refers to the dose to detector's sensitive volume in water, while
  is the dose to detector in SW or ABS plastic phantoms. Besides detector, beam quality and machine specific,
  depends on the phantom used to conduct reference dosimetry measurements. To quantify the effect of the different radiological properties of SW or ABS, a phantom correction factor,
  , can be defined as the ratio of the absorbed dose in a small water cavity situated at the center of water and plastic phantom with the same radius irradiated with the msr field.
The absorbed dose to water  at the RFP of a clinical field,
  , with beam quality,
  , is related to the corresponding dose in the
  via the output factor
  which is defined as:

Since, the output factor can be measured by dividing the readings of the detector per unit time (i.e.  ) when irradiated in the
  and in
  fields, a corresponding correction factor,
  , has been also defined by Alfonso et al (2008) to account for differences in detector response in
  and
and  , and is given by:

For the GK-PFX unit,  applies for the fields formed by the 4 and 8 mm collimator sizes. Besides detector, field size, beam quality and machine specific the output correction factor,
  depends also on the used phantom material. The
  was be calculated in this work using both MC and experimental measurements.
Using MC simulations  was calculated according to:

where the absorbed doses to the detector sensitive volume per photon,  and
and  , in the phantom material m at the
  and
and  , respectively, were assumed proportional to the corresponding detector readings.
Using measurements, the  was determined by:

In the common case of  measurements in a phantom material, m, different from water (such as the SW used in this work), an appropriate phantom correction factor,
  , accounting for absorbed dose to water differences in the phantom material m,
  , and water,
  , is included to the
  correction factor. This correction factor can be separately defined as the ratio of the ratios of the absorbed dose in a small water cavity situated at the center of water phantom per the absorbed dose in a small water cavity in plastic phantom irradiated in the clinical field per the same ratio irradiated in msr field. All four quantities can be calculated by MC simulations.
2.2. Detectors studied
Small field dosimetry correction factors were obtained for TLD microcubes and alanine dosimeters, as well as for six real time solid-state dosimeters and thirteen ionization chambers (see table 1). Specifically, one shielded (PTW 60016), and four unshielded (PTW 60017, PTW 60018 and IBA Razor, IBA SFD) diode detectors were included in this study. The PTW 60019 synthetic microDiamond detector that has been reported to exhibit suitable dosimetric properties for small field relative dosimetry measurements (Morales et al 2014) was also studied. Regarding ionization chambers, an extended range of air-filled chambers were studied including: (a) the PTW 31014, 31015, 31016 and 31010 chambers with aluminum electrode and active volumes ranging from of 0.015 to 0.125 cm3, (b) the IBA Razor, Razor nano, CC01, CC04 and CC13 chambers with Graphite, Steel and C552 materials in their central electrode and active volumes ranging from 0.003 to 0.13 cm3 and (c) the Exradin A16, A26, A14SL and A1SL ionization chambers with C552 and Steel materials in their central electrodes and active volumes ranging from 0.007 to 0.053 cm3.
Table 1. Characteristics and properties of the detectors included in this study.
| Detector type | Sensitive volume dimensions (in mm unless otherwise stated) | Active material |
Density (g cm−3) | Type of calculation |
|---|---|---|---|---|
| TLD microcubes | 1 × 1 × 1 mm3 | LiF:Mg,Ti | 2.635 | EO,MO,MR |
| Alanine pellets | Height 2.5, Ø5.0 | Alanine | 1.424 | EO,MO,MR |
| EBT2 films | Thickness 0.028 | EO,MR | ||
| PTW 60016 | Thickness 0.03, Ø1.2 | Silicone | 2.33 | EO,MO |
| PTW 60017 | Thickness 0.03, Ø1.2 | Silicone | 2.33 | EO,MO |
| PTW 60018 | Thickness 0.25, Ø1.2 | Silicone | 2.33 | MO |
| PTW 60019 | Thickness 0.001, Ø2.2 | Diamond | 3.53 | MO |
| IBA SFD | Thickness 0.06, Ø0.6 | Silicone | 2.33 | EO,MO |
| IBA Razor | Thickness 0.02, Ø0.6 | Silicone | 2.33 | EO,MO |
| PTW 31010 | Length 6.5, Ø5.5 volume 0.125 cm3 | PMMA/graphite—aluminum | 1.19/0.82–2.6989 | MR |
| PTW 31014 | Length 5.0, Ø2.0 volume 0.015 cm3 | PMMA/graphite–aluminum | 1.19/1.85–2.6989 | EO,MO |
| PTW 31015 | Length 5.0, Ø2.9 volume 0.03 cm3 | PMMA/graphite–aluminum | 1.19/1.85–2.6989 | MO |
| PTW 31016 | Length 2.9, Ø2.9 volume 0.016 cm3 | PMMA/graphite–aluminum | 1.19/1.85–2.6989 | MR,MO |
| IBA Razor nano chamber (CC003-S) | Length 1.3, Ø2.0 volume 0.003 cm3 | C552–graphite | 1.76–1.81 | MO |
| IBA CC01 | Length 3.6, Ø2.0 volume 0.01 cm3 | C552–steel | 1.76–8.15 | EO,MO,MR |
| IBA Razor chamber (CC01-G) | Length 3.6, Ø2.0 volume 0.01 cm3 | C552–graphite | 1.76–1.81 | MR,MO |
| IBA CC04 | Length 3.6, Ø4.0 volume 0.04 cm3 | C552–C552 | 1.76 | MR,MO |
| IBA CC13 | Length 5.8, Ø6.0 volume 0.13 cm3 | C552–C552 | 1.76 | MR |
| Exradin A26 | Length 2.9, Ø3.3 volume 0.015 cm3 | C552–C552 | 1.76 | MO |
| Exradin A16 | Length 2.3, Ø2.4 volume 0.007 cm3 | C552–silver plated, copper covered steel | 1.76–10.5/8.96/7.85 | MR,MO |
| Exradin A14SL | Length 2.5, Ø4.0 volume 0.015 cm3 | C552–silver plated, copper covered steel | 1.76–10.5/8.96/7.85 | MR,MO |
| Exradin A1SL | Length 5.7, Ø4.0 volume 0.053 cm3 | C552–C552 | 1.76 | MR |
aRefers to passive and solid state detectors. bRefers to ionization chambers. cType of calculation for each detector. MR: Monte Carlo calculated correction factor for reference dosimetry, MO: Monte Carlo calculated output correction factor, EO: Experimentally determined output correction factor.
2.3. Monte Carlo simulations
MC simulations for the GK-PFX unit were performed using the detailed model recently published by our group (Pappas et al 2016). The MC model was developed on the grounds of geometrical and constructional details provided by the GK vendor using the C++ based geometry package of the EGSnrc V4 2.4.0 system (Kawrakow 2000, Kawrakow et al 2013). In more detail, the exact position and orientation of all 192 60Co sources was taken into account and described in a single EGSnrc input file per collimator size (see figure 1). Photons of 1.1732 MeV and 1.3325 MeV were homogeneously generated within the source with equal emission probability. Directional distribution of the emitted photons was assumed isotropic as directional biasing was shown to significantly affect OF calculations (Pappas et al 2016).
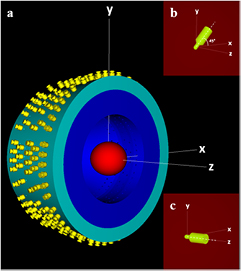
Figure 1. (a) A graphic illustration of the comprehensive GK-PFX simulation model geometry. Each detector was simulated inside the plastic spherical phantom (red) with its central axis aligned (b) on the xy plane exhibiting a tilt of 45° relative to the x-axis of the Leksell stereotactic space for ABS phantom and (c) to the z-axis for the SW phantom.
Download figure:
Standard image High-resolution imageIn order to obtain  and
and  for both ABS and SW phantom materials (see equations (1) and (4), respectively), two separate studies were performed both assuming 160 mm homogeneous spheres centered at the RFP but with slightly different physical densities (nominal densities of ρsw = 1.043 g cm−3 (McDonald et al 2011), ρABS = 1.05 g cm−3 (Harper 1996)). The adapter used to hold the SW phantom in irradiation position was not included in the simulations since it does not interfere with radiation beams. In contrast, the corresponding adaptor used to hold the ABS phantom has been reported to partially attenuate the beams of two sectors of the 16 mm collimator, thus affecting dosimetry results (Bhatnagar et al 2009). Therefore, the adapter of the ABS phantom was modeled in the MC simulations based on vendor blueprints (Elekta). For the SW phantom, each detector was simulated with its central axis aligned to the z-axis (superior–inferior direction) of the Leksell stereotactic space and the reference point of measurement coinciding with the RFP (see figure 1). For the ABS phantom, detectors were simulated with their central axis residing on the xy plane exhibiting a tilt of 45° relative to the x-axis (right–left direction) (see figure 1), since this configuration is commonly applied in GK dosimetry (Novotny et al 2010). To obtain
  and
and  (see equations (1) and (2), respectively), calculations were also performed for a spherical water phantom of the same size. In specific, the average dose deposited in spherical water volumes of 0.25 mm, 0.5 mm and 1 mm radii were scored for the 4 mm, 8 mm and 16 mm collimators, respectively. The selected scoring volumes were adequately small to avoid volume averaging effects (Pappas et al 2016) but varied for each collimator size in order to increase simulation efficiency (Pipek et al 2014). In contrast to our previous work, zero volume extrapolation was not performed (Pappas et al 2016).
Small field correction factors were calculated for the extensive series of ionization chamber and solid-state detectors presented in table 1. All dosimeters were modeled based on blueprints provided by the vendors and coded using the C++ geometry package of the EGSnrc system. All involved materials were simulated using the PEGS4 code, part of the EGSnrcMP system (Kawrakow et al 2006, 2013) with density effects taken into account with corresponding parameters adopted from NIST (Berger et al 2005). Specifically, for the epoxy resin a physical density of 1.4 g cm−3 was assumed for all diode detectors (Francescon et al 2012). The XCOM photon cross section library was used for the MC simulations (Berger and Hubbell 1987).
The egs_chamber user code (Wulff et al 2008) was employed in all MC calculations performed. Total electron energy cut-off threshold (ECUT) was set equal to 521 keV within a sphere of 35 mm radius inside the phantom, centered at the RFP. In order to increase efficiency, outside this sphere ECUT was set to 811 keV, with no considerable dosimetric effect (Pappas et al 2016). The photon energy cut-off threshold (PCUT) was set to 1 keV. The default values were used for the remaining EGSnrc transport parameters and cross-sectional options (i.e. PRESTA-II electron transport algorithm, EXACT boundary cross algorithm, ESTEPE equal to 0.25). Intermediate phase space scoring (IPSS) and photon cross section enhancement (XCSE) variance reduction techniques were employed in order to increase time efficiency. In more detail, the IPSS technique was used in every simulation run to temporarily store the phase space of all particles entering the surface of a sphere of 25 mm radius centered at the RFP. Dose scoring to each detector sensitive volume as well as to a small volume of water were performed in the same run per collimator size using the same phase space in order to obtain maximum correlation between the calculated dose results. In addition, an XCSE enhancement factor of 512 was applied to all geometry regions located within a sphere of 17.5 mm radius centered at the RFP. This volume is adequately large to encompass all dose scoring regions as well as a shell of at least 10 mm thick surrounding the outermost scoring volume (Wulff et al 2008).
Regarding correction factors for reference dosimetry, additional MC runs had to be performed to calculate  and
and  as defined in equation (1). In specific, the detectors listed in table 1 for reference dosimetry were positioned at a depth of 50 mm inside a water phantom of 300 × 300 × 300 mm3 and irradiated by a reference 100 × 100 mm2 60Co beam defined at 100 cm source to detector distance (SDD) (Andreo et al 2000). The reference beam was created by a 60Co point source emitting a photon spectrum taken from Mora et al (1999).
  was calculated using a spherical dose scoring volume of 1 mm diameter in water. PCUT was set equal to 1 keV for the entire geometry, while ECUT was set equal to 521 keV within a sphere of 40 mm radius centered at the depth of 50 mm inside the water phantom and 811 keV for the rest of geometry. Moreover, the IPSS technique was used at the surface of a sphere of 40 mm radius, as well as an XCSE enhancement factor of 512 was applied within a sphere of 25 mm radius, both centered at the depth of 50 mm inside the water phantom.
All MC calculations were performed by a super-computer consisting of 426 computational nodes with ten Ivy Bridge Intel® Xeon® E5 v2 processors per node, which offered a total of 8520 CPU cores (computational threads) clocked at 2.8 GHz.
The number of initial particle histories per simulation session varied in order to achieve statistical (Type A) uncertainties of up to 0.33% in the determination of  and
and  correction factors for the ionization chambers and passive dosimeters. Corresponding uncertainties for the microDiamond and diode detectors were up to 0.42% except for the IBA Razor and SFD diodes where uncertainties reached 0.69%. Systematic (non-statistical, Type B) uncertainties in MC calculations were estimated by adopting relevant data published in the literature. In specific, a systematic uncertainty of 0.4% on
  calculations related to detector modelling and cross sections was adopted (Muir et al 2011). Regarding
  MC calculations, an uncertainty of 0.4% related to cross sections (Wulff et al 2010) and of 0.48% associated with geometry variations (i.e. detectors' sensitive volume, wall thickness and wall density) (Francescon et al 2011) were used.
2.4. Measurements
Experimental dosimetry was conducted independently of MC simulations to contribute to the determination of output correction factors,  , for a set of two air-filled microchambers and five diode detectors using the formalism presented in equation (5). Measurements were performed in the Leksell Gamma Knife SW phantom (see figure 2) with the aid of custom made inserts made of PTW-RW3 (ρ = 1.045 g cm−3) (Tello et al 1995) to facilitate alignment of each detector's effective point with the RFP, as described in the following subsections.

Figure 2. (a) and (b) Elekta SW plastic phantom with custom made inserts for detectors (ionization chambers, dosimetry diodes, TLDs and alanine pellets), (c) Elekta SW slabs for film measurements and (d) experimental setup at the Leksell GK-PFX irradiation unit.
Download figure:
Standard image High-resolution imageDue to the finite mechanical accuracy practically achieved in the construction of phantom inserts, small air gaps between detectors and their inserts were inevitable. Separate MC simulations performed to resolve their dosimetric impact showed that air gaps, of the order of 0.1 mm, perpendicular to the longitudinal axis of detectors (i.e. in the xy-plane of PFX unit) induce no dosimetric effects. On the contrary, the presence of small air cavities between the insert and the frontal surface of each detector may induce a considerable dosimetric effect, which was evaluated by performing a series of MC simulations assuming cavity width ranging from 0 mm to 1 mm.
For the experimental determination of  , reference
  data must be obtained using dosimeters with minimal or well-known
  correction factors (Alfonso et al 2008). Besides real-time dosimeters such as liquid ionization chambers (Benmakhlouf et al 2015) or plastic scitntillators (Morin et al 2013), passive dosimeters such as TLD microcubes (Pantelis et al 2012, Bassinet et al 2013), alanine pellets (Pantelis et al 2012, Azangwe et al 2014), radiochromic films (Pantelis et al 2012, Bassinet et al 2013, Morales et al 2016) and polymer gels (Pantelis et al 2012) have been used to obtain reference
  data. In this work, reference
  for both clinical fields were obtained by the weighted average of corresponding alanine, TLD and EBT-2 radiochromic film dosimetry results.
2.4.1. Ionization chamber and diode detectors.
The IBA CC01 and the PTW 31014 PinPoint ionization chambers as well as the IBA Razor, IBA SFD and the PTW 60017, PTW 60016, diode detectors were used. For detectors of identical outer diameters (i.e. the IBA Razor and SFD, as well as PTW 60017 and 60016 diodes) a single insert was constructed and used for irradiations. In more detail, the insert for the IBA diodes was tailored to the geometric characteristics of the Razor diode introducing, therefore, an offset of 0.1 mm along the GK z-axis when used with the SFD diode. Similarly, PTW diode insert was tailored to the 60012 and 60016 models resulting in an offset of 1.4 mm along z-axis when used with the 60017 and 60008 models. These small offsets had no dosimetric impact since, accurate alignment between each detector's effective point and the RFP was assured by localizing the point of maximum reading (in the Stereotactic Coordinate System) in multiple profile measurements in all three axes, with a step of 0.1 mm, using the 4 mm collimator.
All ionization chambers and diode detectors were irradiated with their cable aligned with the z-axis of the GK system. For the PTW 31014 and IBA CC01 microchambers, measurements were performed with both positive and negative polarity (±400 V for the 31014 and ±300 V for the CC01) and averaged since a small polarity effect of less than 0.6% and 0.3%, respectively was observed. Charge was collected using a PTW UNIDOS electrometer. The temperature and pressure were monitored and found to be constant during the measurements. Five measurements were performed for each detector and averaged. The average reading of each detector was corrected for the small air gap effect obtained using separate MC simulations and a thickness of 0.5 mm which was deemed the best estimate for each detector-insert pair using mamo x-ray images.
2.4.2. TLD microcubes.
TLD-100 (Thermo Scientific, Oakwood Village, OH) microcubes of 1 mm in-size were irradiated in the GK small fields. The central SW phantom plate was substituted with an equally shaped and sized RW3 plate, in the center of which a cavity was drilled to fit an appropriate insert holding a TLD microcube (figure 2(a)). TLD dosimetry measurements were performed following the methodology presented in a previous work (Moutsatsos et al 2014). Briefly, prior to irradiation the TLDs were annealed for 1 h at 400 °C and 2 h at 105 °C separated by a rapid cooling down procedure to room temperature using a block of brass. After irradiation, TLDs were stored in room temperature for 24 h, annealed for 15 min at 105 °C and allowed to cool down before readout which was carried out using a VICTOREEN 2800 hot gas (Nitrogen) reader. A two-step heating protocol (10 s at 160 °C and 10 s at 300 °C) was applied twice to each dosimeter successively and the net light output integrated over the entire glow curve was assigned to its response. A time of 60 s was prescribed to the center of each TLD resulting to a calculated absorbed dose of 1.756 Gy, 1.941 Gy and 2.157 Gy for the 4 mm, 8 mm and 16 mm field, respectively. Five TLDs were used per field size. TLD readings were corrected for: (a) end-effects (Ekstrand and Bourland 2001) using end effect times of 0.006 min, 0.075 min and 0.009 min for the 4 mm, 8 mm and 16 mm collimator, respectively, and b) the effect of small air gap surrounding each microcube inside the cylindrical hole (of 1 mm height and 1.5 mm diameter) of the insert. Finally, the TLD corrected reading ratios were also multiplied by the corresponding  correction factors obtained in this study using Monte Carlo simulations.
2.4.3. Alanine pellets.
Alanine dosimetry was provided by National Physical Laboratory (NPL) using cylindrical pellets of 2.5 mm height and 5 mm diameter. The PTW-RW3 central slab used for the irradiation of the TLDs was also used for alanine measurements together with an appropriate insert to position each pellet at RFP (figure 2(a)). A dose of 10 Gy was prescribed to the center of each alanine pellet. After irradiation, the dosimeters were sent back to NPL and read-out using the intensity of the X-band electron paramagnetic resonance spectrum. Alanine dosimetry was based on the received data-sheet reporting the dose recorded by each dosimeter along with a comprehensive uncertainty analysis. Five alanine dosimeters were used per field size. The readings of each alanine pellet were corrected for the effect of a small air gap of 0.5 mm thick in front of each pellet as estimated using dummy pellets and mamo x-ray images. Finally, the alanine reading ratios were also corrected using  factors calculated by MC simulations of this work to account for the fluence perturbation and volume average effects.
2.4.4. Film dosimetry.
Gafchromic EBT-2 (Ashland Inc., Wayne, NJ) films were used. Precut film pieces of 110 × 75 mm2 size were placed between the central film-slabs of the SW phantom, in alignment with the central axial plane (xy plane) of the PFX coordinate system (figure 2(c)). Film measurements were performed following the methodology described in Pappas et al (2016) which utilizes the double exposure technique proposed by Ma et al (2009). A dose of 3 Gy was prescribed at the center of each field. Film scanning was performed one-day post irradiation and the acquired 48 bit RGB images with 150 dpi resolution were saved in TIFF format. The circular symmetry of GK radiation fields on axial planes was exploited to define the coordinates of the center of each delivered shot. Single channel (red) pixel values from pixels lying within a circle of appropriate diameter (0.5 mm, 1 mm and 5 mm for the 4 mm, 8 mm and 16 mm collimators, respectively), centered at the corresponding radiation field center, were averaged and used to calculate the optical density (OD) assigned to the center of each shot. The calibration curve of the EBT-2 batch was used to convert the measured OD to water dose in SW material. An appropriate P(fclin) correction factor was calculated and used to convert measured doses in SW to doses in water. Five estimations of the  for each GK clinical field were obtained from the corresponding dose ratios,
 , following the methodology proposed by Ma et al (2009).
2.4.5. Experimental uncertainties.
The total uncertainty assigned to each dosimetry system measurements was calculated following the recommendations of the Guide to the Expression of Uncertainty in Measurement (JCGM 2008). The type A (statistical) uncertainty component was estimated using error propagation on the standard deviation of the mean detector reading in each field size, while the type B (non-statistical) component was assessed, considering uncertainties associated with the calibration procedure, the air gap effect correction factor (when applied), the  correction factor and the setup of the effective point of measurement of each detector at RFP. For the ionization chambers and diode detectors the employed scanning technique resulted to a positioning uncertainty of ±0.1 mm. For the TLD and alanine dosimeters a scanning technique could not be used and, therefore, an increased positioning uncertainty of ±0.3 mm was assumed taking into account the geometrical accuracy of the used GK system (Heck et al 2007). For film measurements only a cross plane (i.e. along z axis) positioning uncertainty of ±0.3 mm was considered relying on the film's fine in-plane resolution. In addition, the employed double exposure technique for film measurements reduces the type B uncertainty component associated with the film calibration procedure to the uncertainty in defining the slope of the OD-dose(D) calibration curve at 3 Gy (Ma et al 2009). In view of the above, the total uncertainty assigned to reference
  measurements with TLDs, radiochromic films and alanine pellets was estimated equal to 2.3%, 3.9% and 1.4%, respectively, for the 4 mm field reducing to 2.1%, 3.3% and 0.8% for the 8 mm field.
3. Results
3.1. Reference dosimetry
The MC calculated reference dosimetry correction factors,  , are presented in table 2 and figure 3, for 9 ionization chambers, LiF TLD and alanine pellets in an increasing order with respect to detector active volume. Correction factor values are given for the SW and ABS plastic phantoms used in routine GK-PFX dosimetry, as well as for a water phantom of the same geometry and dimensions (i.e. 160 mm diameter sphere). Corresponding MC calculated results reported by Johansson et al (2012) for 7 ionization chambers are also presented in table 2 for reasons of comparison. Table 2 and figure 3 reveal that, except for the IBA CC01 chamber, smaller corrections are generally required in water and SW (i.e.
  values closer to unity were obtained), whilst larger corrections varying from 2% to 5.7% are required for reference dosimetry measurements using the ABS phantom. For the IBA CC01 ionization chamber,
  values of 1.043 for the SW and water phantoms and of 1.060 for the ABS phantoms, were found. Corrections below 1% (i.e. 0.99 <
  < 1.01) were obtained in SW and water phantoms for the PTW 31016, PTW 31010, IBA CC04, Exradin A1SL ionization chambers as well as alanine pellets.
Table 2. MC calculated  correction factors in SW, ABS and water phantoms for the GK-PFX irradiation unit. Corresponding combined total uncertainties at 68% level are shown in parentheses, indicating the uncertainty in the last digit. MC calculations by Johansson et al (2012) are also presented for comparison.
| Detectors | This study | Johansson et al (2012) | ||||
|---|---|---|---|---|---|---|
| SW | ABS | Water | SW | ABS | water | |
| TLD | 1.011 (4) | 1.023 (5) | 1.004 (4) | — | — | — |
| Exradin A16 | 1.023 (4) | 1.039 (5) | 1.018 (4) | 1.017 (2) | 1.030 (2) | 1.013 (2) |
| IBA CC01 | 1.043 (4) | 1.060 (5) | 1.043 (4) | 1.021 (2) | 1.029 (2) | 1.017 (2) |
| IBA Razor chamber (CC01-G) | 1.012 (4) | 1.028 (4) | 1.008 (4) | — | — | — |
| Exradin A14SL | 1.022 (4) | 1.026 (4) | 1.017 (4) | 1.015 (2) | 1.019 (2) | 1.012 (2) |
| PTW 31016 | 1.005 (4) | 1.023 (4) | 0.999 (4) | 1.004 (2) | 1.011 (2) | 0.999 (2) |
| IBA CC04 | 1.008 (4) | 1.021 (4) | 1.003 (4) | 1.011 (2) | 1.012 (2) | 1.006 (2) |
| Alanine | 1.007 (4) | 1.019 (4) | 1.000 (4) | — | — | — |
| Exradin A1SL | 1.008 (4) | 1.020 (4) | 1.004 (4) | 1.005 (2) | 1.014 (2) | 1.001 (2) |
| PTW 31010 | 1.008 (4) | 1.022 (4) | 1.004 (4) | 1.004 (2) | 1.015 (2) | 1.000 (2) |
| IBA CC13 | 1.012 (4) | 1.057 (4) | 1.009 (4) | — | — | — |

Figure 3. MC calculated  correction factors for 11 detectors in SW, ABS and water phantoms for the GK-PFX irradiation unit. Error bars correspond to the combined statistical uncertainties at 68% level.
Download figure:
Standard image High-resolution image3.2. Relative dosimetry
3.2.1. Monte Carlo simulations.
The MC calculated OFs,  , for the 4 mm and 8 mm clinical fields in water were found equal to 0.8245 ± 0.0017 and 0.8941 ± 0.0011, respectively. Calculated
  correction factors are presented in table 3 for 10 ionization chambers, 5 dosimetry diodes, 1 microDiamond detector, LiF TLD and alanine pellets. Similar to reference dosimetry,
  correction factors are presented for each dosimeter situated in a water, SW and ABS phantom.
Table 3. MC calculated  correction factors in SW, ABS and water phantoms for the GK-PFX irradiation unit. Corresponding combined total uncertainties at 68% level are shown in parentheses, indicating the uncertainty in the last digit.
| Detectors | 4 mm collimator | 8 mm collimator | ||||
|---|---|---|---|---|---|---|
| SW | ABS | water | SW | ABS | Water | |
| TLD | 0.983 (5) | 0.982 (5) | 0.983 (5) | 1.003 (5) | 0.993 (5) | 1.000 (5) |
| Alanine | 1.163 (6) | 1.187 (6) | 1.166 (6) | 1.010 (4) | 1.004 (4) | 1.010 (4) |
| PTW 60016 | 0.944 (7) | 0.960 (7) | 0.947 (7) | 0.976 (7) | 0.989 (7) | 0.979 (7) |
| PTW 60017 | 0.956 (7) | 0.958 (7) | 0.959 (7) | 0.995 (7) | 0.991 (7) | 0.997 (7) |
| PTW 60018 | 0.957 (7) | 0.955 (7) | 0.958 (7) | 0.999 (7) | 0.991 (7) | 0.998 (7) |
| PTW 60019 | 0.971 (7) | 0.967 (7) | 0.971 (7) | 1.000 (7) | 0.990 (7) | 0.999 (7) |
| IBA SFD | 0.969 (7) | 0.975 (8) | 0.970 (7) | 0.985 (7) | 0.988 (8) | 0.983 (7) |
| IBA Razor | 0.970 (7) | 0.974 (9) | 0.969 (7) | 0.985 (7) | 0.995 (9) | 0.984 (7) |
| PTW 31014 | 1.327 (8) | 1.230 (8) | 1.330 (8) | 1.028 (6) | 1.008 (6) | 1.028 (6) |
| PTW 31015 | 1.504 (9) | 1.414 (9) | 1.511 (9) | 1.049 (6) | 1.035 (6) | 1.049 (6) |
| PTW 31016 | 1.242 (7) | 1.235 (8) | 1.250 (7) | 1.023 (6) | 1.015 (6) | 1.023 (6) |
| IBA Razor nano chamber (CC003-S) | 1.015 (6) | 1.007 (7) | 1.017 (6) | 1.005 (6) | 0.997 (6) | 1.004 (6) |
| IBA CC01 | 1.125 (7) | 1.090 (7) | 1.126 (7) | 1.010 (6) | 1.001 (6) | 1.010 (6) |
| IBA Razor chamber (CC01-G) | 1.203 (7) | 1.143 (7) | 1.206 (7) | 1.011 (6) | 1.000 (6) | 1.009 (6) |
| IBA CC04 | 1.428 (9) | 1.419 (9) | 1.434 (9) | 1.025 (6) | 1.017 (6) | 1.026 (6) |
| Exradin A26 | 1.193 (7) | 1.178 (7) | 1.196 (7) | 1.011 (6) | 1.003 (6) | 1.010 (6) |
| Exradin A16 | 1.132 (7) | 1.118 (7) | 1.135 (7) | 1.011 (6) | 1.002 (6) | 1.011 (6) |
| Exradin A14SL | 1.356 (8) | 1.393 (8) | 1.358 (8) | 1.036 (6) | 1.035 (6) | 1.035 (6) |
MC simulation results for all ionization chambers and alanine pellets revealed underestimations for both clinical fields and all phantom materials. For ionization chambers in specific, output correction factors,  , for the 4 mm field were found to vary from 1.007 for the IBA Razor nano chamber (CC003-S) in ABS up to 1.511 for the PTW 31015 in water phantom. It is worth noting that except for the Exradin A14SL chamber, the rest of ionization chambers presented in table 3 are associated with smaller corrections in ABS compared to those for SW and water phantoms. Alanine pellets are also associated with greater
  values in the ABS phantom implying analogous corrections. For the 8 mm field, ionization chamber
  factors vary to a lesser degree with regard to corresponding variations in the 4 mm field, spanning from 0.997 for the IBA Razor nano chamber (CC003-S) in ABS up to 1.049 for the PTW 31015 in SW and water phantoms.
MC calculated  results for the diode detectors, the PTW microDiamond and the TLDs are lower than unity suggesting overestimations of small field OFs for these dosimeters, which increase with decreasing field size. For the 4 mm field, corrections vary from 1.7% (i.e.
  ) for the TLDs in the SW and water phantoms up to 5.6% (i.e.
  ) for the PTW 60016 in the SW phantom. A slight trend for smaller corrections in the ABS phantom also holds for these dosimeters in the 4 mm field fading out in the 8 mm field. The
  correction factors for the latter field are unity within 1σ in all phantom materials for the microDiamond and the majority of diodes, except for the PTW 60016, IBA SFD and IBA Razor in SW and water phantoms.
3.2.2. Measurements.
Experimental dosimetry measurements were performed for a smaller sample of dosimeters including 4 diode detectors and 2 air-filled ionization chambers (see table 1) using a SW phantom and custom-made inserts to position the effective point of measurement of each dosimeter at the RFP. Due to the finite mechanical accuracy practically achieved in the construction of the phantom inserts small air cavities between the insert and the frontal surface of each detector were found using mamo x-ray images. These air gaps were found to induce considerable dosimetric effects for the 4 mm field. These dosimetric effects are quantified in figure 4, where the normalized detector dose ratio for the msr field and 4 mm clinical field, ![$~{{\left[ \frac{D_{{\rm det},{{Q}_{{\rm msr}}}}^{{{f}_{{\rm msr}}}}}{D_{{\rm det},{{Q}_{{\rm clin}}}}^{{{f}_{{\rm clin}}}}} \right]}^{{\rm SW}}}$](https://content.cld.iop.org/journals/0031-9155/62/18/7532/revision2/pmbaa8590ieqn092.gif) , is presented as a function of air gap thickness. The presented data are normalized to the corresponding dose ratio in the absence of air gap (i.e. 0 mm thickness) and were obtained using two diode detectors (PTW 60017 and IBA Razor) and a microchamber (IBA CC01). As shown, the dosimetric impact of air gaps is greater for the Razor diode (leading to almost 4% overresponse in the presence of 0.5 mm gap thickness). In ionization chamber measurements on the other hand, the effect of small air gaps was suppressed as shown in figure 4, most probably because it is masked from the much greater volume averaging effects and stem/wall electrode perturbations. Both TLDs and alanine pellets were affected from small air gaps similarly to diode detectors, hence requiring corrections for the 4 mm field. The aforementioned effects decrease with increasing field size and become minimal for field sizes greater than or equal to 8 mm.
, is presented as a function of air gap thickness. The presented data are normalized to the corresponding dose ratio in the absence of air gap (i.e. 0 mm thickness) and were obtained using two diode detectors (PTW 60017 and IBA Razor) and a microchamber (IBA CC01). As shown, the dosimetric impact of air gaps is greater for the Razor diode (leading to almost 4% overresponse in the presence of 0.5 mm gap thickness). In ionization chamber measurements on the other hand, the effect of small air gaps was suppressed as shown in figure 4, most probably because it is masked from the much greater volume averaging effects and stem/wall electrode perturbations. Both TLDs and alanine pellets were affected from small air gaps similarly to diode detectors, hence requiring corrections for the 4 mm field. The aforementioned effects decrease with increasing field size and become minimal for field sizes greater than or equal to 8 mm.
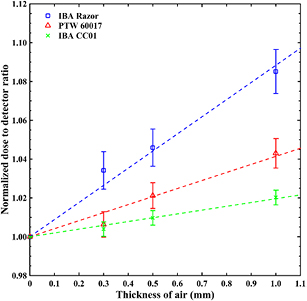
Figure 4. Normalized ![$~{{\left[ \frac{D_{{\rm det},{{Q}_{{\rm msr}}}}^{{{f}_{{\rm msr}}}}}{D_{{\rm det},{{Q}_{{\rm clin}}}}^{{{f}_{{\rm clin}}}}} \right]}^{{\rm SW}}}$](https://content.cld.iop.org/journals/0031-9155/62/18/7532/revision2/pmbaa8590ieqn093.gif) ratios for two dosimetry diodes and one ionization chamber versus insert's air gap thickness for 4 mm GK-PFX field. Error bars correspond to the combined statistical uncertainties at 68% level. The dash lines correspond to the linear fit on each data-set.
ratios for two dosimetry diodes and one ionization chamber versus insert's air gap thickness for 4 mm GK-PFX field. Error bars correspond to the combined statistical uncertainties at 68% level. The dash lines correspond to the linear fit on each data-set.
Download figure:
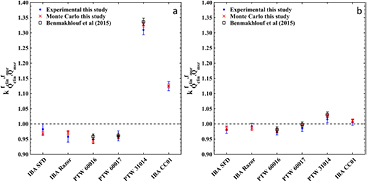
Standard image High-resolution imageTable 4 and figure 5 present experimentally determined output correction factors,  , for 4 diode detectors and 2 air-filled microchambers using the SW phantom (see table 1), along with published data for the PTW 60016, 60017 diodes and the PTW 31014 ionization chamber by Benmakhlouf et al (2015). Reference OF data were obtained by the weighted average of corresponding alanine, TLD and radiochromic film measurements for both the 4 and 8 mm fields, and were found equal to 0.821 ± 0.010 and 0.894 ± 0.007, respectively. In figure 5 corresponding MC calculations of this work are also presented for comparison. A general inspection of figure 5 implies fair agreement between all three datasets within uncertainties. In agreement to MC calculations, the greatest OF overestimation (5.2%) was observed for the PTW 60016 and the 4 mm GK field, while PTW 31014 underestimates the OF of the same field by 30.9%.
Table 4. Experimental results of  correction factors in SW phantom for the GK-PFX small fields. Corresponding combined total uncertainties at 68% level are shown in parentheses, indicating the uncertainty in the last two digits. Experimental data by Benmakhlouf et al (2015) are also presented for comparison.
| Detectors | This study | Benmakhlouf et al (2015) | ||
|---|---|---|---|---|
| 4 mm collimator | 8 mm collimator | 4 mm collimator | 8 mm collimator | |
| IBA SFD | 0.983 (18) | 0.981 (12) | — | — |
| IBA Razor | 0.957 (18) | 0.992 (09) | — | — |
| PTW 60016 | 0.948 (13) | 0.973 (09) | 0.958 (09) | 0.981 (09) |
| PTW 60017 | 0.960 (16) | 0.985 (10) | 0.961 (09) | 0.997 (09) |
| PTW 31014 | 1.309 (16) | 1.015 (11) | 1.336 (12) | 1.030 (09) |
| IBA CC01 | 1.124 (15) | 1.005 (10) | — | — |
Figure 5. Experimental and MC results of  correction factors in SW phantom for (a) 4 and (b) 8 mm GK-PFX small fields. Error bars correspond to the combined total uncertainties at 68% level. Experimental data by Benmakhlouf et al (2015) are also presented for comparison.
Download figure:
Standard image High-resolution image
4. Discussion
PFX reference dosimetry using TLD microcubes and alanine pellets in a water phantom requires minimal corrections, of up to 0.4% for TLDs, as suggested by the corresponding  results presented in table 2. Minor corrections, less than 1%, were also calculated for the vast majority of ionization chambers in water yielding corresponding
  values close to unity. Greater corrections, are associated with ionization chambers of larger cavity volume and steel in their central electrode, reaching up to 4.3% for the IBA CC01, whose electrode is made solely of high speed steel (detector's blueprints provided by the vendor).
The mean calculated  values for both the plastic phantom materials are systematically greater than those for water, although corresponding SW and water results agree within uncertainties for the vast majority of dosimeters. The greater corrections in plastic phantoms are mainly attributed to the increased attenuation of photon beams in plastic materials relative to water which impacts accordingly the corresponding phantom correction factor,
  . Using MC simulations,
  values of 1.006 and 1.024 were calculated for the SW and ABS phantoms, respectively. The higher
  for ABS, stems in part from the corresponding difference in the relative electron density (
 ) between the two plastic materials with respect to water (
 , ABS = 1.019 and
  , SW = 1.011) and in part from the adapter required to hold the ABS phantom in irradiation position which (unintentionally) partly attenuates 60Co beams of two sectors only in the msr field (Bhatnagar et al 2009). Additional MC simulations performed in the present study neglecting the adapter in dose calculations, verified Bhatnagar et al findings indicating that the ABS phantom sphere contributes by 1.4% to the
  while the adapter adds an additional 1.0%. The corresponding effect (contribution) of the adapter on
  calculations, exhibited a weak dependency on the specific detector used varying from 0.45% up to 0.88% with an average of 0.8%.
The increased corrections for ABS could also originate from the different in-phantom positioning of detectors compared to SW and water phantoms. The oblique detector pose in the ABS phantom, coupled with the steep dose gradients encountered in all three dimensions of the GK-PFX msr field, enhances the impact of detector-specific influences on ionization chamber reference dosimetry, such as volume averaging. In support to that, separate MC runs were performed to characterize and assess the  contributors for the IBA CC13 chamber, which has the longest (and largest) air cavity of all chambers studied in this work. Following a perturbation factor decomposition technique described in Bouchard et al (2009), it was found that volume averaging in ABS was almost five-fold compared to that in SW phantom (a kvolAv factor of 1.025 and 1.003 was calculated for ABS and SW, respectively).
Moreover, it should be noted that Novotny et al (2010) measured the physical density of 13 ABS phantoms and found a mean density of 1.066 ± 0.019 g cm−3, which is larger by 1.5% compared to the nominal 1.05 g cm−3 density value used in this study. The effect of the ABS density uncertainty on  was further studied by repeating corresponding ABS simulations using densities of 1.066 g cm−3 and 1.085 g cm−3 (average plus/minus one standard deviation).
  values of 1.026 and 1.035 were calculated for the 1.066 g cm−3 and 1.085 g cm−3 ABS densities, implying that an additional uncertainty of up to 1% should be considered during calibration dosimetry measurements using the ABS phantom if its physical density has not been primarily verified.
Johansson et al (2012) have also announced  data for GK-PFX which are presented in table 2. Compared to results of this work, agreement within expanded uncertainties (2σ) is observed for the water and SW phantoms, with absolute differences not exceeding 0.6%. The IBA CC01 chamber comprises an exception, since discrepancies of 2.16% and 2.60% are observed for the SW and water phantom materials, respectively. For the ABS phantom material,
  values of Johansson et al (2012) are systematically lower than those reported in this work with differences ranging from 0.5% up to 3.1% for the IBA CC01 and 1.4% for all the rest detectors. Although there is a number of sources of difference that the observed discrepancies could originate from (such as differences in the simulated geometry, the density and material composition of the ABS phantom adapter), further elaboration is not feasible since the corresponding details from Johansson et al (2012) are not available. Nonetheless, it should be mentioned that
  correction factors for several detectors presented herein have also been experimentally verified within uncertainties and corresponding preliminary results were recently presented (Zoros et al 2017).
The MC-calculated  correction factors presented in table 3, reflect the consensus that has been drawn from small field dosimetry in the last decade: diode detectors overestimate small field output factors, due to perturbations of the photon and electron fluence caused by the high atomic number and high density extra-cameral and sensitive-volume materials (Sauer and Wilbert 2007, Scott et al 2008, Eklund and Ahnesjo 2010, Fenwick et al 2013, Underwood et al 2013, Andreo and Benmakhlouf 2017, Benmakhlouf and Andreo 2017) whilst ionization chambers result in corresponding underestimations due to volume averaging and central/wall electrode perturbations (Laub and Wong 2003, Bouchard and Seuntjens 2004, Bouchard et al 2009, 2015a, 2015b, Pantelis et al 2012). Both trends are pronounced with decreasing field size and for detectors containing higher atomic number and high density extra-cameral and sensitive volume materials (e.g. shielded diodes compared to unshielded ones and diodes compared to microDiamond) or larger air cavities. The calculated
  values for the IBA Razor nano chamber (CC003-S) (a new ionization chamber which IBA plans to introduce for small field dosimetric measurements) suggest that this detector could be the best point dosimeter candidate for the PFX small fields. From the currently available detectors, the PTW 60019 microDiamond detector and the IBA SFD and Razor diodes present the smaller corrections for output factor determination for PFX fields with their
  values being within uncertainties. TLD microcubes also overestimate small field output factors due to differences in the mass stopping power between LiF and water (Andreo and Benmakhlouf 2017). The corresponding
  correction factors are closer to unity than the diode or the microDiamond factors due to the absence of high Z and high density extra-cameral materials perturbating the electron fluence. However, TLD dosimetry requires much labor and time to obtain precision dosimetry results. The alanine pellets used in this work, require relatively large corrections, especially for the 4 mm field, which are majorly due to dose averaging in their large active volume with regard to GK field dimensions.
The, overall, smaller relative output corrections associated with the ABS phantom material could be mainly attributed to the different orientation in detector positioning within the ABS phantom relative to that in SW and water phantoms (see, section 2.3). For ionization chambers for example, detector positioning differences are associated with different volume averaging effects on OF measurements. For the majority of ionization chambers, volume averaging is moderated in the ABS phantom except for Exradin A14SL which is the only microchamber requiring greater corrections in ABS. In this chamber, cavity diameter is larger than its central axis and in the ABS-orientation resides on the z-axis of the GK unit inducing, therefore, greater volume averaging effects compared to the SW/water-orientation where the detector is positioned with its central axis aligned to the z-axis. This also explains the incidence of ABS- and SW-calculated  values for the PTW 31016 (3D PinPoint), which exhibits equal cavity diameter and central axis. In any case, results of this work suggest that
  values for the small fields of GK are sensitive to detector orientation, and, therefore, attention should be paid in both their reporting and interpretation. It is noted that the ABS phantom adapter also contributes to
  differences between plastic phantoms by less than 1% (of the same order as
  ), as it dosimetrically affects only the msr field (Bhatnagar et al 2009).
Underneath the concept of reference and relative output correction factors, lies not only the scope of accurate determination of the relevant dosimetric quantities, but also the need to facilitate precision measurements using clinically available (active, reliable, standardized use) dosimeters. In view of this, and given that MC simulation cannot provide a gold standard without stringent verification, experimental dosimetry retains its key role also in small fields. In this work, reference experimental results for the GK small field OFs, i.e.  = 0.821 ± 0.010 and
  = 0.894 ± 0.007, agree within uncertainties with corresponding MC calculations, as well as the nominal OF values implemented by Elekta in the current version of Leksell GammaPlan TPS and experimental OF results presented in Benmakhlouf et al (2015). In their approach Benmakhlouf et al used a MC simulation model of PFX irradiation unit to recognize the dosimeter requiring minimal corrections (PTW liquid ionization chamber).
  factors were then determined for a number of clinically available dosimeters by comparing their response ratios in
  and
and  to corresponding ratios of the chosen dosimeter. Given that Benmakhlouf et al (2015) have used different MC code and simulation model compared to those of this work, the observed close agreement in
  factors for the microchamber and diode detectors used in both studies (see table 4 and figure 5) suggests that minor differences in OFs are not expected to affect considerably
  factors.
TLD and alanine measurements used to determine reference OF results were primarily corrected using corresponding MC-calculated  factors. This could introduce a bias to the observed agreement between MC calculations and measurements of this work. It is noted however, that the 12.3% variation observed in microchamber and diode detector reading ratio measurements for the 4 mm collimator, is shrunk to 1.2% after applying the corresponding MC-calculated
  factors to obtain a mean
  value of 0.820 ± 0.005 in close agreement to the experimental
  result. This finding adds validity to both the MC simulation and the experimental route followed for small field dosimetry in this work, as thoroughly discussed in Francescon et al (2017).
Finally, a worth noticing point of this study is the effect of small air gaps interposed between the detectors' frontal surfaces and phantom inserts on PFX dosimetry measurements. MC simulations performed with and without the air gap revealed that the dosimetric impact of air gaps is detector design specific and is greater for the diode detectors due to the smaller distance of their sensitive volume to the frontal surface of the detector which render them more sensitive to electron fluence perturbations. On the other hand, for the ionization chambers the dosimetric effect of the small air gap is smaller most probably because it is masked from the much greater volume averaging effects and stem/wall electrode perturbations. A corresponding effect has also been reported by Barrett and Knill (2016) who observed that a 2 mm air gap in front of the PTW 60019 microDiamond detector affected the measured reading ratios by up to 13%.
5. Conclusion
A comprehensive MC model of the GK-PFX irradiation unit was used to calculate the  and
and  correction factors for a series of solid state detectors and ionization chambers used in corresponding reference and output factor relative dosimetry measurements. Correction factors were calculated for the ABS and/or SW plastic phantoms used in GK-PFX dosimetry measurements as well as for a water phantom of the same geometry. Minor corrections, less than 1%, were found for the TLD and alanine solid state dosimeters and for the vast majority of the ionization chambers in water yielding corresponding
  values close to unity. Greater corrections, reaching up to 6.0% were associated with ionization chambers of larger cavity volume and steel in their central electrode. Besides the compositional and geometrical characteristics of the studied detectors the
  was found to depend also on the in phantom positioning of the dosimeters. A phantom correction of 1.006 and 1.024 for the SW and ABS (breaking down to 1.014 from the ABS phantom sphere and 1.010 from the adapter required to hold the ABS phantom in irradiation position) was observed, affecting the
  of the studied dosimeters. A variation of 1.8% (at 1σ) of the ABS density reported in literature was found to affect up to 1% the phantom correction and the corresponding
  . MC and experimental dosimetry measurements showed that the
  correction factors for the solid-state detectors are lower than unit, an effect that is attributed to the photon and electron fluence perturbations caused by the high atomic number and high density extra-cameral and sensitive-volume materials. The
  of the ionization chambers on the other hand were found higher than unit suggesting an underestimation of the dose in the 4 mm and 8 mm clinical fields. The magnitude of this underestimation depends on the combination of competitive phenomena associated with detector sensitive volume geometrical characteristics, and positioning/orientation in the clinical field as well as electron fluence perturbations due to the lower density of the air-filled cavity and higher density electrode and wall materials. These effects are field size depended and fade out for the larger 8 mm clinical field.
Acknowledgments
This work was financially supported by the State Scholarships Foundation of Greece through the program 'Research Projects for Excellence IKY/SIEMENS'.
This work was supported by computational time granted from the Greek Research & Technology Network (GRNET) in the National HPC facility—ARIS—under project IDs pr001027 and pr002037.
Elekta is acknowledged for providing blueprints of the ABS phantom adapter.
IBA, PTW and Exradin are kindly acknowledged for providing detailed detectors blueprints. IBA and PTW are also acknowledged for providing detectors used in this study.