

Abstract
Motion correction of 4D dynamic contrast enhanced MRI (DCE-MRI) series is required for diagnostic evaluation of liver lesions. The registration, however, is a challenging task, owing to rapid changes in image appearance. In this study, two different registration approaches are compared; a conventional pairwise method applying mutual information as metric and a groupwise method applying a principal component analysis based metric, introduced by Huizinga et al (2016). The pairwise method transforms the individual 3D images one by one to a reference image, whereas the groupwise registration method computes the metric on all the images simultaneously, exploiting the temporal information, and transforms all 3D images to a common space. The performance of the two registration methods was evaluated using 70 clinical 4D DCE-MRI series with the focus on the liver. The evaluation was based on the smoothness of the time intensity curves in lesions, lesion volume change after deformation and the smoothness of spatial deformation. Furthermore, the visual quality of subtraction images (pre-contrast image subtracted from the post contrast images) before and after registration was rated by two observers. Both registration methods improved the alignment of the DCE-MRI images in comparison to the non-corrected series. Furthermore, the groupwise method achieved better temporal alignment with smoother spatial deformations than the pairwise method. The quality of the subtraction images was graded satisfactory in 32% of the cases without registration and in 77% and 80% of the cases after pairwise and groupwise registration, respectively. In conclusion, the groupwise registration method outperforms the pairwise registration method and achieves clinically satisfying results. Registration leads to improved subtraction images.
Export citation and abstract BibTeX RIS
1. Introduction
Dynamic contrast enhanced MRI (DCE-MRI) is part of MRI examination of the liver and it involves scanning of the abdomen once before and several times after administration of a contrast agent. The images provide useful information about the microcirculation and tissue characteristics of liver lesions and parenchyma (Choyke et al 2003). Subtraction images, resulting from the subtraction of the non-contrast image from the images after contrast administration, give additional insight into the contrast uptake and washout of the lesion (Yu and Rofsky 2003, Yu et al 2005).
During the DCE-MRI acquisition the patient is asked to hold his/her breath several times to limit breathing motion, but the images can still suffer from inconsistencies because of varying breath hold depth, gasping for air (Wollny et al 2012), as well as cardiac and bowel movement. This motion between 3D acquisitions complicates the analysis of the 4D DCE-MRI series and the subtraction images can erroneously show enhancing lesions (Yu and Rofsky 2003). Motion correction improves the subtraction images by reducing motion artefacts (Sundarakumar et al 2015) and supports more accurate analysis of lesions. An illustration of a subtraction image before and after motion correction is shown in figure 1.
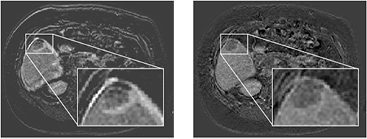
Figure 1. Differences between subtraction images before and after motion correction (left versus right) of an axial plane of the abdomen. The zoom-in of a lesion in the liver is inserted. Falsely enhancing edges of the liver and lesion are seen in the non-corrected image on the left. Motion correction avoids falsely enhancing edges of the liver and lesion.
Download figure:
Standard image High-resolution imageCorrecting for motion requires registration of the DCE-MRI series. A registration method should distinguish between intensity changes due to either the contrast agent and motion. Globally the motion is rigid, but locally it can be non-rigid and should be compensated in such way (Melbourne et al 2008).
Over the years, several methods have been proposed to compensate for motion in DCE-MR series of the abdomen. Some approaches have used pairwise registration methods with mutual information (MI) as metric, where the individual images are registered one by one to a reference image (Wells et al 1996, Rueckert et al 1999, Rohlfing et al 2003, Zöllner et al 2009, Hodneland et al 2014). These methods generally do not achieve the temporal smoothness needed for visual assessment, because of bias towards the choice of reference (Huizinga et al 2016 and Metz et al 2011). Groupwise registration methods for DCE-MRI have been proposed to achieve a better temporal smoothness. These methods distinguish motion from intensity changes due to contrast using pharmacokinetic models, (Hayton et al 1997, Buonaccorsi et al 2007, Bhushan et al 2011), or data reduction techniques (Melbourne et al 2007, Wollny et al 2012, Hamy et al 2014). Pharmacokinetic models, describing the intensity changes due to contrast, have been used to drive registration by reducing the model fitting errors (Hayton et al 1997, Buonaccorsi et al 2007, Bhushan et al 2011). A potential downside is that pharmacokinetic modelling requires a high temporal resolution (Henderson et al 1998). Another possible disadvantage is that a model could be corrupted by noise, or acquisition artefacts, leading to inappropriate model fits and thus misregistration (Melbourne et al 2007, Huizinga et al 2016). Some registration methods apply data reduction techniques, such as principle component analysis (PCA) or independent component analysis (ICA), to separate motion from contrast induced intensity changes. These approaches iteratively create synthetic images based on the results of data reduction and register towards the synthetic images, as in Hamy et al (2014), Melbourne et al (2007) and Wollny et al (2012). All these proposed approaches are not intrinsically groupwise approaches, since they register towards synthetic images based on data reduction or pharmacokinetic models, which could cause a bias towards these images. A true groupwise registration method would apply the cost function on the 4D image and aligns the images without the use of a reference image. Such a method is proposed by Huizinga et al (2016) and this PCA-based method will be validated on a clinical data set with a low temporal resolution (16 time points in 5 min).
In this study, clinical data sets were used to compare a conventional pairwise registration approach, using MI as metric, with the PCA-based groupwise registration method (Huizinga et al 2016). The two methods were compared based on quantitative evaluation methods as well as on the visual quality of the subtraction images, providing a good evaluation for clinical application.
2. Materials and methods
2.1. Data
Data sets of 70 patients from the UMC Utrecht were included in the study. All patients had a 4D DCE-MRI scan with the clinical focus on the liver. The DCE-MRI images were acquired in six breath holds with 1 to 5 3D images per breath hold. The DCE-MRI series was acquired on a 1.5 T scanner (Phillips) using a clinical protocol with the following parameters: TE: 2.143 ms; TR: 4.524 ms; flip angle: 10 degrees. After acquiring the first image of the series, gadobutrol (0.1 ml  Gadovist of 1.0 mmol
  at 1 ml
  ) or gadoxetate disodium (0.1 ml
  Primovist of 0.25 mmol
  at 1 ml
  ) was administered at once, followed by 25 ml saline solution at 1 ml
  . In total 16 3D images per patient were acquired with 90–105 slices and a matrix of 256 × 256. Voxel size was 1.543 mm × 1.543 mm × 2 mm. Further details can be found in Schalkx et al (2014).
One observer annotated one lesion in one slice of the non-contrast image for 49 data sets. The other data sets did not contain lesions. The 2D annotations were expanded to 3D using Otsu-thresholding, with thresholds based on the annotated slice, and hole-filling. This resulted in a rough lesion segmentation.
2.2. Registration methods
All the data sets were registered using two different registration approaches. One is a conventional pairwise registration method, using MI as metric. The other is a groupwise registration method, using a PCA-based dissimilarity metric. Both methods are available in the open-source software package elastix (Klein et al 2010), enabling a direct comparison3.
2.2.1. Pairwise registration.
Mutual information (MI) was chosen as cost function for the pairwise registration method. MI is robust for intensity differences, due to the contrast inflow, between the moving and the reference image. The first, non-contrast image was used as the reference image to which all other images in the DCE-MRI series were registered, because this image is subtracted from the contrast images to yield the subtraction images. The registration was done in three resolutions using a smoothing image pyramid schedule with a downsampling factor of 4, 2 and 1 in each dimension for the three successive resolutions. The adaptive stochastic gradient descent optimizer was employed for 500 iterations each resolution, with 2048 new samples every iteration. The mutual information between the two images was calculated in 32 histogram bins. A B-Spline transformation with a final grid spacing of 16 mm was applied.
2.2.2. Groupwise registration.
The groupwise registration method assumes that the intensity changes due to contrast can be described as a low dimensional signal model without prior knowledge of this model (Melbourne et al 2007, Hamy et al 2014, Huizinga et al 2016). The method separates the intensity changes due to contrast from motion and registers all images simultaneously to a common space by minimizing a cost function based on PCA. The cost function is calculated as follows: the 4D DCE-MRI series with V images and N voxels per 3D image is reshaped to an N × V matrix M. The correlation matrix C of this matrix is defined as:  , where
  is a columnwise mean of matrix M, and S is diagonal matrix with the standard deviations of each column in M. The eigenvalues of C are obtained by principle component analysis. The cost function is defined as the sum of the inversely weighted eigenvalues:
  , with j the rank of the eigenvalues. In order to maximize the highest eigenvalues, and impose more alignment in the DCE-MRI series, this cost function is minimized (Huizinga et al 2016).
The registration was done in four resolutions using a smoothing image pyramid schedule with a downsampling factor of 8, 4, 2 and 1 in each dimension, except for the time dimension, which was not down sampled. The adaptive stochastic gradient descent optimizer was employed for 500 iterations each resolution, with 2048 new samples every iteration. A B-spline stack transform with a final grid spacing of 16 mm was applied.
A fourth resolution, with downsampling factor 8, was effective for the groupwise registration with multiple images, but did visually not result in better registration in the pairwise registration approach, where only one image was deformed.
2.3. Experiments
Two types of experiments were performed; quantitative and qualitative evaluations. The quantitative evaluation aims to assess the accuracy of both registration methods and the qualitative evaluation aims to assess the clinical quality and reliability of the subtraction images after registration. The two registration methods were compared and, when possible, the original non-corrected images were included in the evaluation.
2.3.1. Quantitative evaluation.
Assessment of registration accuracy is complicated, because the liver does not have many distinguishable landmarks (Huizinga et al 2016) and manual placement of these landmarks is a difficult task, prone to errors (Murphy et al 2011). Therefore the evaluation was based on elements important in the clinical practice.
The ability of the registration methods to align the images of the DCE-MRI series was assessed on (1) temporal intensity smoothness, (2) lesion volume change and (3) spatial smoothness. Criteria 1 and 2 were calculated on the lesions, since these are the clinical regions of interest and were therefore evaluated on 49 datasets; criterion 3 was applied to all 70 data sets. The masks were obtained for the non-contrast image, which is the reference image for pairwise registration. For the groupwise registered calculations, the masks were transformed towards the common space of the groupwise registered series, to compare the same voxels in non-corrected, pairwise registered and groupwise registered DCE-MRI series. For both the pairwise and the groupwise registration, the transformations are defined for each 3D image separately.
2.3.2. Temporal intensity smoothness.
The time intensity curve of contrast in a lesion should be smooth. A time intensity curve can be disrupted by motion caused by inconsistent breath hold, see figure 2. For each voxel in the lesion mask, the standard deviation (SD) of the second derivative of the time intensity curve was calculated. The mean of all these standard deviations is an indication of the temporal intensity smoothness in the lesion. This temporal intensity smoothness was calculated in the 49 subjects with a lesion, for the non-corrected series, the pairwise registered and the groupwise registered series. Some lesions have different time intensity curves depending on the presence and rate of contrast uptake. The outcomes were thus compared on patient level with the Wilcoxon signed rank test.

Figure 2. Time intensity curves of a lesion showing severe motion during the acquisition of the DCE-MRI series. On the left the axial view of the non-contrast image is shown. The arrow indicates the lesion. On the right the mean intensity curves of that lesion are shown for the non-corrected DCE-MRI series and the pairwise and groupwise registered DCE-MRI series. The consequences of an inconsistent breath hold are visible in time points 7 to 10 of the non-corrected series. Registration corrects for this displacement.
Download figure:
Standard image High-resolution image2.3.3. Lesion volume change.
Improper registration could lead to changes in lesion volume (Sundarakumar et al 2015). Volume expansion or shrinkage for each voxel after deformation is defined by the Jacobian determinant of the deformation. The Jacobian determinant is defined on the reference (or common space) image voxels towards the moving image. Hence, only the reference lesion mask is needed. The geometric mean of the Jacobian determinant in the lesion was calculated for each image to identify volume changes induced by transformation. A mean of 1.00 indicates no volume change. The geometric mean Jacobian determinant was calculated for all transformed images, including the first, non-contrast image in the groupwise registration method. A t-test was performed between the outcomes of the pairwise and the groupwise registration methods.
2.3.4. Spatial smoothness.
The SD of the Jacobian determinant of the deformation is a measure for the smoothness of the transformation in the spatial domain. A smaller SD implies a smoother spatial transformation. The SD of the Jacobian determinant in the liver region was obtained for each transformed 3D image, including the first non-contrast image in the groupwise registration. A t-test was performed between the outcomes of the pairwise and the groupwise registration methods.
2.3.5. Qualitative evaluation.
Registration quality was evaluated through visual inspection of subtraction images by two observers. The subtraction images were obtained by subtracting the first, non-contrast image of the time series from the remaining images of the time series, which are contrast enhanced images. The subtraction images of the non-corrected, the pairwise registered and the groupwise registered DCE-MRI series ( ) were shown in a random order to two observers, radiologists with clinical experience of more than 10 years, who were unaware of the registration status of the images. The observers graded the subtraction images independently on a 5-point scale: (1) poor quality; useless and unrealistic subtraction image, (2) mediocre quality; difficult to assess whether the contrast enhancement is real or a result of registration errors, (3) acceptable quality; but a few erroneous enhancing areas as a result of registration errors, (4) good quality; assessment of contrast enhancement is easy, but some small unimportant erroneous enhancement visible, (5) excellent quality; assessment of contrast enhancement is easy and no erroneous enhancement visible. A grade of 4 or 5 means that the quality is satisfactory for the observers. The focus was mainly on the correctness of the subtraction image, but the alignment between successive images was also considered. The non-corrected, non-subtracted DCE-MRI series were always supplied as a reference for the enhancement and to assess the quality of the subtraction images in relation to the quality of the non-corrected, non-subtracted images.
The grades by the two observers were averaged for evaluation, unless the grades differed more than one point, in which case consensus was reached by the two observers. A difference of one point between the grades was acceptable, because the distinction between two adjacent grades is subjective.
The Wilcoxon signed rank test was used to test for significant differences between the visual quality of the subtraction images of the non-corrected, the pairwise registered and the groupwise registered DCE-MRI images. The inter-observer agreement was calculated using Spearman's rank correlation coefficient.
3. Results
3.1. Quantitative evaluation
3.1.1. Temporal intensity smoothness.
The median (interquartile range (IQR)) of the mean SD of the second derivative of the time intensity curve is 22.0 (11.4) for the non-corrected images, 22.6 (9.2) for the pairwise registered images and 16.6 (7.6) for the groupwise registered images. A lower mean SD means smoother intensity transitions between successive 3D images. Figure 3 shows the distribution of the mean SD of the subjects. The Wilcoxon signed rank test shows that the groupwise registration differs significantly from the non-corrected images and the pairwise registered images ( for both). The difference found between the non-corrected images and the pairwise images is less distinct (
 ).
).
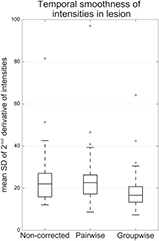
Figure 3. Smoothness of time intensity curves in lesions before and after pairwise and groupwise registration.
Download figure:
Standard image High-resolution image3.1.2. Lesion volume change.
The volume change of the lesions after pairwise and groupwise transformation is plotted in figure 4. In the boxplot, the geometric mean of the Jacobian determinant of the lesion is shown for each subject and each time point. The median geometric mean (IQR) is 0.99 (0.15) for pairwise registration and 1.00 (0.06) for groupwise registration. A t-test showed that there is no significant difference between the two groups ( ). The 24 outliers of the pairwise transformation originated from six subjects, two of which had seven or more time points in which the lesion volume change was defined as an outlier (7 and 10). In the other subjects only three outliers or fewer were found. For the groupwise results the 38 outliers originated from 16 subjects, two of which had seven or more outliers (7 and 10). In the other subjects only three time points or fewer had a lesion volume change defined as an outlier.
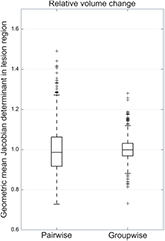
Figure 4. Relative volume changes of lesion regions per transformed 3D image, for pairwise and for groupwise registration.
Download figure:
Standard image High-resolution image3.1.3. Spatial smoothness.
The SD of the Jacobian determinant in the liver region is calculated in each time point of the 70 data sets. The median (IQR) SD of the Jacobian determinant for the pairwise deformation is 0.115 (0.047) and 0.044 (0.020) for the groupwise deformation, see figure 5. A t-test showed a significant difference between the pairwise and groupwise results (p = 0.000).
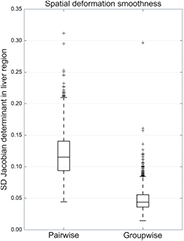
Figure 5. Spatial deformation smoothness of liver regions per transformed 3D image.
Download figure:
Standard image High-resolution image3.2. Qualitative evaluation
The subtraction images of the original, pairwise and groupwise registered images received identical scores from the two observers in 33% of cases, whereas a difference of one, two and three points was seen between the observers in 46%, 18% and 3% of cases, respectively. A moderate inter-observer agreement was observed with a Spearman's rank correlation coefficient of 0.444 ( ).
).
For cases that differed by more than one point, consensus was reached by the observers. The mean grade after averaging and consensus (SD) was 2.9 (0.7), 3.8 (0.9) and 4.0 (0.8) for non-corrected, pairwise and groupwise registration respectively. The Wilcoxon signed rank test showed a significant difference between non-corrected and pairwise registered images ( ), between non-corrected and groupwise registered images (
 ) and between pairwise and groupwise registered images (
 ). Figure 6 shows the frequency of the assigned grades.

Figure 6. Histogram plots of grades by observer 1, observer 2 and the consensus grades.
Download figure:
Standard image High-resolution imageThe original non-corrected DCE-MRI series was judged satisfactory (grade 4 or 5) in 32% of the images. The pairwise registered images have satisfactory results in 77% of the images and the groupwise registered images in 80% of the images.
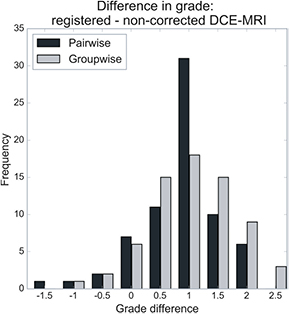
A positive difference of more than one point between the consensus grades of the non-corrected and registered subtraction images was observed in 16 subjects (23%) for the pairwise method and in 27 subjects (39%) for the groupwise method, see figure 7. A negative difference of more than one point between the consensus grades of the non-corrected and registered subtraction images was observed in 1 subject (1.4%) for the pairwise method and not present for the groupwise method.
Figure 7. Difference between original and registered image grades for consensus grading.
Download figure:
Standard image High-resolution image
4. Discussion
In this study, two different registration approaches were evaluated for motion correction of clinical DCE-MRI data. The evaluation was directed both at quantitative comparison of method results and at clinical application of motion corrected images, in the form of subtraction of non-contrast from contrast images.
4.1. Quantitative evaluation
The lack of a ground truth is alleviated by performing multiple experiments. The experiments evaluated the temporal intensity smoothness, lesion volume change and spatial smoothness after deformation.
Remarkably, the pairwise registration method gave slightly worse results than the non-corrected images in the temporal intensity smoothness evaluation. In 29 out of 49 subjects the average SD of the second derivative of the temporal intensity curve was higher for the pairwise registered images than for the non-corrected images, but the differences are small. Visual inspection showed that successive images of the non-corrected series within the same breath hold are often already aligned, but not necessarily with the non-contrast image. Pairwise registration improves the alignment with the non-contrast image at some cost of alignment between successive images. Although the temporal intensity smoothness of the pairwise registered images is slightly worse than that of the non-corrected images, the evaluation of the visual quality of the subtraction images shows that this did not result in poorer quality.
When it comes to lesion volume change, no significant difference is found between the two registration methods, however the distribution is wider for the pairwise registration than for the groupwise registration. The groupwise method is better able to preserve lesion volume than the pairwise method.
The third experiment evaluated the spatial smoothness after deformation. The median SD of the Jacobian determinant of the pairwise deformation was higher than for the groupwise deformation. The same pattern was seen by Huizinga et al (2016) on different data sets with a higher temporal resolution.
The difference between the pairwise and groupwise registration results can mostly be explained by the bias towards the reference image. The groupwise registration method eliminates this bias by simultaneous registration to a common space and applying the metric to all images at once, instead of separately registering toward a reference image. Although the groupwise method does not enforce temporal smoothness, like (Metz et al 2011), the use of temporal information accomplishes better temporal alignment of the images.
Apart from the differences in performance, the methods also differ in processing time and computational memory. The total run time of an entire DCE-MR series is ∼11 min for the pairwise registration and ∼40 min for the groupwise registration approach on a standard workstation. The groupwise registration approach requires more memory to load all the 16 images at once, around 5 GB, which is far more than the 0.3 GB needed for the pairwise approach that only loads two images at once. Both methods are implemented in elastix, which is freely available at elastix.isi.uu.nl.
4.2. Qualitative evaluation
The visual quality of the subtraction images before and after registration were evaluated by two observers. The evaluation was done in a subjective manner, hence the moderate inter-observer agreement.
Both observers graded the registered images higher than the non-corrected images. Overall, observer 1 had a slight preference for the subtraction images after pairwise registration, while observer 2 preferred the subtraction images after groupwise registration. There are two main reasons for the moderate inter-observer agreement. First, despite the clear instructions in section 2.3.5, both observers had a slightly different personal interpretation of the grading scale, something that can hardly be avoided in visual grading. Second, each observer might have focussed on different time points in the temporal dimension of the subtraction images. In the workflow, observers quickly glance over the full temporal dimension, after which they focus on the lesion or structure of interest in only a few time points. For these reasons, we opted for a consensus reading in case of more than one point difference between the observers. After consensus and averaging, the groupwise approach obtained higher grades than the pairwise approach.
Improvement of the quality of the subtraction images due to registration was also observed in a study by Sundarakumar et al (2015). In this study, the two observers had a higher inter-observer agreement than observed in our work. This study compared the ability of a pairwise registration approach to align the non-enhanced, arterial and delayed phase with the portal-venous phase. The quality assessment was done for each phase individually, explaining the difference in inter-observer agreement. The preference for groupwise registered images over non-corrected or pairwise registered images was also shown by Melbourne et al (2007) for a different registration method and different data. However, here the preference between two (registered) images was not given by clinical experts, but by the researchers.
Because of the satisfying quality of the subtraction images created by the groupwise registration, this method has been implemented in the daily clinical routine for abdominal DCE-MR images.
5. Conclusions
Registration of the DCE-MRI series of the liver improves the alignment of the images by correcting for the motion introduced by inconsistent breath hold, bowel and cardiac movements. It also provides the opportunity for image analysis in the clinical workstation, like contrast kinetic curves and signal intensity characterization. This study shows that the groupwise registration using a PCA-based dissimilarity metric on DCE MRI of the liver achieves better temporal alignment with smoother spatial deformations than pairwise registration with a mutual information metric. Besides this, motion correction increased the amount of images with a satisfying quality of the subtraction images from 32% to 77% and 80% of the cases after pairwise and groupwise registration, respectively.
Acknowledgments
This work was financially supported by the project BENEFIT (Better Effectiveness aNd Efficiency by measuring and modelling of Interventional Therapy) in the framework of the EU research programme ITEA (Information Technology for European Advancement).
Footnotes
- 3
The parameter files used, are available at elastix.bigr.nl/wiki/index.php/Par0047