

Abstract
The objective of this study was to quantitatively investigate the ability to distribute microbubbles along the interface between two tissues, in an effort to improve the edge and/or boundary features in phase contrast imaging. The experiments were conducted by employing a custom designed tissue simulating phantom, which also simulated a clinical condition where the ligand-targeted microbubbles are self-aggregated on the endothelium of blood vessels surrounding malignant cells. Four different concentrations of microbubble suspensions were injected into the phantom: 0%, 0.1%, 0.2%, and 0.4%. A time delay of 5 min was implemented before image acquisition to allow the microbubbles to become distributed at the interface between the acrylic and the cavity simulating a blood vessel segment. For comparison purposes, images were acquired using three system configurations for both projection and tomosynthesis imaging with a fixed radiation dose delivery: conventional low-energy contact mode, low-energy in-line phase contrast and high-energy in-line phase contrast. The resultant images illustrate the edge feature enhancements in the in-line phase contrast imaging mode when the microbubble concentration is extremely low. The quantitative edge-enhancement-to-noise ratio calculations not only agree with the direct image observations, but also indicate that the edge feature enhancement can be improved by increasing the microbubble concentration. In addition, high-energy in-line phase contrast imaging provided better performance in detecting low-concentration microbubble distributions.
Export citation and abstract BibTeX RIS
1. Introduction
Breast cancer is one of the most common cancers diagnosed in human adults (Siegel et al 2017). Early diagnosis and treatment of breast cancer is important for improving the survival rate of breast cancer patients.
X-ray mammography has been widely used as a method for detecting breast cancer, but the imaging contrast of current mammography technique relies on the attenuation differences between tumors and normal tissues. X-rays also undergo phase shifts when passing through an object. The changes of the monochromatic x-ray wave field can be expressed by the complex transmittance:

where  is the amplitude,
  is the phase shift, µ represents the attenuation coefficient, δ represents the refractive index decrement and r denotes coordinates on object plane perpendicular to the direction of x-ray propagation, z (Wu and Liu 2003b). Several x-ray imaging techniques based on the phase shift have been reported and investigated (Castelli et al 2011, Tanaka et al 2013, Zanette et al 2014), and in-line phase contrast x-ray imaging is one of these methods. The clinical feasibility of in-line phase contrast mammography has been widely reported (Wu et al 2015b, Wong et al 2014), and its potential to improve signal-to-noise ratio (SNR) and reduce exposure time as well as radiation dose have been demonstrated in phantom studies (Wong et al 2014). Recently, the criteria of the type of microbubble used for in-line phase contrast agent has been investigated and discussed by Wu et al (2017).
Since a clinical microbubble-based contrast agent was first investigated using x-ray diffraction enhanced imaging in 2010 (Arfelli et al 2010), applications of microbubbles and/or microspheres as x-ray phase contrast agents have attracted extensive research attention. Recent research progress toward the applications of microbubbles as x-ray phase contrast agents has demonstrated the imaging of microbubbles/microbubble suspensions using analyzer-based and propagation-based synchrotron x-ray phase contrast methods (Tang et al 2011, Xi et al 2011, Millard et al 2013) and the Talbot–Lau interferometry phase contrast method (Malecki et al 2012, Velroyen et al 2013). In 3D and quasi-3D imaging, computed tomography imaging of microbubbles was also demonstrated through a differential phase contrast system accompanied with object rotation (Tang and Yang 2013). We experimentally demonstrated quantitative in-line phase contrast tomosynthesis imaging of microbubble suspensions by combining the high-energy in-line phase contrast method with the tomosynthesis technique (Wu et al 2016). In addition, a study using co-polymer-shell beads/microspheres conceptually demonstrated that microbubble contrast agents may potentially provide the capability to perform dynamic imaging with analyzer-based synchrotron x-ray phase contrast (Millard et al 2015); however, negative impacts of co-polymer-shell microspheres toward the phase shift effects have been investigated (Wu et al 2017).
A single microbubble generally consists of a shell and gas infills. The materials of the shell may be made of polymers, proteins, lipid, etc. A few microbubble products on the market today are GE Optison and Bracco SonoVue. When microbubbles are distributed along the interfaces between gas-filled bubbles and tissue, sudden changes of physical density and electron density related to the materials of the microbubbles introduce significant x-ray phase contrast at the interfaces (Kiss et al 2003, Arfelli et al 2010, Tang et al 2011, Malecki et al 2012, Millard et al 2013, Velroyen et al 2013, Velroyen et al 2013, Tang and Yang 2013, Millard et al 2015, Wu et al 2016). For example, distributing microbubbles around certain malignant tumor cells can potentially be performed using a ligand-targeted technique, which has already been introduced and developed in the research field of cancer therapeutics and imaging agents (Srinivasarao et al 2015). Introducing high-density ligands on the microbubble surfaces dramatically increases the probability of the microbubbles becoming trapped by the endothelial receptors of blood vessels surrounding malignant cells (Lindner 2010, Steinl and Kaufmann 2015). Therefore, using ligand-targeted microbubbles to perform x-ray phase contrast imaging not only has the potential to increase the imaging accuracy and specificity, but also to allow observation of the phase contrast induced edge enhancement provided by the microbubble distribution.
In this study, we employed a custom designed phantom with a simple interior vascular structure to demonstrate how edge enhancement in high-energy in-line phase contrast projection and tomosynthesis imaging can be provided by distributing microbubbles on the surface between the vascular structure and the tissue. Since the distribution of microbubbles along the interface is directly related to the concentration of microbubble suspension injected into the phantom, different concentrations of microbubble suspensions were utilized for comparison purposes. Comparison studies were conducted for 2D and 3D conventional low-energy contact mode, low-energy in-line phase contrast mode and high-energy in-line phase contrast mode utilizing the same radiation dose delivery.
2. Methods and materials
2.1. Imaging systems
As shown in figure 1, the phantom was placed on a stage. R1, also known as the source-to-object distance (SOD), was 68.58 cm for both the contact mode and the in-line phase contrast mode. The value of R2, also known as the object-to-image distance (OID), utilized for contact mode imaging was 2.54 cm. For the in-line phase contrast mode, R2 was selected as 100.33 cm. This value was utilized to deliver optimal phase shift effects according to the principles of in-line phase contrast imaging, as well as to reduce the loss of x-ray photons during propagation through the air gap (Wu and Liu 2003a, 2003b, 2004, Wu et al 2015a). In this study, we used a micro focus x-ray source (Model L8121-03, Hamamatsu Photonics) able to generate x-ray photons ranging from 40 kVp to 150 kVp. The tube allows selection of nominal focal spot sizes of 7 µm, 20 µm, and 50 µm for tube operation at an output power of 10 W, 30 W, and 50 W, respectively. The selection of x-ray tube voltages and currents for the imaging modes used in this study are detailed in table 1. A prime beam filter of 2.5 mm Al was utilized for both phase contrast mode and contact mode to harden the prime beam (Wu et al 2015a). The image detection system was a CCD detector coupled with a CsI:Tl scintillator (66 mm × 66 mm, Imagestar 9000, Photonic Science Ltd), providing 21.6 µm of sampling pixel pitch.
Table 1. X-ray tube voltages and currents for the imaging modes.
| Low-energy contact mode | Low-energy in-line phase contrast | High-energy in-line phase contrast | |
|---|---|---|---|
| Tube energy (kVp) | 40 | 40 | 120 |
| Tube current (mA) | 0.5 | 0.5 | 0.5 |
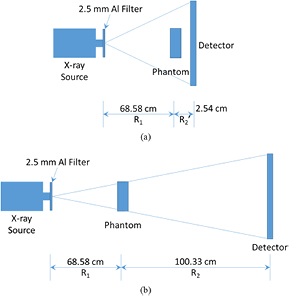
Figure 1. The imaging system configurations employed for (a) conventional low-energy contact mode, and (b) in-line phase contrast mode. The phantom will be rotated according to the acquisition parameters to perform the tomosynthesis mechanism.
Download figure:
Standard image High-resolution imageThe measurements were conducted with an averaged glandular dose (Dg) of 2.590 mGy. Based on this dose constraint, the corresponding object entrance exposure (XESE) values can be determined by the ratio of the average glandular dose (Dg) and the normalized average glandular dose coefficient (DgN) as follows:

where Dg has been selected as the unified dose value of 2.590 mGy, and DgN was determined by experimental and computer simulation methods based on radiation beam quality (x-ray energy or HVL), x-ray tube target material, filter material, breast thickness, and breast tissue composition, which is the same strategy utilized in the literature (Wu 1991, Wu et al 1991, Hendrick 1994, Wu et al 1994, Suryanarayanan et al 2002, Wong et al 2014). For the calculation, we assumed a thickness of 4 cm with a composition of 50% glandular and 50% adipose. The exposure time (T) of each mode was determined by the calculated object entrance exposure (XESE) and the entrance exposure rate (RX):
where the entrance exposure rate was directly measured by a dose meter with an ionization chamber (Model 9095 dosimeter and 10X9-180 chamber, Radcal Corporation, Monrovia, CA). The resultant exposure time for each imaging mode is shown in table 2.
Table 2. Experimental imaging parameters for the investigation of different mode.
| Tube voltage (kVp) | Tube current (mA) | Prime beam filtration | Dg (mGy) | DgN (mrad R−1) | XESE (mR) | RX (mR s−1) | Exposure time (s) |
|---|---|---|---|---|---|---|---|
| 40 | 0.5 | 2.5 mm Al | 2.590 | 5.88 | 440.48 | 2.13 | 206.80 |
| 120 | 5.79 | 447.32 | 24.80 | 18.04 |
Dg: average glandular dose. DgN: normalized average glandular dose coefficient. XESE: object entrance exposure, RX: entrance exposure rate.
For image acquisition with each projection mode, three projections were acquired and averaged into one image. For image acquisition in tomosynthesis imaging mode, 11 angular projections were acquired while the object was being rotated from −7.5° to +7.5° in 2° increments. In tomosynthesis imaging mode, the exposure time for each angular projection was the total exposure time of the corresponding kVp divided by 11 projections. After angular projections of the test objects were acquired with the tomosynthesis imaging mode, the angular projections were processed by the modified Feldkamp–Davis–Kress (FDK) backprojection algorithm detailed in the literature (Feldkamp et al 1984, Rougee et al 1993, Godfrey et al 2006, Chen et al 2008) to obtain reconstructed tomosynthesis in-plane images. The slice thickness of the tomosynthesis reconstruction was 0.2 mm.
2.2. Phantom design
A schematic of the phantom is provided in figure 2. A 40 mm-thick acrylic slab was employed to simulate compressed breast tissue 4 cm in thickness. A rectangular cavity with the length of 30 mm (x), the height of 2.0 mm (y) and the width of 0.8 mm (z) was fabricated inside the acrylic slab to facilitate injection of the microbubble suspensions with different concentrations. Based on the discussion toward the type of microbubbles used for in-line phase contrast agent presented in literature (Wu et al 2017), the microbubbles employed in this study were OPTISON microbubbles produced by GE Healthcare. Before administration, the microbubbles must be re-suspended by gentle manual rotation at room temperature until the appearance of the suspension becomes similar to milk. Each OPTISON ml contains 5.0 × 10⁸ to 8.0 × 10⁸ microbubbles dissolved in 0.9% aqueous sodium chloride (NaCl) as the suspension agent. The suspension can be further dissolved by adding 0.9% aqueous sodium chloride to create different concentrations. The relative concentrations administered were 50%, 25%, 12.5%, 6.25% and 0% (control study with 0.9% aqueous sodium chloride only), corresponding to volume concentrations (V/V%) of 0.40%, 0.20%, 0.10%, 0.05% and 0.00%. Before acquiring images of the phantom, the microbubble suspensions were injected into the acrylic phantom and a time delay of 5 min was implemented to allow the microbubbles to become distributed at the interface between the acrylic and the cavity.

Figure 2. Schematic of the tissue-vascular simulation phantom.
Download figure:
Standard image High-resolution image2.3. Edge-enhancement-to-noise ratio
The edge-enhancement-to-noise ratio (EE/N) was calculated to quantify the edge features between the saline infilled tube and the tissue-simulating acrylic slab, and determined as follows (Donnelly et al 2003, Pagot et al 2005):
where Max, Min,  and
and  denote the maximum intensity value of the edge, the minimum intensity value of the edge, the standard deviation of the left-side background, and the standard deviation of the right-side background, respectively. In this study, the backgrounds of the edge were defined as regions of 51 pixels adjacent to the left and right of the edge. The averaged horizontal profile intensities along the maximum-value lines were plotted to calculate the EE/N values.
3. Results
3.1. Projection imaging results
After distributing the five different concentrations of microbubbles investigated in this study along the interface between the saline and the acrylic slab, images were acquired using low-energy contact-mode, low-energy in-line phase contrast and high-energy in-line phase contrast as shown in figures 3(a)–(e) through 5(a)–(e), respectively. Each image was acquired with a radiation dose of 2.59 mGy. Figures 3(f) through 5(f) illustrate the averaged intensity profiles plotted along the microbubble-distributed interfaces corresponding to the images shown in (a)–(e).
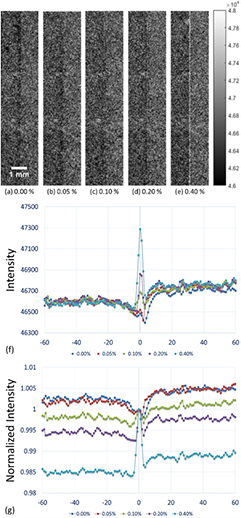
Figure 3. (a)–(e) Conventional contact-mode projection images acquired under 40 kVp x-ray tube voltage for microbubble suspensions of 0.00%, 0.05%, 0.10%, 0.20% and 0.40%, respectively. (f) Averaged intensity profiles of conventional contact-mode projection along the boundary between saline and acrylic under different concentrations of microbubbles. (g) Averaged intensity profiles normalized by the peak value at the microbubble-distributed interface. (Left side: 0.9% NaCl saline; right side: acrylic.)
Download figure:
Standard image High-resolution image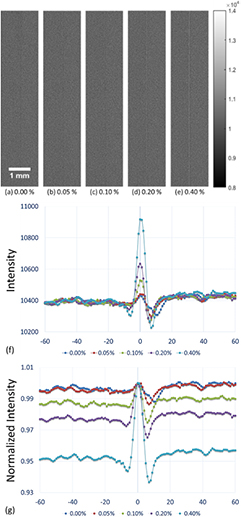
Figure 4. (a)–(e) In-line phase contrast projection images acquired under 40 kVp x-ray tube voltage for microbubble suspensions of 0.00%, 0.05%, 0.10%, 0.20% and 0.40%, respectively. (f) Averaged intensity profiles of low-energy in-line phase contrast projection along the boundary between saline and acrylic under different concentrations of microbubbles. (g) Averaged intensity profiles normalized by the peak value at the microbubble-distributed interface. (Left side: 0.9% NaCl saline; right side: acrylic.)
Download figure:
Standard image High-resolution image
Figure 5. (a)–(e) In-line phase contrast projection images acquired under 120 kVp x-ray tube voltage for microbubble suspensions of 0.00%, 0.05%, 0.10%, 0.20% and 0.40%, respectively. (f) Averaged intensity profiles of high-energy in-line phase contrast projection along the boundary between saline and acrylic under different concentrations of microbubbles. (g) Averaged intensity profiles normalized by the peak value at the microbubble-distributed interface. (Left side: 0.9% NaCl saline; right side: acrylic.)
Download figure:
Standard image High-resolution image3.2. Tomosynthesis imaging results
The in-plane images acquired when distributing different concentrations of microbubbles along the saline-acrylic interface using low-energy contact-mode, low-energy in-line phase contrast and high-energy in-line phase contrast tomosynthesis are shown in figures 6(a)–(e) through 8(a)–(e), respectively. Each image was acquired with a radiation dose of 2.59 mGy, and the in-plane slice thicknesses were 0.2 mm for each imaging mode. Figures 6(f) through 8(f) illustrate the averaged intensity profiles plotted along the microbubble-distributed interfaces according to the images shown in (a)–(e).
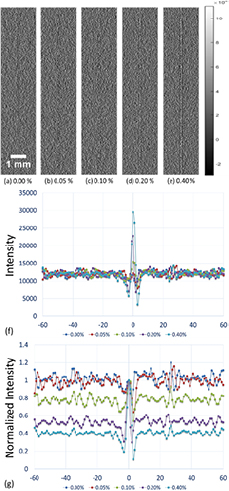
Figure 6. (a)–(e) Conventional contact-mode tomosynthesis in-plane images acquired under 40 kVp x-ray tube voltage for microbubble suspensions of 0.00%, 0.05%, 0.10%, 0.20% and 0.40%, respectively. (f) Averaged in-plane intensity profiles of low-energy conventional contact-mode tomosynthesis along the boundary between saline and acrylic under different concentrations of microbubbles. (g) Averaged intensity profiles normalized by the peak value at the microbubble-distributed interface. (Left side: 0.9% NaCl saline; right side: acrylic.)
Download figure:
Standard image High-resolution image
Figure 7. (a)–(e) In-line phase contrast tomosynthesis in-plane images acquired under 40 kVp x-ray tube voltage for microbubble suspensions of 0.00%, 0.05%, 0.10%, 0.20% and 0.40%, respectively. (f) Averaged in-plane intensity profiles of low-energy in-line phase contrast tomosynthesis along the boundary between saline and acrylic under different concentrations of microbubbles. (g) Averaged intensity profiles normalized by the peak value at the microbubble-distributed interface. (Left side: 0.9% NaCl saline; right side: acrylic.)
Download figure:
Standard image High-resolution image
Figure 8. (a)–(e) In-line phase contrast tomosynthesis in-plane images acquired under 120 kVp x-ray tube voltage for microbubble suspensions of 0.00%, 0.05%, 0.10%, 0.20% and 0.40%, respectively. (f) Averaged in-plane intensity profiles of high-energy in-line phase contrast tomosynthesis along the boundary between saline and acrylic under different concentrations of microbubbles. (g) Averaged intensity profiles normalized by the peak value at the microbubble-distributed interface. (Left side: 0.9% NaCl saline; right side: acrylic.)
Download figure:
Standard image High-resolution image3.3. Edge-enhancement-to-noise ratios
By employing equation (4) and the method detailed in section 2.3, edge-enhancement-to-noise ratios (EE/N) for each combination of imaging mode and microbubble distribution were calculated according to the intensity profiles shown in figures 3(f) through 8(f). The resultant data are listed in tables 3 through 8, and plotted as functions of volume concentration in figures 9(a) and (b) for projection mode and tomosynthesis, respectively.
Table 3. Edge intensity, noise and EE/N of low-energy (40 kVp) contact mode projection images.
| Concentration | 0.00% | 0.05% | 0.10% | 0.20% | 0.40% |
|---|---|---|---|---|---|
| Max | 46 484.58 | 46 519.67 | 46 688.84 | 46 860.40 | 47 288.28 |
| Min | 46 397.24 | 46 420.35 | 46 537.93 | 46 568.44 | 46 635.88 |
| Noise (R) | 23.45 | 23.72 | 26.92 | 19.71 | 23.14 |
| Noise (L) | 19.37 | 20.75 | 20.91 | 21.80 | 17.01 |
| EE/N | 4.06 | 4.46 | 6.26 | 14.05 | 32.12 |
Table 4. Edge intensity, noise and EE/N of low-energy (40 kVp) in-line phase contrast projection images.
| Concentration | 0.00% | 0.05% | 0.10% | 0.20% | 0.40% |
|---|---|---|---|---|---|
| Max | 10 432.86 | 10 440.26 | 10 528.51 | 10 635.49 | 10 918.14 |
| Min | 10 309.52 | 10 299.77 | 10 264.85 | 10 266.10 | 10 228.24 |
| Noise (R) | 9.25 | 9.97 | 7.82 | 9.38 | 12.03 |
| Noise (L) | 12.39 | 12.36 | 13.21 | 10.79 | 11.14 |
| EE/N | 11.28 | 12.51 | 24.30 | 36.54 | 59.52 |
Table 5. Edge intensity, noise and EE/N of high-energy (120 kVp) in-line phase contrast projection images.
| Concentration | 0.00% | 0.05% | 0.10% | 0.20% | 0.40% |
|---|---|---|---|---|---|
| Max | 38 385.21 | 38 386.55 | 38 523.28 | 38 655.55 | 39 120.16 |
| Min | 38 089.43 | 38 081.05 | 38 050.94 | 38 031.21 | 38 028.41 |
| Noise (R) | 13.08 | 13.18 | 13.18 | 15.25 | 16.66 |
| Noise (L) | 18.68 | 14.54 | 12.86 | 14.13 | 16.32 |
| EE/N | 18.35 | 22.02 | 36.28 | 42.48 | 66.21 |
Table 6. Edge intensity, noise and EE/N of low-energy (40 kVp) contact mode tomosynthesis images.
| Concentration | 0.00% | 0.05% | 0.10% | 0.20% | 0.40% |
|---|---|---|---|---|---|
| Max | 11 887.67 | 12 220.02 | 15 464.33 | 22 791.00 | 29 548.65 |
| Min | 8639.19 | 7844.81 | 8404.47 | 6812.17 | 3164.97 |
| Noise (R) | 747.41 | 682.46 | 633.64 | 742.54 | 764.62 |
| Noise (L) | 679.49 | 594.67 | 641.70 | 726.06 | 596.82 |
| EE/N | 4.55 | 6.84 | 11.07 | 21.76 | 38.47 |
Table 7. Edge intensity, noise and EE/N of low-energy (40 kVp) in-line phase contrast tomosynthesis images.
| Concentration | 0.00% | 0.05% | 0.10% | 0.20% | 0.40% |
|---|---|---|---|---|---|
| Max | 2635.87 | 2672.04 | 4599.98 | 6762.28 | 11 565.19 |
| Min | −582.41 | −862.89 | −2328.42 | −2766.06 | −5214.92 |
| Noise (R) | 326.71 | 279.85 | 270.87 | 285.23 | 337.84 |
| Noise (L) | 329.53 | 382.84 | 415.12 | 271.28 | 323.75 |
| EE/N | 9.81 | 10.54 | 19.77 | 34.23 | 50.72 |
Table 8. Edge intensity, noise and EE/N of high-energy (120 kVp) in-line phase contrast tomosynthesis images.
| Concentration | 0.00% | 0.05% | 0.10% | 0.20% | 0.40% |
|---|---|---|---|---|---|
| Max | 7326.72 | 7288.01 | 9409.56 | 14 023.92 | 19 159.20 |
| Min | 1340.10 | 1135.32 | −392.47 | −1664.73 | −4156.94 |
| Noise (R) | 438.86 | 488.60 | 384.21 | 444.89 | 476.35 |
| Noise (L) | 697.20 | 488.29 | 474.05 | 357.23 | 414.26 |
| EE/N | 10.28 | 12.60 | 22.72 | 38.89 | 52.23 |
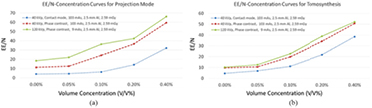
Figure 9. (a) Comparison of edge-enhancement-to-noise ratio (EE/N) curves for projection mode. (b) Comparison of edge-enhancement-to-noise ratio curves for tomosynthesis mode.
Download figure:
Standard image High-resolution image4. Discussion
This study presents a comparison of imaging results for different tube energies and total mAs values for projection and tomosynthesis imaging by conventional contact and in-line phase contrast modes. The edge-enhancement-to-noise ratio was determined by the intensities of the edge and the background noise level. Based on the theory of the noise power spectrum with system magnification (Zhang et al 2006), under the same settings of kVp, mAs and filtration, the noise level in in-line phase contrast mode would be reduced by a factor of the square of the system magnification, as compared with contact mode. The fixed radiation dose delivered to the phantom for the high-energy phase imaging for both contact-mode and in-line phase contrast mode utilized the same mAs under a fixed kVp and filtration. Although the detective quantum efficiency of the system can be theoretically preserved in an in-line phase contrast mode system, the detected x-ray photons are reduced following the inverse square law, due to the long object-to-detector distance. Thus, the contrast differences of the microbubble distributed edge and the tissue simulated backgrounds were lower in the low-energy phase contrast mode (figures 4(f) and 7(f)) than in contact mode (figures 3(f) and 6(f)). Despite this, the contrasts of the edge, as determined by the differences between the maximum and minimum values of the intensities, were preserved in both projection and tomosynthesis in-line phase contrast mode, due to the additional contribution of phase contrast. For high-energy in-line phase contrast mode at 120 kVp, the detective quantum efficiency would theoretically be much lower than low-energy mode at 40 kVp, but the photon flux would be 9 times that of 40 kVp mode. Thus, not only can the overall imaging intensity be preserved, but also the contrasts of the microbubble distributed edges, especially when the concentration was extremely low. These theoretical phenomena are supported by comparing figures 3(a)–(e) with 5(a)–(e) and 6(a)–(e) with 8(a)–(e).
The images for each mode demonstrate dramatic microbubble-enhanced edge features when compared to the images without microbubbles. As shown by figures 3(b) through (e) with concentrations ranging from 0.05% through 0.40%, compared to figure 3(a) with 0.0%, edge enhancement improved as a function of microbubble concentration. In addition, the high-energy in-line phase contrast images in both projection mode (figure 5) and tomosynthesis mode (figure 8) demonstrated superior edge detection contrast features for low-concentration microbubble distributions. These observations are also supported by the curves of edge-enhancement-to-noise ratios provided in figures 9(a) and (b) for projection and tomosynthesis imaging, respectively.
The low-energy conventional contact mode images (figures 3 and 6) represented the absorption attenuation images, and failed to provide the edge features for concentrations under 0.20%. The low-energy in-line phase contrast mode images (figures 4 and 7) provided a little progress toward making the edge features visible for the 0.10% concentration, thus the system magnification plus low-energy in-line phase contrast effects provided very limited contributions toward the edge feature improvement. Thus, the system magnification of the high-energy in-line phase contrast also did not benefit the imaging contrast of the edge with microbubble distributions. Since, upon the observations, high-energy in-line phase contrast mode images provided the highest visibility for low-concentration microbubble distributions, and rendered both the 0.10% and 0.05% edges visible in projection mode as well as tomosynthesis mode, the preservation of the edge enhancement may result from the high-energy photons compensating for the detective quantum efficiency (DQE) through additional phase contrast and high photon flux (Wu and Liu 2004, Wu et al 2015a).
Shown in figure 10, under a constant dose delivery, 2.59 mGy, the DQE(0)s of low-energy contact mode, low-energy in-line phase contrast and high-energy in-line phase contrast are 0.74, 0.30 and 0.34, respectively. When comparing the microbubble images of low-energy in-line phase contrast and high-energy in-line phase contrast, improvements of the imaging contrast resulted from the factor of system DQEs were very limited. The phase shifts are characterized by the refractive index decrement, δ, which can be described by:

where  is wavelength, re = 2.818 × 10⁻¹⁵ m is the classical electron radius, NA is Avogadro's number (
 ),
),  is mass density, wi is the weight fraction of the ith element, Zi denotes its atomic number, Ai is the atomic mass (g mol−1), and
  denotes the number of electrons per unit volume for compounds and mixtures (Kiss et al 2003, Suortti and Thomlinson 2003). Considering the microbubble was made of albumin shell (
 and
and  ) and C3F8 gas infill (
 and
and  ), the estimated average electron density of the microbubble can be different from water (
 and
and  ) and acrylic (
 and
and  ). This factor of difference in electron densities results in more phase shift for microbubble distributed boundaries than for the water-acrylic boundary. As mentioned in section 1,
  , these rapid changes of phase among acrylic area, microbubbles layer and water-only area may further induce more phase contrast image intensity changes based on the relationship of (Wu and Liu 2003a, 2003b, 2004, Wu 2014)

where  represents the phase contrast image intensity,
  is the attenuation and
  is the Laplacian operator, t is the sample thickness along x-ray propagation, i.e. the thickness of the cavity in this study, and z equals R2, 100.33 cm. The factor
  represents the amplification from the phase contrast effects as compared to the conventional contrast technique. Thus, considering the experiment condition and the simple structure of the phantom employed in this study,
  and
and  can be numerically modeled and estimated when assuming a single layer of microbubble tightly distributed along the boundary of the acrylic and water. The resultant curves for microbubble distributed mode and non-microbubble mode are shown in figure 11. The intrinsic imaging contrasts of overshooting produced by
  would be 3.73 (left) and 2.47 (right) at the boundary with microbubbles distributed and 1.0 (left) and 1.0 (right) at the boundary without microbubbles distributed.

Figure 10. DQE curves measured for low-energy contact mode, low-energy in-line phase contrast and high-energy in-line phase contrast.
Download figure:
Standard image High-resolution image
Figure 11. The refractive index decrements, δ, curves (blue lines) and the Δδ curves (red lines) at the boundary of acrylic and salt water (a) with and (b) without microbubbles distributed. The numerical modeling was based on the volume ratio of microbubbles and water was 0.52–0.48 and the volume ratio of albumin shell and the gas infill was 0.27–0.73 which was calculated based on OPTISON Prescription Information by GE Healthcare.
Download figure:
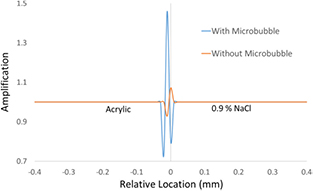
Standard image High-resolution imageIn addition, the curves of amplification factors,  , from the phase contrast effects as compared to the conventional contrast technique are shown in figure 12 for the conditions with and without microbubble distributed. Based on the curve of the amplification factor the image contrast enhancement produced by overshooting effects of microbubbles distributions could be up to 4.67 times of non-microbubble mode, which is supported by the data shown in tables 5 and 8. Thus, the differences in overshooting effects of the amplification curve produced by microbubbles indicates the dramatic edge enhancement in high-energy in-line phase contrast imaging technique when comparing with conventional contact mode under the same radiation dose delivery.
Figure 12. Curves of amplification factors from the phase contrast effects as compared to the attenuation for the conditions with (blue line) and without (red line) microbubble distributed.
Download figure:
Standard image High-resolution image
This study addressed only a task using a tissue simulating phantom containing a simple structure. The total numbers of microbubbles distributed on the interface and the number of microbubble layers perpendicular to the x-ray propagation were not precisely estimated for each concentration mode. The total numbers of microbubbles distributed on the interface and the number of microbubble layers perpendicular to the x-ray propagation were not precisely estimated for each concentration mode. Based on the principle of the in-line phase contrast, phase contrast occurs at the boundary of two different types of materials and it is proportional to Δδ. Since Δδ equals 0 within the same material distribution areas, which can be observed in figure 11 at homogeneous acrylic part and saline part, the edge enhancement result from the difference of amplification factors does not occur within the lateral multilayers. Questions regarding the imaging quality improvements resulted from the multilayer microbubble aggregations on the interface and corresponding multilayer issues would be the limitations of this study. Nevertheless, the encouraging imaging results acquired by the high-energy in-line phase contrast mode with microbubble concentrations less than 0.10% provide motivation for translating phantom studies to more biologically-related explorations in the future.
5. Conclusion
In this study, images of a custom designed tissue simulating phantom injected with differing concentrations of microbubble suspensions were quantitatively acquired using low-energy conventional contact and in-line phase contrast modes, including high-energy in-line phase contrast projection and tomosynthesis imaging methods under a constant radiation dose delivery of 2.59 mGy.
This study successfully demonstrated the edge enhancement provided by distributing microbubbles along the interface between two different tissues by measuring the edge-enhancement-to-noise ratio from the resultant images. The quantitative edge-enhancement-to-noise ratio results illustrated a monotonically increasing relationship with the microbubble concentrations and demonstrated that using albumin-shell microbubbles as phase contrast agent for high-energy in-line phase contrast projection and tomosynthesis imaging techniques may potentially benefit the detections of the boundary of two tissues with similar attenuation features. Although the tissue-simulating phantom we used in this study has limitations, the imaging results of low-concentration microbubble suspensions under low radiation dose delivery indicate the feasibility to improve edge and/or boundary features and conspicuity that are worthy of future studies.
Acknowledgments
This research was supported in part by the NIH under grant R01 CA193378, and in part by a grant from the University of Oklahoma Charles and Peggy Stephenson Cancer Center funded by the Oklahoma Tobacco Settlement Endowment Trust. We would like to acknowledge the support of Charles and Jean Smith Chair endowment fund as well.