

Abstract
Activation of detectors and phantoms used for commissioning and quality assurance of clinical proton beams may lead to radiation protection issues. Good understanding of the activation nuclide vectors involved is necessary to assess radiation risk for the personnel working with these devices on a daily basis or to fulfill legal requirements regarding transport of radioactive material and its release to the public. 11 devices and material samples were irradiated with a 220 MeV proton pencil beam (PBS, Proton Therapy Center, Prague). This study focuses on devices manufactured by IBA Dosimetry GmbH: MatriXX PT, PPC05, Stingray, Zebra, Lynx, a Blue Phantom rail and samples of RW3, PMMA, titanium, copper and carbon fibre plastic. Monitor units (MU) were monitored during delivery. Gamma spectrometry was then performed for each item using a HPGe detector, with a focus on longer lived gamma emitting radionuclides. Activities were quantified for all found isotopes and compared to relevant legal limits for exemption and clearance of radioactive objects. Activation was found to be significant after long irradiation sessions, as done during commissioning of a proton therapy room. Some of the investigated devices may also cumulate activity in time, depending on the scenario of periodic irradiation in routine clinical practice. However, the levels of activity and resulting beta/gamma doses are more comparable to internationally recommended concentration limits for exemption than to dose limits for radiation workers. Results of this study will help to determine nuclide inventories required by some legal authorities for radiation protection purposes.
Export citation and abstract BibTeX RIS
1. Introduction
In conventional radiotherapy (LINACs), material activation can only be introduced by photons of energies above the photonuclear threshold. The main channels are (γ,n) reactions leading to air activation (13N (t1/2 = 10 min), 15O (t1/2 = 2 min)), therefore, forced ventilation is mandatory for therapy shelters when accelerating potentials are higher than 10 MV. Collimator materials directly exposed to radiation over long time could also present a risk in radiation protection of staff involved in repair or dismantling of the devices.
The high energy beams (up to 250 MeV) used in proton therapy allow multiple reaction channels leading to radioactive nuclei. Activation of materials used in clinical proton beams has been studied for different purposes in radiation protection. These include calculations of shielding in treatment rooms (Urban and Kluson 2012), disposal of irradiated patient-specific compensators (Cesana et al 2010) or activation of patient tissues. The latter can be a source of radiation risk (Wu et al 2016) but the induced β+ activity can also be used for in vivo dose distribution determination with a positron emission tomography (PET) camera (Buitenhuis et al 2017). Patient activation has been of concern also due to additional organ doses (Jiang et al 2005, Brenner and Hall 2008, Howell et al 2016). Activation is caused both by the primary proton beam and secondary particles, mainly neutrons. Neutron spectra depend on the geometry and material composition of the beamline (Brenner and Hall 2008). Higher neutron contamination can be seen in passive scattering techniques than in pencil beam scanning (PBS). In PBS, the main component causing neutron contamination is the range shifter (Vykydal et al 2016). Generally, both fast and thermal neutrons can be found in the spectra (Farah et al 2015, Vykydal et al 2016).
Many works have tried to determine excitation functions and activation cross sections of proton induced reactions. These investigations have also been done on materials used in proton treatment rooms, including phantoms and detectors for routine measurements (Hermanne et al 2014, Ditrói et al 2016a, 2016b, Garrido et al 2016). Analytical models of activation calculation around medical cyclotrons have been provided in international guidelines (NCRP 2003) and scientific literature has discussed activation of treatment room components in terms of radiation protection (Infantino et al 2015). Radiation protection recommendations for ion beam therapy facilities have been issued (PTCOG 2010, Wroe and Rightnar 2012, Horton and Eaton 2017).
The above mentioned works are just examples of available publications. In the literature, however, activation of quality assurance (QA) detectors and phantoms and its direct consequences in radiation protection have not been studied explicitly. Limited understanding of the activation process (abundancies, half-lives and emission characteristics) could result in unnecessary exposure to the personnel. Particularly, higher exposures could be reached during commissioning of therapy beams when QA devices are exposed to high amounts of radiation. Another issue arises when storing or transporting previously irradiated detectors and phantoms outside the controlled area, for example for a service intervention.
This work addresses detector and phantom activation as measured at the Proton Therapy Center Czech s.r.o. (PTC), treating with pencil beam scanning. This centre is equipped with an IBA Proteus®PLUS system and a C230 cyclotron. IBA Dosimetry GmbH dosimeters, phantoms and other QA tools are used for clinical measurements. After controlled irradiation of selected devices and material samples, these were evaluated on a high resolution gamma spectrometer in order to determine the longer lived activation products and their activities. Activation nuclide vectors involved need to be known in order to fulfill legal requirements, as authorities in some countries require calculation of nuclide inventories for the purposes of radiation protection. Another goal was to quantify the radiation risk for the personnel working with these devices on a daily basis.
2. Materials and methods
2.1. Measured objects, setup and irradiation
Five IBA Dosimetry products (MatriXX PT, PPC05 and Stingray ionization chambers, Zebra and Lynx) and six component samples (Blue Phantom rail, RW3 slabs, a piece of PMMA and thin samples of titanium, copper and carbon fibre plastic) were selected for this activation study. Understanding activation of raw materials separately will help to understand activation of complex products. MatriXX PT is a 2D ionization chamber array with 1020 pixels, PPC05 is a parallel-plate ionization chamber, Stingray is a large beam-integrating parallel-plate ionization chamber, Zebra is a 180 channel multi-layer ionization chamber used to measure the depth dose deposition of a particle beam; Zebra is composed of copper-electrode parallel plate chambers and near water equivalence plastic separator plates which give the instrument a water-equivalent length of 33 cm; the housing is made out of aluminium and plastic materials, Lynx is a 2D beam profile imaging system, based on a scintillation plate (plastics and gadolinium oxysulfide) combined with an optical imaging system (mirror, lens and a CCD camera), Blue Phantom is a 3D scanning water tank.
Irradiation was carried out at the PTC in Prague in a fixed beam room, with a 220 MeV scanned proton pencil beam. Irradiation geometry is shown in figure 1 and irradiation conditions are described in table 1. The spot size at 220 MeV is ~4 mm (sigma at isocentre in air). IBA universal nozzle was used in all cases, as well as 10 MU per spot. Due to the HPGe detector geometry, Lynx was irradiated with 8 cm horizontal offset (vertically centred), otherwise the irradiated part would not fit inside the detector opening. For Zebra, vertical offset 3.5 cm and horizontal offset 3.5 cm was used, in order to partially activate its aluminium housing that may be irradiated by primary beams during commissioning of fields larger than the Zebra entrance window. Such a practice is part of normal operation of the device, as mentioned for example in Dhanesar et al (2013). The selected geometry can be considered as representative for clinical operation and activation.
Table 1. Irradiation conditions for different setups.
| Setup1 | Setup 2 | Setup3 | |
|---|---|---|---|
| Irradiated objects: | RW3 slabs (4 cm thickness) | PMMA (2.5 cm thickness) | Zebra |
| MatriXX PT | Blue Phantom rail | ||
| Lynx (8 cm horizontally from isocentre) | Stingray PPC05 | ||
| Carbon fibre (1 mm thickness) | |||
| Copper (1 mm thickness) | |||
| Titanium (2 mm thickness) | |||
| Irradiation conditions: | PBS beam, 220 MeV, 5 × 5 cm2 field, 135 200 MU, spot spacing: 2 mm, centred at isocentre | PBS beam, 220 MeV, 5 × 5 cm2 field, 133 547 MU, spot spacing: 2 mm, centred at isocentre | PBS beam (220 MeV, 7 × 7 cm2 field, 140 223 MU, spot spacing: 2 mm), 3.5 cm in X and Y from isocentre |
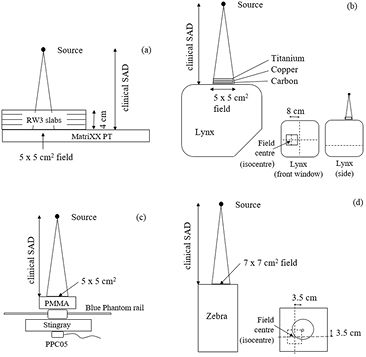
Figure 1. Irradiation geometry: (a) setup 1—MatriXX PT, RW3 slabs, (b) setup 1—Lynx, carbon fibre, copper, titanium, (c) setup 2—PMMA, Blue Phantom rail, Stingray, PPC05, (d) setup 3—Zebra.
Download figure:
Standard image High-resolution imageA number of MU was selected as an approximation of a typical commissioning scenario. However, commissioning times can vary significantly. Here, 1 MU corresponds approximately to 1.87 × 10¹⁰ protons.
2.2. Spectrometry measurement
2.2.1. Detection system
All samples were measured with a gamma spectrometry system at the Faculty of Nuclear Sciences and Physical Engineering of the Czech Technical University in Prague. This system consists of a HPGe coaxial detector (Canberra) with integrated preamplifier. The signal of the detector was processed by multichannel analyser Multiport II (Canberra). The software used for spectra acquisition and evaluation was Genie 2000, version 3.1 (Canberra).
The system is suitable for measurement of gamma radiation in energy region 50–3000 keV with its high energy resolution (1.89 keV at 1.33 MeV, 60Co) and a measured relative efficiency of 32.3% at 1.33 MeV.
The detector itself is placed in a shielding with 10 cm thickness of lead and 2 mm layer of copper. The entrance to the shielding is 18 cm in diameter, therefore some samples could not be placed inside the shielding (Lynx, Zebra, MatriXX PT, Blue Phantom rail and RW3 slabs) and were placed on top of it (see figure 2).

Figure 2. Measurement and simulated geometry of the HPGe detector and some of the large size samples—(a) MatriXX PT, (b) Blue phantom rail, (c) Zebra, (d) Lynx. This geometry was used for efficiency curve estimation using Monte Carlo and for acquisition of spectra (of both background and irradiated devices). The green cylinder represents the sensitive volume of the detector.
Download figure:
Standard image High-resolution image2.2.2. Background measurements
For all products, the background spectrum was measured prior to irradiation because some of them had an irradiation history and some could not be placed inside the shielding of the detector. The samples for background measurement (and then also for post-irradiation measurements) were placed into the most efficient geometry, i.e. inside the shielding, if possible, or on top of the shielding with irradiated part in the centre of the shielding entrance (see figure 2).
A quick analysis of background spectra did not reveal any short half-life radionuclides that would require decay correction between the background and later measurements.
2.2.3. Measurements after irradiation
All samples were measured two times after irradiation. The first measurement was taken at least 2 d after irradiation. The second measurement was made after 3–6 d after the first one. Most of the samples were measured for 24 h. Highly activated samples were measured for a shorter period of time. Some of the larger samples with low activities were measured for a longer period of time. Details are given in table 2.
Table 2. Spectra acquisition times for all samples.
| Sample | MatriXX PT | Lynx | Zebra rear window | Zebra front window | Stingray | PPC05 | Four RW3 slabs | Ti plates | Carbon disc | Cu disc | Piece of PMMA | Blue phantom rail |
|---|---|---|---|---|---|---|---|---|---|---|---|---|
| Measurement time after irradiation (days) |
5 | 4 | 3 | 7 | 5 | 6 | 4 | 7 | 5 | 6 | 4 | 5 |
| Acquisition time (hours) | 24 | 24 | 23.5 | 24 | 9.6 | 24 | 23.5 | 24 | 24 | 23.2 | 24 | 23.5 |
2.3. Efficiency calibration using Monte Carlo simulation
The energy calibration was made at the beginning of the first measurement using standards provided by the Czech Metrology Institute. The geometry of samples does not correspond to any of the standard certified geometries. The efficiency calibration was therefore made by means of Monte Carlo simulation, specifically using MCNP6 code.
The geometry model of the detector for MCNP was previously made at our department. The geometry model for each sample was made for the purpose of this study. The source of radiation was defined as a volume source of gamma radiation corresponding to the irradiated volume. The calculated quantity (the Tally) was the detection efficiency for full absorption of monoenergetic gamma radiation for different energies in the range 50–2500 keV. The results of simulation were entered into Genie 2000, fitted with polynomial of fifth order and saved as efficiency calibration for the particular sample.
Measurement geometry and Monte Carlo models of larger devices that did not fit inside the shielding of the HPGe detector are shown in figure 2. Equation (1) shows an example of the calculated efficiency curve for a low-efficiency scenario (Zebra) and equation (2) for a high-efficiency scenario (PPC05), both equations describe dependence of efficiency (η) on energy (E).


The method of efficiency calibration was verified by an experiment carried out in various geometries similar to the irradiated devices using standard sources from the Czech Metrology Institute and PMMA slabs—see figure 3. For the close geometry verification, both point sources (2× 241Am, 137Cs and 60Co) and Marinelli beaker (series of artificial radionuclides, covering the energy range 59 keV–1898 keV) were used. The point sources were placed 13 cm above the detector to reduce dead time below 10%. For the distant geometry verification, the same point sources were used, placed on PMMA slabs of different thicknesses, the 4 sources placed on top of each other, at various positions, both centred and non-centred (see figure 3). Additionally, another standard point source, also covering the energy range 59 keV–1898 keV, was used. For each setup, Monte Carlo simulation was performed as well as measurement. Detection efficiency determined from the simulation (recalculated to number of counts) was compared to the number of counts determined from the measurement. Apart from the 50–100 keV region, where the relative difference was almost 20%, above 100 keV (and up to 1.9 MeV) the difference was lower than 11%. The mean relative difference (calculated from 61 comparisons in total) was 6.8%.
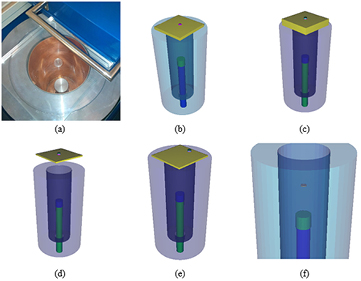
Figure 3. Example of standard point source geometries used for verification of the efficiency calibration method—(a) photo of the distatnt geometry (point source placed on PMMA slabs), (b) distant geometry—point sources placed on 2 cm PMMA, (c) distant geometry—point sources placed on 5 cm PMMA, (d) distant geometry—point sources placed on 1 cm PMMA, 11 cm (or 22 cm) above the shielding entrance, (e) distant geometry—point sources non-centred, (f) close geometry—point source in the shielding, 13 cm above the detector.
Download figure:
Standard image High-resolution image2.4. Homogeneity of activation
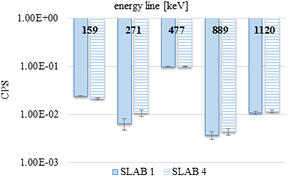
The homogeneity of activation needs to be discussed more in detail because it was not accounted for. The source of radiation in the Monte Carlo models was supposed to be a homogeneous volume source while the real distribution of activation products could be inhomogeneous due to change in activation cross sections along the 220 MeV proton beam depth dose curve. This might affect the predicted efficiency curves. We expect thin samples to be irradiated homogeneously because their whole irradiated area lay in the plateau region of the depth dose curve. This was experimentally studied by acquiring spectra for two RW3 slabs individually (each slab 1 cm thick)—for the first and the fourth slab in the direction of proton beam during irradiation (see figure 1). Both slabs lay in the plateau region during irradiation. Their spectra were compared to see if there are any changes in activation along the beam path. Peaks which were compared were those for the long half-life radionuclides identified in the RW3 slabs sample. This choice should minimize the effect of radionuclide decay between the measurement of the first (15.7 h acquisition) and the fourth slab (20 h acqusition). The results of this analysis are presented in figure 4 and table 3.
Table 3. Homogeneity of activation—comparison of selected peaks identified in two RW3 slabs that lay at different depths in the beam path.
| Radionuclide | Energy (keV) | SLAB 1 | SLAB 4 | ||||
|---|---|---|---|---|---|---|---|
| Area | Uncertainty | Area | Uncertainty | ||||
| (CPS) | (CPS) | % | (CPS) | (CPS) | % | ||
| 47Sc | 159 | 2.37 × 10⁻² | 6.39 × 10⁻⁴ | 2.7 | 2.10 × 10⁻² | 1.13 × 10⁻³ | 5.4 |
| 44mSc | 271 | 6.44 × 10⁻³ | 1.71 × 10⁻³ | 26.6 | 1.07 × 10⁻² | 1.60 × 10⁻³ | 15.0 |
| 7Be | 477 | 9.61 × 10⁻² | 1.68 × 10⁻³ | 1.7 | 9.64 × 10⁻² | 1.51 × 10⁻³ | 1.6 |
| 46Sc | 889 | 3.64 × 10⁻³ | 7.17 × 10⁻⁴ | 19.7 | 4.30 × 10⁻³ | 7.07 × 10⁻⁴ | 16.4 |
| 46Sc | 1120 | 1.08 × 10⁻² | 7.73 × 10⁻⁴ | 7.2 | 1.15 × 10⁻² | 7.32 × 10⁻⁴ | 6.4 |
Figure 4. Homogeneity of activation—comparison of selected peaks identified in two RW3 slabs that lay at different depths in the beam path.
Download figure:
Standard image High-resolution image
This experiment revealed that the distribution of activation products can be considered as homogeneous within the volume of samples (with similar or smaller water equivalent thickness as compared to four RW3 slabs) placed in the plateau region. Regarding the irradiation geometry and material composition of samples in our experiment, we might expect that all samples except for Zebra were irradiated homogeneously. (Lynx, having a large volume, consists mostly of air and can be considered a thin sample.) Generally, however, proton energy losses and activation cross sections depend on material composition and this must be considered for different types of samples and depth. Our conclusion is only valid for the proton beam energy used here (220 MeV). Therefore, our conclusion cannot be used in a different type of study.
2.5. Evaluation of spectra
2.5.1. Evaluation sequences
All spectra were evaluated by Genie 2000 using a pre-set analysis sequence. This sequence consists of the following steps:
- Peak analysis
- Background subtraction
- Efficiency correction
- Nuclide identification, activity calculation and interference correction
- Detection limits calculation—Currie MDA
The nuclide identification step is library-based, our library contained all radionuclides available in Genie 2000 libraries up to Z = 32. (Heavier elements were not expected in the irradiated objects based on information from the manufacturer). For identified lines, the algorithm calculates activities and then the weighted mean activity for each radionuclide. The algorithm automatically calculates the correction for acquisition time decay and reports activity at the start of the measurement.
The results of this part of analysis are interference corrected. An interference set is defined as two or more radionuclides that have at least one common peak that was not resolved as a multiple peak. The activities of such radionuclides are calculated as a solution to a linear least square fit. The Currie MDA algorithm is based on methods developed by Currie (1968).
The number of unidentified peaks (those that are not clearly the background fluctuation or a result of any other feature (e.g. summation)) did not exceed 10 for any of the measured samples.
2.5.2. Post processing analysis
All data post-processing was based on standard methods used in gamma spectrometry data evaluation. The analysis provided by Genie 2000 and described above took into account only the spectrum for which the reports were generated. However, for most of the samples (except for Zebra, which was measured once with its front window and once with its rear window facing the HPGe detector) there were at least two measurements in the same geometry taken with a minimum of 3 d difference. Based on the comparison of these two spectra (taking the half-life of the radionuclides into account), an additional analysis was made in order to state more precisely the activity of identified radionuclides. The presence of some of the radionuclides was rejected based on the results of this additional analysis. In the Blue Phantom rail, as an example, the 1274 keV line was assigned to 29Al, but in the second spectrum only. Because 29Al has a half-life of 6.6 min, it was concluded that this line belongs to 22Na instead. Careful post processing was needed for radionuclides which were identified based on the 511 keV line and their other important lines (with high percent yields per decay) were missing. Since the 511 keV peak in this case is a complicated mix of β+ emitters, we decided to exclude all pure β+ emitters from our results. Activities of β+ emitters with other than 511 keV lines were part of the standard evaluation process.
Other facts related to the nature of the problem were also taken into account in this post processing analysis. The main parameter which needed to be considered in this part was the half-life and possible daughter nuclides, rejecting radionuclides with extremely short (a few minutes or less) half-lives that are not daughters of other radionuclides that might be present in the sample. Considering the fact that first measurement was made at least 2 d after irradiation, we should not be able to detect such short-lived products, unless they were part of a decay chain in equilibrium with mother nuclides.
The correction of activity calculated by Genie 2000, where it was necessary, was also part of this post processing analysis. The most significant were corrections for interfering gamma lines (e.g. energy 1037 keV is common for 48Sc and 56Co). When interferences occurred, activity was estimated by the non-interfering lines (in this example 1312 keV for 48Sc and 846 keV for 56Co; all radionuclides found had some non-interfering lines). Correction on true coincidence proved to be insignificant.
3. Results
Various radioactive isotopes with different half-lives and activities were found in the activated samples. However, this study focuses on those that might be of importance if the devices are used in the long term. Short-lived radionuclides, which might be a radiation protection issue for the staff immediately after irradiation of the device (depending on the conditions of use), were not addressed here. Pure beta emitters were not addressed, either, as they are mostly absorbed in bulk materials and do not contribute considerably to radiation exposure.
There are several possibilities for interpretation of these results. Activities measured in this experiment were relatively low, however, they are comparable to activity concentration limits for exemption or clearance of radioactive objects. Legal requirements in this area vary among countries. The new Czech legislation that entered into force in January 2017 adopts the concepts given in IAEA Safety Standard Series, Safety Guide No. RS-G-1.7 (IAEA 2004). According to these guidelines, the relevant activity concentration value for a mixture of artificial radionuclides in an object under consideration is calculated according to the formula below:
where Ci is the average specific activity in Bq g−1 of the radionuclide i in the whole object, CLi is the activity concentration limit for that radionuclide given in Bq g−1 in IAEA guidelines (IAEA 2004) and n is the number of artificial radionuclides in the considered object. According to Czech legislation, objects that fulfill this criterion can be released to public areas. That is, they can be taken out of the controlled area and transported to a different working site or send to the factory for recalibration without further restrictions.
Activity of all identified radionuclides 5 d after irradiation was recalculated to specific activity in Bq g−1. Weight of the objects was estimated approximately with the help of information from the manufacturer. According to (3), the IAEA activity concentration value was calculated for all samples. In two cases, namely the ionization chamber PPC05 and Zebra, it exceeds the level for exemption or clearance. Tables 4 and 5 show results for both investigated devices. Results for Zebra are reported separately for both measurement geometries (either the Zebra front or rear window facing the HPGe detector) because differences were seen in some cases. This was expected due to inhomogeneous activation and it is further discussed in the discussion part. However, these values are valid for the beam setup (number of MUs, energy, field size) and geometry used in our experiment. These high MU values (133 × 103 to 140 × 103 MU per setup) were chosen with regard to possible intense irradiation of the devices during commissioning of proton beams. During routine clinical use, it is not expected to deliver such high numbers of protons in a single session. For some of the identified radionuclides, the activity concentration limit is not given in IAEA guidelines (IAEA 2004). These radionuclides were excluded from calculation of the above mentioned index, but this should not significantly affect its value.
Table 4. PPC05 chamber—identified radionuclides, activity 5 d after irradiation and IAEA activity concentration value for exemption or clearance.
| MUs given: 133 547 | ||||||
|---|---|---|---|---|---|---|
| Radionuclide | Half-life (days) | Measured activity 5 d after irradiation (Bq) | Uncertainty (%) | Calculated specific activity 5 d after irradiation (Bq g−1) | IAEA exemption/clearance value (Bq g−1) | IAEA sum formula (Ci/CLi) |
| 7Be | 53.12 | 126.07 | 1.09 | 4.669 | 10 | 0.047 |
| 24Na | 0.62 | 2.34 | 4.70 | 0.087 | 1 | 0.090 |
| 44Sc | 0.16 | 151.31 | 10.00 | 5.604 | N/A | N/A |
| 44mSc | 2.44 | 1.20 | 3.33 | 0.044 | N/A | N/A |
| 46Sc | 83.79 | 0.35 | 5.71 | 0.013 | 0.1 | 0.100 |
| 47Sc | 3.35 | 1.63 | 9.82 | 0.060 | 100 | 0.001 |
| 48Sc | 1.82 | 0.14 | 7.14 | 0.005 | 1 | 0.010 |
| 48V | 15.97 | 1.28 | 10.16 | 0.047 | 1 | 0.050 |
| 51Cr | 27.70 | 3.57 | 5.88 | 0.132 | 100 | 0.001 |
| 52Fe | 0.34 | 1.28 | 10.94 | 0.047 | 10 | 0.005 |
| 52Mn | 5.59 | 3.82 | 1.05 | 0.141 | 1 | 0.140 |
| 54Mn | 312.05 | 0.43 | 9.30 | 0.016 | 0.1 | 0.200 |
| 56Co | 77.24 | 1.21 | 9.92 | 0.045 | 0.1 | 0.400 |
| 56Ni | 6.08 | 0.12 | 8.33 | 0.004 | N/A | N/A |
| 57Co | 271.74 | 0.64 | 3.13 | 0.024 | 1 | 0.002 |
| 57Ni | 1.48 | 1.28 | 4.69 | 0.047 | N/A | N/A |
| 58Co | 70.86 | 4.24 | 1.42 | 0.157 | 1 | 0.160 |
| 59Fe | 44.50 | 0.14 | 28.57 | 0.005 | 1 | 0.010 |
| 65Zn | 243.93 | 0.45 | 6.67 | 0.017 | 0.1 | 0.200 |
| 67Cu | 2.58 | 0.90 | 6.67 | 0.033 | N/A | N/A |
| 69mZn | 0.57 | 0.51 | 27.45 | 0.019 | 10 | 0.000 |
| IAEA activity concentration value 5 d after irradiation: | 1.846 | |||||
N/A—value not given in IAEA (2004).
Table 5. Zebra—identified radionuclides, activity 5 d after irradiation and IAEA activity concentration value for exemption or clearance. Reported separately for two different spectrometry geometries.
| MUs given: 140 223 | ||||||
|---|---|---|---|---|---|---|
| Zebra's front window |
||||||
| Radionuclide | Half-life (days) | Measured activity 5 d after irradiation (Bq) | Uncertainty (%) | Calculated specific activity 5 d after irradiation (Bq g−1) | IAEA exemption/clearance value (Bq g−1) | IAEA sum formula (Ci/CLi) |
| 7Be | 53.12 | 3.71 × 10⁴ | 1.90 | 3.709 | 10 | 0.371 |
| 22Na | 949.37 | 97.02 | 10.31 | 0.010 | 0.1 | 0.097 |
| 44Sc | 0.16 | 6.78 × 10⁸ | 10.00 | 6.78 × 10⁴ | N/A | N/A |
| 44mSc | 2.44 | 2712.9 | 4.75 | 0.271 | N/A | N/A |
| 46Sc | 83.79 | 398.23 | 4.52 | 0.040 | 0.1 | 0.398 |
| 47Ca | 4.54 | 129.16 | 30.23 | 0.013 | 10 | 0.001 |
| 47Sc | 3.35 | 6288.65 | 10.00 | 0.629 | 100 | 0.006 |
| 48V | 15.97 | 3656.7 | 10.01 | 0.366 | 1 | 0.366 |
| 51Cr | 27.70 | 2.06 × 10⁴ | 10.00 | 2.056 | 100 | 0.021 |
| 52Mn | 5.59 | 9940.84 | 0.92 | 0.994 | 1 | 0.994 |
| 54Mn | 312.05 | 937.53 | 3.94 | 0.094 | 0.1 | 0.938 |
| 56Co | 77.24 | 577.06 | 4.16 | 0.058 | 0.1 | 0.577 |
| 56Ni | 6.08 | 1281.46 | 4.14 | 0.128 | N/A | N/A |
| 57Ni | 1.48 | 1105.09 | 10.59 | 0.111 | N/A | N/A |
| IAEA activity concentration value 5 d after irradiation: | 3.769 | |||||
| Zebra's rear window |
||||||
|---|---|---|---|---|---|---|
| Radionuclide | Half-life (days) | Measured activity 5 d after irradiation (Bq) | Uncertainty (%) | Calculated specific activity 5 d after irradiation (Bq g−1) | IAEA exemption/clearance value (Bq g−1) | IAEA sum formula (Ci/CLi) |
| 7Be | 53.12 | 2.07 × 10⁴ | 10.00 | 2.073 | 10 | 0.207 |
| 22Na | 949.37 | 679.96 | 6.05 | 0.068 | 0.1 | 0.680 |
| 24Na | 0.62 | 2954.38 | 1.49 | 0.295 | 1 | 0.295 |
| 43K | 0.93 | 91.44 | 11.67 | 0.009 | 10 | 0.001 |
| 44Sc | 0.16 | 0.21 | 9.52 | 0.000 | N/A | N/A |
| 44mSc | 2.44 | 1007.03 | 3.44 | 0.101 | N/A | N/A |
| 46Sc | 83.79 | 173.98 | 14.18 | 0.017 | 0.1 | 0.174 |
| 47Ca | 4.54 | 212.44 | 19.42 | 0.021 | 10 | 0.002 |
| 47Sc | 3.35 | 308.66 | 19.52 | 0.031 | 100 | 0.000 |
| 48Sc | 1.82 | 54.73 | 9.99 | 0.005 | 1 | 0.005 |
| 48V | 15.97 | 3407.52 | 10.00 | 0.341 | 1 | 0.341 |
| 51Cr | 27.70 | 6131.85 | 7.18 | 0.613 | 100 | 0.006 |
| 52Mn | 5.59 | 6850.67 | 0.93 | 0.685 | 1 | 0.685 |
| 54Mn | 312.05 | 626.10 | 11.11 | 0.063 | 0.1 | 0.626 |
| 55Co | 0.73 | 114.39 | 4.91 | 0.011 | 10 | 0.001 |
| 56Co | 77.24 | 362.17 | 6.64 | 0.036 | 0.1 | 0.362 |
| 56Ni | 6.08 | 372.14 | 9.60 | 0.037 | N/A | N/A |
| 57Ni | 1.48 | 381.44 | 5.15 | 0.038 | N/A | N/A |
| IAEA activity concentration value 5 d after irradiation: | 3.387 | |||||
aRear window = closer to the Bragg peak. N/A—value not given in IAEA (2004).
Zebra and PPC05 chamber results are reported in detail because for those devices the activity concentration limit is exceeded. Zebra is the only investigated device that fully stops the proton beam and therefore activation is higher (also a bigger field size was used for irradiation). For other investigated items, table 6 lists the estimated IAEA activity concentration values 5 d after irradiation. It shows which of them might potentially be considered as activated above the limits when high numbers of MU are delivered in one session (here 133 × 103 to 140 × 103 MU). Regarding the different pieces of material (titanium plates, carbon disc, copper disc, piece of PMMA and Blue phantom rail), they would normally be a part of a larger device and the activity concentration value would be changed accordingly. Averaging the activity over a larger mass of that device might significantly lower the activity concentration value and the respective device might fall below the limit for exemption or clearance. Apart from Zebra, none of the large devices (MatriXX PT, Lynx, Stingray and four RW3 slabs) exceed the limit. This means that, according to Czech legislation, they could be transported out of the controlled area, to a different site or for a service intervention, 5 d after irradiation without further restrictions, even after this specific-long irradiation sessions or similar that occur during beam commissioning.
Table 6. Activity concentration values for exemption or clearance calculated according to IAEA guidelines (IAEA 2004) for all samples. Values exceeding limits are highlighted.
| MatriXX PT | Lynx | Zebra front window | Zebra rear window | Stingray | PPC05 | Four RW3 slabs | Ti plates | Carbon disc | Cu disc | Piece of PMMA | Blue phantom rail | |
|---|---|---|---|---|---|---|---|---|---|---|---|---|
| MUs given | 135 200 | 135 200 | 140 223 | 135 200 | 133 547 | 133 547 | 135 200 | 135 200 | 135 200 | 133 547 | 133 547 | 133 547 |
| IAEA activity concentration value | 0.134 | 0.137 | 3.769 | 3.387 | 0.328 | 1.846 | 0.287 | 28.894 | 1.670 | 16.459 | 1.599 | 7.956 |
Complete information on detected radionuclides and their activities can be found as supplementary data (stacks.iop.org/PMB/63/115014/mmedia) in the online version of the article. This information is crucial for calculating nuclide inventories and understand nuclide vectors in order to fulfill the legal requirements set by respective authorities in some countries. For the rest of the items (not mentioned in tables 4 and 5), table 7 lists at least the most important radionuclides found, namely those with activity above 100 Bq remaining 5 d after irradiation and/or with a half-life longer than 10 d.
Table 7. Important radionuclides (activity above 100 Bq 5 d after irradiation and/or half-life longer than 10 d) found in the rest of the investigated items. Complete list of detected radionuclides and their activities is reported as supplementary data in the online version of the article.
| Tested item | Important radionuclides |
|---|---|
| MatriXX PT | 7Be, 22Na, 46Sc, 48V, 54Mn, 56Co, 57Co |
| Lynx | 7Be, 48V, 54Mn, 56Co, 57Co, 58Co, 60Co |
| Stingray | 7Be, 46Sc, 48V, 51Cr, 54Mn, 56Co |
| RW3 slabs | 7Be, 44mSc, 46Sc, 47Sc |
| Ti plates | 44Sc, 44mSc, 46Sc, 47Sc, 48V |
| Carbon disc | 7Be |
| Cu disc | 7Be, 46Sc, 48V, 51Cr, 54Mn, 56Co, 57Co, 58Co, 59Fe, 60Co, 65Zn |
| Piece of PMMA | 7Be |
| Blue phantom rail | 7Be, 22Na, 44Sc, 44mSc, 46Sc, 47Sc, 48V, 51Cr, 52Mn, 54Mn, 56Co, 57Ni, 58Co |
Usually, such high numbers of MU are not delivered to the devices during routine clinical measurements. In order to estimate the risk coming from these, the values can be rescaled to a typical clinical scenario. As an example, table 8 reports the results for Zebra (which, according to table 5, exceeded the clearance limit when a high number of MUs was delivered). At the PTC in Prague, Zebra is used for daily energy checks and is irradiated with 100 MU for three energies. These morning energy checks are performed only in one treatment room. During monthly QA tests, this device is additionally irradiated with 1200 MU (12 different energies). Monthly tests are performed in all four treatment rooms at the PTC in Prague, usually one test per week. Supposing that there are five working days per week and 52 weeks per year, a rough estimation of the specific activity after one year of clinical use can be made. This estimation takes into account the decay law and periodical irradiation of the device but no additional use of Zebra. For the sake of simplicity, differences in device activation at different energies are neglected here, as well as differences in geometry (beam centering and field size—PTC in Prague does not irradiate Zebra with fields larger than the entrance window, so results will be overestimated), as well as public holidays. Isotopes for which there is no activity concentration limit given in IAEA guidelines (IAEA 2004) are left out in the calculation. The activity concentration limit after one year of clinical use is exceeded for both spectrometry geometries, as reported in table 8. Even though there are uncertainties and simplified assumptions made for the calculation of this value, it can be concluded that care should be taken because activity in Zebra can cumulate over time.
Table 8. Conservative estimation of specific activity and IAEA activity concentration value for Zebra after one year of clinical use (supposing the highest energy—highest activation). Reported separately for two measurement geometries at the spectrometer.
| Radionuclide | Half-life (days) | Zebra's front window facing the HPGe detector | Zebra's rear window facing the HPGe detector | ||
|---|---|---|---|---|---|
| Specific activity after 1 year of use (Bq g−1) | IAEA activity concentration value | Specific activity after 1 year of use (Bq g−1) | IAEA activity concentration value | ||
| 7Be | 53.12 | 0.8439 | 1.221 | 0.4716 | 2.156 |
| 22Na | 949.37 | 0.0086 | 0.0602 | ||
| 24Na | 0.62 | Low | 0.8324 | ||
| 43K | 0.93 | Low | 0.0042 | ||
| 46Sc | 83.79 | 0.0133 | 0.0058 | ||
| 47Ca | 4.54 | 0.0006 | 0.0010 | ||
| 47Sc | 3.35 | 0.0328 | 0.0016 | ||
| 48Sc | 1.82 | Low | 0.0005 | ||
| 48V | 15.97 | 0.0308 | 0.0287 | ||
| 51Cr | 27.70 | 0.2660 | 0.0793 | ||
| 52Mn | 5.59 | 0.0498 | 0.0343 | ||
| 54Mn | 312.05 | 0.0654 | 0.0437 | ||
| 55Co | 0.73 | Low | 0.0143 | ||
| 56Co | 77.24 | 0.0180 | 0.0113 | ||
| MUs given over a year | 140 400 | ||||
Similarly, such an estimation could be made for other devices taking into account the clinical practice at a particular treatment centre. Another example is given in table 9 for Lynx. At the PTC in Prague, it is used frequently (for daily, weekly, monthly and annual QA tests in all 4 treatment rooms—details will not be given here). Despite its relatively low activation after 135 200 MU delivered in our experiment (see supplementary data), a number of long-lived products were observed, which makes its activity concentration value after one year of clinical use higher. In reality, PTC in Prague uses two Lynxes, so their activity concentration value is approximately just 0.560 and the IAEA limit is not exceeded.
Table 9. Conservative estimation of specific activity and IAEA activity concentration value for Lynx after one year of clinical use (supposing use of the same device for all tests—not true in reality).
| Radionuclide | Half-life (days) | Specific activity after 1 year of use (Bq g−1) | IAEA activity concentration value |
|---|---|---|---|
| 7Be | 53.12 | 0.1888 | 1.120 |
| 47Ca | 4.54 | 0.0012 | |
| 47Sc | 3.35 | 0.0036 | |
| 48V | 15.97 | 0.0027 | |
| 52Mn | 5.59 | 0.0055 | |
| 54Mn | 312.05 | 0.0802 | |
| 56Co | 77.24 | 0.0075 | |
| 57Co | 271.74 | 0.0201 | |
| 58Co | 70.86 | 0.0147 | |
| 60Co | 2087.80 | 0.0181 | |
| MUs given over a year | 1859 540 | ||
4. Discussion
Our analysis revealed a number of activation products induced in the samples by proton or neutron interactions.
The uncertainties reported in tables 4 and 5 are taken from the Genie analysis and they only take into account the uncertainty of peak area calculation and the uncertainty of efficiency calibration. However, there are other types of uncertainties as well (geometry and materials in the Monte Carlo models, inhomogeneity of activation, statistical error). The overall uncertainty of the given results may be in the order of 30%. This was expected and the main goal of this study was to determine the nuclide vectors and compare different types of materials used by the QA devices' manufacturer.
Most identified radionuclides are in accordance with previous expectations based on, for example, the NCRP report (NCRP 2003). The NCRP document provides an overview of proton interactions in accelerator environments with regard to radiation protection. It lists common radionuclides that occur due to activation processes. However, it does not focus on clinical facilities in particular. Activation processes in the field of clinical proton beams are comprehensively described by Kiselev (2013). Even though reaction channels at proton accelerators, both research and clinical ones, have been described in literature, the situation is different when working with complex detectors and phantoms. To be able to draw any conclusions regarding radiation protection, the exact geometry and material composition of the devices would have to be known, including ideally the isotopic composition of each material. A complementary Monte Carlo simulation of the experiment performed in this paper would be useful for comparison. Nonetheless, reliable results of a Monte Carlo study would need the exact knowledge of the devices properties as well as the beam properties and would depend on the data library used for calculations. Such a comparison performed by Kiselev (2013) illustrates that material composition is an important source of uncertainty when calculating nuclide inventories. Our paper is based on spectrometry measurements only, but provides ready-to-use guidelines for the activation of particular products manufactured by IBA Dosimetry. To our knowledge, this is the first study of this type. It must be pointed out that any radiation protection issues at a particular site should be addressed taking into account the typical use (geometry and frequency of irradiation, number of MUs) of these devices at that treatment centre.
In addition, production cross sections of various isotopes depend on the energy of incident protons. This experiment was performed with the (almost) highest energy available at the PTC in Prague (220 MeV), but different energies are used for treatment. The depth of interaction in a given material as well as position of the sample along the beam path also needs to be taken into account and kept in mind if results of this study are used for any further purposes. At the PTC in Prague, most QA tests are performed without build-up, which corresponds to the geometry used in this experiment, except for the MatriXX PT placed in the DigiPhant PT phantom. A further step could be to repeat this experiment for multiple positions along the depth dose curve or for lower energies (which is equivalent in terms of activation; only Zebra, which fully stops the proton beam, would be less activated with lower energies). However, a complementary Monte Carlo study might be more efficient here.
The production rate of an isotope depends on the number of target nuclei and on the number of protons incident per second on the target material, which itself depends on MU, spot spacing, depth and other parameters. The total number of protons in the beam can be expressed, which is common in the field of medical physics, in terms of monitor units (MU). Thus, the total activity of a certain radionuclide in the activated sample depends on the number of MU delivered, supposing that other conditions remain constant, so it was practical to report all results in relationship to MU. At our facility, 1 MU corresponds approximately to 1.87 × 10¹⁰ protons.
4.1. Zebra
Results for Zebra in tables 5 and 8 are reported separately for the two measurement geometries used for spectrometry (either the front or rear window facing the detector). Significantly different activities were seen for some radionuclides. This can be explained by additional uncertainties for this particular device. Namely, activation cross sections along the beam path change as protons lose their energy and Zebra fully stops the proton beam, unlike other investigated samples. Due to unfavorable geometry for spectrometry measurements and complex material composition of Zebra, different amounts of gamma photons with different energies could reach the HPGe detector for the two geometries. The Bragg peak region of Zebra gets higher dose while some layers are not irradiated and behave as shielding. The Monte Carlo efficiency model was simplified and did not take self attenuation fully into account. Some short-lived radionuclides would not have been detected during the later measurement, which took place 5 d after the first one.
The calculation of typical activity of Zebra and Lynx after one year of clinical use takes into account the decay law and the periodic irradiation of the device with a known number of MUs supposing the same irradiation conditions that were used in this experiment. This is not necessarilly true. Here, the (almost) highest available energy was used, which means the longest possible beam path in the device and hence a higher activation. In this sense, our estimation is conservative. Normally, different energies (and geometries) are used clinically. The final values are valid at the moment when the last daily and monthly QA tests of that year have been finished. (This explains the high activity of the short-lived 24Na in table 8 for one of the setups). The real nuclide vectors might depend in detail on the special irradiation history, but for radiation protection considerations the stated values can be seen as representative.
4.2. Lynx
Knowing the material composition of Lynx, 22Na was also expected to be present among the identified radionuclides but could not be confirmed in this study. The cause could be the irradiation history of Lynx that brought additional uncertainties. Unlike other tested items, it had been used for QA in the clinic quite shortly before this experiment. So a high background was seen for Lynx, with 22Na already present due to its long half-life.
4.3. International regulations
The IAEA Safety Standard Series, Safety Guide No. RS-G-1.7 (IAEA 2004) was used to calculate the activity concentration values. Levels for exemption or clearance proposed in this document are also valid in the new Czech legislation. However, different international or national recommendations could be used. For example, in the German Radiation Protection Ordinance (Federal Office for Radiation Protection 2016), exemption levels differ for certain radionuclides and levels for isotopes not mentioned in (IAEA 2004) are given. Like for 44Sc and 44mSc, which in some cases would contribute significantly to the final activity concentration value. For PPC05 chamber, as an example, the activity concentration value would be 2.413 compared to 1.846, if missing values from IAEA (2004) were simply taken from Federal Office for Radiation Protection (2016). For Zebra (measured with the front window facing the detector) and titanium plates, it would be 6787.111 compared to 3.769 and 388.407 compared to 28.894, respectively. This big difference is due to the fact that these samples contained large amounts of 44Sc, which is not accounted for in IAEA (2004). For the rest of the investigated devices, the difference would be smaller than 3%. However, this approach (mixing exemption levels from different guidelines) is not correct if derivation of limits in these guidelines is not properly understood. Instead, all values should be recalculated according to the specific guideline, e.g. the German Radiation Protection Ordinance. This document gives exemption and (different types of) clearance levels separately. If our tables are recalculated with German levels for exemption (because clearance levels are missing for the same radionuclides as in IAEA (2004)), none of the investigated devices exceeds the limit, except for Zebra (measured with the front window facing the detector) and titanium plates, again because of 44Sc. It should be noted that this is a short lived radionuclide and our activity values are reported 5 d after irradiation. For a longer period of time, results would be quite different.
5. Conclusions
Gamma spectrometry of QA devices and material samples used clinically in scanning proton beams revealed a number of activation products. Metallic samples are generally more activated than plastics, and among them titanium, copper and aluminium were quantified. Therefore, results of this study will contribute to an optimized design of improved or new devices for proton beam QA.
Activities coming from a known amount of radiation were quantified for all isotopes and compared to internationally recommended levels of activity concentration for exemption and clearance. In addition, these activity values could be compared to national or international limits regarding legal regulations for transport of radioactive material, for example if the device needs to be sent to a different place or country for service.
Some devices proved to cumulate activity in time if used periodically in routine clinical practice. Care should also be taken when longer irradiation sessions take place, for example during commissioning of proton beams. However, the estimated activities after 133 547 to 140 223 MU at 220 MeV are rather comparable to limits for release to the public than to dose limits for radiation workers. As such, personal doses coming from a long-term use of these devices could have been estimated. Yet, these are believed to be negligible if optimization of radiation protection takes place, as the activity values are comparable only to limits for exemption. This assumption is supported by the fact that personal doses for radiation workers at the PTC in Prague hardly ever reach levels detectable by optically stimulated luminescence dosimeters.
This paper provides useful data to determine nuclide inventories, which are in most countries required by legal authorities for radiation protection purposes. Finally, a good knowledge of expected radionuclides is also very important to select appropriate instruments for routine contamination monitoring.
Acknowledgments
This research was funded by IBA Dosimetry GmbH through a research contract between IBA Dosimetry GmbH and Czech Technical University in Prague. We thank Sybelle Deloule and Sara La Civita from IBA Dosimetry GmbH for careful reading of the manuscript.