


ABSTRACT
Analyses of gamma-ray line emission in solar flares have provided information about conditions in flaring magnetic loops, the abundances of the chromosphere where the gamma rays are produced, and the composition and spectrum of the flare-accelerated ions. While laboratory measurements of the cross sections for production of the strongest lines seen in flare spectra are available, these measurements often only cover a limited range of projectile energies. In addition, the bulk of the gamma-ray emission arises from the numerous weaker lines for which there are no measurements. The gamma-ray de-excitation-line production code, developed originally by Ramaty, Kozlovsky, and Lingenfelter, has been and continues to be the primary theoretical tool used for analyses of solar-flare gamma-ray data. The code uses both measured cross sections and estimated cross sections where measurements are inadequate. We have improved the completeness and accuracy of this code in three ways. (1) We use recent cross section measurements to improve cross sections for those lines already explicitly included in the code and to provide cross sections for new explicit lines. (2) For the first time, we give a detailed evaluation of the unresolved-line "continuum" (i.e., all line emission not accounted for by the explicit lines in the code). Because adequate laboratory measurements for this emission are not available, the primary tool for this evaluation was the theoretical nuclear program TALYS. We explore how this unresolved-line continuum depends on parameters relevant for solar flares. (3) We use TALYS to improve those line cross sections where available laboratory measurements are inadequate and to provide cross sections for new explicit lines for which no measurements exist. Numerical cross section values for all lines explicitly addressed by the code and for the unresolved-line continua are given in the Appendix.
Export citation and abstract BibTeX RIS
1. INTRODUCTION
Nuclear interactions in solar flares produce gamma rays and neutrons. An important part of the gamma-ray emission results when flare-accelerated ions interact with the ambient solar atmosphere to produce nuclei in excited states. These nuclei promptly de-excite to produce gamma-ray lines, mostly at energies from 1 to 10 MeV, that can dominate flare radiation in this range. Lines resulting from interactions of accelerated protons and alpha (α) particles with ambient nuclei heavier than He are narrow (with fractional widths of about 2% of the line energy) because the relatively low recoil velocity of the heavy nuclei results in only moderate Doppler shifting of the photons. These reactions are referred to as direct reactions. Interactions of heavy accelerated ions with ambient H and He produce broad lines (with fractional widths of about 20%) because the heavy nuclei retain a large fraction of their initial velocities, resulting in significant Doppler shifting. These reactions are referred to as inverse reactions.
The foundation for understanding this de-excitation-line emission from solar flares was established in a series of papers by R. Ramaty, R. Lingenfelter, and B. Kozlovsky. In developing their gamma-ray line production code, Ramaty et al. (1979; hereafter RKL), considered the de-excitation-line photon spectrum to be composed of two components: those lines explicitly addressed by the code (both narrow and broad), and an underlying "unresolved-line continuum" that accounted for all remaining line emission.
The lines explicitly addressed by the code typically arise from transitions between the first few excited states and the ground state of the most abundant elements in the solar atmosphere. Here we refer to this component as the explicit-line component. Kozlovsky et al. (2002; hereafter KMR) updated the cross sections for the explicit lines using the extensive and systematic laboratory measurements that became available after RKL was published. Those measurements (Dyer et al. 1981, 1985; Narayanaswamy et al. 1981; Seamster et al. 1984; Lang et al. 1987; Lesko et al. 1988; Kiener et al. 1998) typically were of the gamma-ray line emission itself, and were performed with high-resolution Ge detectors at many particle energies and angles.
However, the range of projectile energies addressed by the measurements was often limited. In particular, α-particle energies only extended to about 6 MeV nucleon−1, many times not covering the important energy range of the cross sections. Also, some of the cross sections of proton- and α-spallation reactions peak above the energies addressed by the measurements. In this paper, we will update those explicit-line cross sections where new measurements have become available since KMR. We will also supplement and revise many of the cross section approximations and assumptions made in previous work, mainly through the use of the theoretical nuclear reaction program TALYS (Koning et al. 2005; Koning & Duijvestijn 2006; see Section 2). We will also add a number of new lines to the code for which no measurements are available, again using TALYS to provide the cross sections.
The unresolved-line continuum has not been addressed since the first approximation by RKL. In the RKL gamma-ray line production code, this component was treated as a true continuum, peaking in the 1–2 MeV region. Its photon energy distribution was estimated from low spectral-resolution laboratory measurements of the total gamma-ray spectrum for only a few target nuclei and at only a few projectile energies. RKL considered only proton interactions with Ne, Mg, Si, and Fe, and the spectra were assumed to be independent of projectile energy, binned in relatively wide photon-energy bins of 1 MeV. This representation of the continuum was thought to be adequate to reliably derive information about solar flares (such as abundance determinations of the ambient medium and accelerated proton and α-particle spectral indexes) based on measurements of the narrow lines.
However, determination of the accelerated-ion abundances, which are derived from measurements of the broad lines from inverse reactions, may be strongly affected by the spectral shape of the unresolved-line continuum assumed when fitting flare data. Furthermore, recent analyses of flare data have shown that even results based on narrow-line measurements can be affected by the assumed continuum spectral shape, especially if it has structure. Here, for the first time, we give a full and detailed evaluation of the unresolved-line continuum. Because adequate laboratory measurements for this component are either not available or not given in a usable form, we shall base our evaluations on calculations also provided by TALYS.
The improved code combines the advantages of the direct use of laboratory-measured cross sections for the strongest lines with an accuracy of ∼10%–15% and a modern nuclear-reaction code which can give a detailed account of thousands of weak nuclear lines forming the continuum with an accuracy of ∼30%. Because TALYS will serve as a principle tool for our evaluations, in Section 2 we demonstrate its validity, accuracy, and suitability for obtaining the desired cross sections and unresolved-line spectra. In Section 3, we update and extend the cross sections for the explicit lines already in the gamma-ray line production code and add new lines. In Section 4, we discuss the components of the unresolved-line continuum, how we develop them from the TALYS calculations, and their dependence on various physical parameters. We also show calculated spectra for specific flare conditions. In Section 5, we summarize and discuss how the results can be used in the study of solar-flare gamma-ray spectra.
2. THE NUCLEAR REACTION PROGRAM TALYS AND ITS VALIDATION
TALYS (http://www.talys.eu/) is a user-friendly, efficient code simulating nuclear reactions of 1 keV to 250 MeV projectiles using state-of-the-art nuclear models (such as optical, direct, pre-equilibrium, compound, and fission) and comprehensive libraries of nuclear data covering all main reaction mechanisms encountered in particle-induced nuclear reactions. TALYS has been used in astrophysical calculations of nuclear reaction rates (Goriely et al. 2008; Spyrou et al. 2008) and radioactive nuclei yields in solar flares (Tatischeff et al. 2006).
The TALYS authors and others have verified its accuracy by comparing calculated results with experimental data for a variety of nuclear reactions (e.g., Koning et al. 2005; Koning & Duijvestijn 2006; Broeders et al. 2006). The demonstrated success of TALYS is remarkable, but most of these tests and comparisons dealt with particle-emitting reactions on heavy targets. The various nuclear models used by global-nuclear programs such as TALYS usually work well for such reactions.
For solar flares, we are interested in gamma-ray-producing reactions involving proton and α projectiles with the most-abundant nuclei in the solar atmosphere: light- or medium-mass nuclei such as C, N, O, Ne, Mg, Si, S, and Fe. The few TALYS comparison tests for gamma-ray production have mostly been for neutron projectiles or for very heavy targets (Duijvestijn & Koning 2006; Koning et al. 2005). We have therefore extended the testing of TALYS to those gamma-ray-producing proton and α reactions involving light- or medium-mass targets where experimental data are available. As examples, the thick curves in Figure 1 show the cross sections calculated with TALYS for production of the strong gamma-ray lines at 4.44, 1.37, 0.847, and 1.238 MeV from proton projectiles on 12C, 24Mg, and 56Fe targets. Also shown are measurements by various workers (Lesko et al. 1988; Dyer et al. 1981; Belhout et al. 2007). At projectile energies <30 MeV, the TALYS-calculated cross sections agree well with the measurements, reproducing not only the cross section dependence on projectile energy but also its absolute value. At these energies, the mechanism of the reaction is well described by the compound nucleus model and by the pre-equilibrium and direct-reaction models, and these models are well formulated and implemented in TALYS.

Figure 1. Comparison of gamma-ray line production cross sections as calculated with TALYS (thick curves) and as measured by several groups.
Download figure:
Standard image High-resolution imageWe have further compared cross sections calculated with TALYS with measured cross sections for more than 50 gamma-ray lines resulting from both proton and α-particle interactions with light- and medium-weight nuclei. We again find good agreement for projectile energies near the peak of the cross section. At higher energies, the agreement is often not as good. Nevertheless, the TALYS calculations will be useful for improving those line production cross sections for which only partial data are available, especially for revealing changes of their structure resulting from new reaction mechanisms. In addition, such higher-energy solar-flare energetic particles are not the main contributor to solar-flare de-excitation gamma-ray radiation due to the relatively steep accelerated-particle spectrum found in most flares.
For our objective of determining the unresolved-line component, only a global nuclear reaction program such as TALYS can adequately describe the complex behavior and structure of the radiation resulting from thousands of lines. Since this component results from such a large number of transitions, the overall accuracy is expected to be good as it results from an average over many components. Considering the lack of laboratory measurements and the difficulty of removing background contamination when measurements are available, TALYS is indispensable for evaluation of the unresolved-line component.
We want to emphasize that the good agreement discussed above between TALYS and measured cross sections has not been achieved by using those measurements in the construction of the TALYS nuclear models. The state-of-the-art nuclear models used by TALYS do contain parameters which are empirically determined by measurements. For example, the optical model contains nuclear-potential parameters that are determined by fitting measured elastic-scattering cross sections for each target and projectile. These parameters are stored in TALYS and then used in calculations for other, different reactions, such as for the gamma-ray line production cross sections of interest here.
3. THE EXPLICIT LINES
In this section, we discuss the three aspects of the explicit-line component addressed in this work: (1) lines resulting from alpha-inelastic reactions, (2) improvements of other explicit lines (mostly spallation reactions), and (3) the addition of new lines.
3.1. Alpha-Inelastic Lines
The most important α-induced reactions are inelastic in the sense that the target is unchanged (other than being excited) in contrast to spallation reactions where the target is broken. Such inelastic reactions produce the strongest lines, lines which are conspicuous in measured solar-flare gamma-ray spectra and are responsible for most of the information derived from analyses of gamma-ray data. KMR updated the cross sections for these reactions using available laboratory measurements, but those measurements typically only extended to projectile energies of about 7 MeV nucleon−1. To extrapolate the measurements to higher energies, KMR assumed that the reaction exit channel contains only two bodies (denoted α, α'); that is, the α projectile is not broken. Cross sections for such reactions typically decay exponentially at projectile energies above the peak, as observed in corresponding proton-inelastic reactions (denoted p, p').
At low energies, breakup of the α projectile is indeed inhibited due to its high binding energy. But at high energies, the α particle can be broken, yielding several possible exit channels for the projectile: (α, pt), (α, dpn), (α, 3He n), (α, 2d), and (α, 2p 2n). This type of reaction is referred to as inelastic breakup (Gadioli & Hodgson 1986). Above the threshold energies for these new reactions, the reaction is no longer two-body even though the target nucleus is unchanged (other than being excited). At the energies where these additional channels begin to operate, the decline of the cross section can reverse and the cross section can instead increase, resulting in either a double peak or a single peak followed by a minimum and then an increase toward a plateau at high energies. For many of the reactions considered here, the threshold for the onset of breakup of the α projectile is around 7 MeV nucleon−1.
This pattern has been seen in measured cross sections of spallation reactions of the type (α, xn yp) where x, y > 2 when the measurement is for the residual nucleus, independent of the identity of the other nucleons (as in the measurement of the production of radioactive nuclei). One example is the reaction α + 59Co →57Co + 2n + "α," whose measured cross section is shown in Figure 2(a) (from Gadioli & Hodgson 1986). Here, "α" refers to all of the possible combinations of two protons and two neutrons. Another example is the reaction α + 93Nb →90Nb + 3n + "α," whose cross section is shown in Figure 2(b) (from Gadioli et al. 1984). There are many such examples, and in their review of α-particle interactions, Gadioli & Hodgson (1986) indeed considered this pattern to be a general rule for such reactions: "The excitation functions of alpha reactions show structure with an initial peak, a valley, and a second rise to a flat plateau. The first peak and the valley correspond to α-particle emission, mainly by evaporation in the peak and by pre-equilibrium emission in the valley. Subsequently, the emission of nucleons becomes progressively dominant."
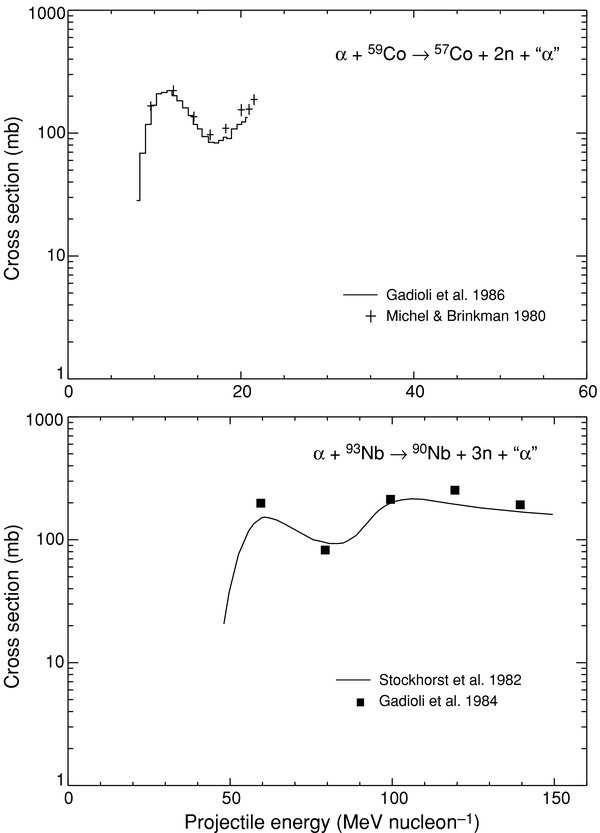
Figure 2. (a) Cross section for the production of 57Co by interaction of α projectiles on 58Co as measured by two groups; (b) cross section for the production of 90Nb by interaction of α projectiles on 93Nb as measured by two groups.
Download figure:
Standard image High-resolution imageThere are no measurements for gamma-ray emission in alpha-inelastic reactions at the energies where breakup can occur, but the spallation reactions discussed above suggest that the onset of new exit channels due to α-projectile breakup would produce similar behavior in gamma-ray production cross sections. And indeed, TALYS confirms this general behavior for gamma-ray emission cross sections in alpha-inelastic reactions. Two examples are shown in Figure 3 where TALYS cross sections for the alpha-inelastic reactions with 24Mg and 28Si producing the strong lines at 1.369 and 1.778 MeV are shown along with the measurements at low α-projectile energies. We have adopted the following rule for establishing line production cross sections in alpha-inelastic reactions: "At those energies where they are available (typically at energies ⪅10 MeV nucleon−1 where the α particle is unbroken producing the first peak of the cross section) laboratory measurements are used. At higher energies, where no laboratory data are available, we use TALYS, normalized to the highest-energy point of the available measurements." Because TALYS calculations only extend to 60 MeV nucleon−1 for α reactions, we extrapolate the cross sections to 1 GeV nucleon−1 based on the energy-dependence trend established by the TALYS calculation up to 60 MeV nucleon−1. Revised line production cross sections for all of the alpha-inelastic reactions are given in the Appendix.
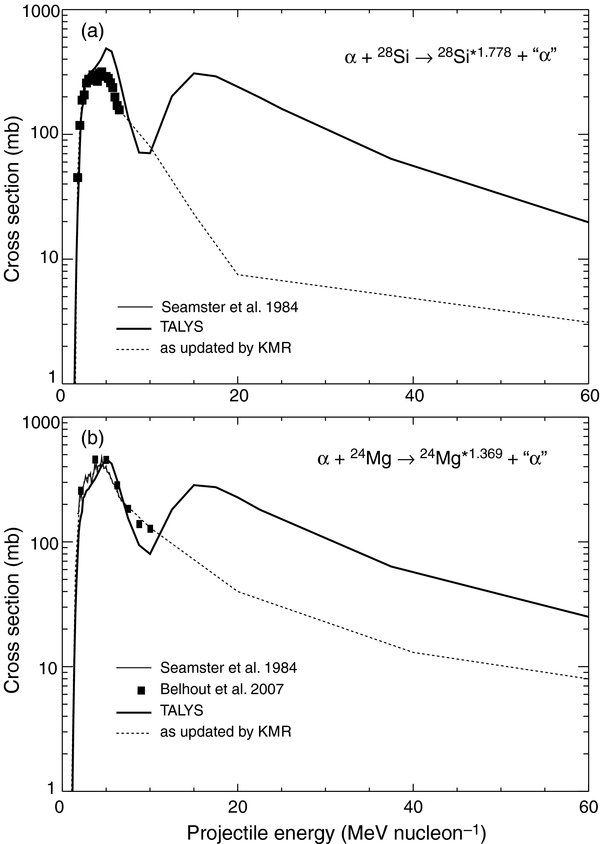
Figure 3. (a) Comparison of the cross section for the production of 28Si in its first excited state by interaction of α projectiles on 28Si as calculated with TALYS (thick curve) and as measured. Also shown is the cross section as given by KMR. (b) Comparison of the cross section for the production of 24Mg in its first excited state by interaction of α projectiles on 24Mg as calculated with TALYS (thick curve) and as measured. Also shown is the cross section as given by KMR.
Download figure:
Standard image High-resolution imageThe previous assumption that alpha-inelastic reactions were two-body in the exit channel at all projectile energies also directly affects the velocity of the recoil-excited nucleus and, therefore, the spectral shape of the gamma-ray line via Doppler shifting of the photons. When there are more than two bodies in the exit channel, the recoil nucleus shares its energy with the nucleons, and its velocity generally will be lower than with only two bodies. Because α-particle breakup occurs at higher energies, breakup should increase as the α-particle spectrum hardens. The resulting lower recoil velocities would then produce narrower line profiles than those obtained with the previous two-body assumption. We have modified the gamma-ray line production code, now assuming that above the energy corresponding to the valley of the cross section there are more than two bodies in the exit channel and we choose the recoil nucleus energy from a three-particle phase-space distribution (see, e.g., Nikolic 1968).
3.2. Improvements in Other Explicit-Line Cross Sections
Since the publication of KMR there has been only one major work reporting comprehensive gamma-ray line cross section measurements (Belhout et al. 2007). They reported gamma-ray production cross sections for proton and α-particle interactions with 12C, 16O, 24Mg, and 56Fe in the energy range from 5 to 25 MeV with proton beams and from 5 to 40 MeV (1.25 to 10 MeV nucleon−1) with α-particle beams, energies somewhat higher than previous measurements. They reported more than 50 lines, many of which had not been reported before, at a sensitivity at or below 1 mbarn at low projectile energies. Here, we have used their measurements where appropriate.
A major effort in this work is to improve the cross section evaluations of those lines currently addressed by the code (see the list in KMR) where only partial laboratory data are available. Most of these lines result from spallation reactions and their cross sections therefore peak at higher energies, generally >30 MeV for protons and >10 MeV nucleon−1 for α particles, often outside the energy range of the measurements. The most common evaluations by RKL and KMR of such lines were based on measurements with low-resolution detectors at only a very few projectile energies. RKL and KMR assumed an overall energy-dependence pattern for the reaction cross section based on better-measured patterns of similar reactions, normalized to the available measurements. We now replace such similarity arguments with explicit theoretical calculations obtained with TALYS. An example of this is the 4.439 MeV line from the 14N(p, p"d")12C* reaction, where "d" refers to the two possible combinations of a proton and a neutron. To construct the cross section for this reaction, KMR used the energy-dependence pattern of the similar spallation reaction 16O(p, pα)12C* measured by Dyer et al. (1981), corrected to the appropriate threshold energy and normalized to the single measurement of Clegg et al. (1961) at 120 MeV. We now use the energy dependence as given by TALYS for the reaction, normalized to the Clegg et al. (1961) measurement. The resulting cross section is shown in Figure 4(a). The first peak at <20 MeV results from deuterium emission and the second peak results from breakup of deuterium.

Figure 4. (a) Comparison of the cross section for the production of the 4.439 MeV gamma-ray line from 12C by interaction of protons on 14N as calculated with TALYS (thick curve) and as measured. The dashed curve shows the TALYS cross section renormalized to the Clegg et al. (1961) measurement. Also shown is the cross section as given by KMR. (b) Comparison of the cross section for the production of the ∼5.2 MeV gamma-ray line complex by interaction of α projectiles on 16O as calculated with TALYS (thick curve) and as measured. Also shown is the cross section as given by KMR.
Download figure:
Standard image High-resolution imageAnother cross section evaluation issue concerns clusters of lines of similar energies. The low-resolution measurements often only resulted in a cross section for production of the total cluster (Zobel et al. 1968; Clegg et al. 1961; Foley et al. 1962a, 1962b). The internal division among the various lines in the cluster again were based on similarity to analogous reactions. An example is the evaluation of the cluster around 5.2 MeV resulting from α-particle bombardment of 16O. This cluster consists of lines at 5.27 and 5.29 MeV from 15N, at 5.18 and 5.24 MeV from 15O, and at 5.10 MeV from 14N. KMR based their evaluation of this cross section on the better-measured analogous proton reaction, normalized to the one measured value by Zobel et al. (1968) at 50 MeV (13 MeV nucleon−1). We now have the additional Belhout et al. (2007) measurements of the cross section for the total complex at energies of 20, 22.5, and 25 MeV and we have used TALYS in the following way. The TALYS-calculated cross sections for these five lines had very similar energy dependences so we added them to give the total cross section. We then normalized this sum to the three Belhout measurements, as shown in Figure 4(b). (In this case, essentially no renormalization was required, and the cross section is also consistent with the original Zobel measurement.) This total cross section was then divided among the five lines according to the ratios of the maxima of the TALYS-calculated cross sections for the lines. (The total cross section and the ratios are given in the Appendix.) We note that the second peak of the cross section results from breakup of the α particle.
We updated a number of lines using the procedures discussed in this section. We extrapolated the cross sections to 1 GeV nucleon−1 based on the trend established by the TALYS calculations at their highest projectile energies. The revised cross sections are given in the Appendix.
3.3. New Explicit-Line Cross Sections
In studies of the accelerated α/proton ratio in flares performed before the modifications discussed here, we realized that there were a number lines from proton-induced reactions that were explicitly included in the code but, due to lack of measurements, the same lines from α-induced reactions were not (see the list of lines given by KMR). The radiation from these α-induced lines was of course included in the unresolved-line continuum but, because of the generic, low-resolution spectral shape of the unresolved-line continuum previously used by the code, the radiation did not appear at the actual line energies. With our new evaluation of the unresolved-line continuum spectrum using TALYS (see Section 4), the radiation from these lines would now appear at their correct energies but, because of the smoothing we apply to this component (see Section 4.5), the calculated line spectrum from α particles could still be lacking important fine structure. Such a proton–alpha imbalance in the calculated spectrum might distort derived α/proton ratios. We have therefore included these α-induced reactions as explicit lines in the gamma-ray line production code, removing them from the unresolved-line continuum. We used the new Belhout et al. (2007) measurements where available and TALYS to complete the cross section as in Sections 3.1 and 3.2. For lines where no laboratory data are available, we used TALYS calculations to provide the complete cross section. We extrapolated the cross sections to 1 GeV nucleon−1 based on the trend established by the TALYS calculations at their highest projectile energies.
The list of lines given in KMR shows that there are regions of the gamma-ray spectrum having very few lines explicitly addressed by the code. The remaining line emission in these regions is of course included in the unresolved-line continuum, but some of these lines are relatively strong according to TALYS and, because of the smoothing (see Section 4.5), the resulting calculated spectrum may again be lacking important fine structure. To improve the accuracy of our calculated spectra, we have added many new lines explicitly to the production code, removing them from the unresolved-line continuum. We surveyed the cross sections as calculated with TALYS of all lines from proton and α reactions with the most abundant elements of the solar atmosphere and included explicitly in the code all lines whose cross section maxima are above 10 mbarn. (Generally, the new lines have cross section maxima less than 100 mbarn; essentially all lines with cross section maxima >100 mbarn had already been included as explicit lines.) We extrapolated the cross sections to 1 GeV nucleon−1 based on the trend established by the TALYS calculations at their highest projectile energies. We expect that the inclusion of these lines will improve the quality of fit when calculated spectra are compared with measured spectra.
In all, we added more than 100 new explicit-line reactions to the gamma-ray line production code, removing them from the unresolved-line continuum. The cross sections for all of these reactions, obtained either from the new measurements or from TALYS, are given in the Appendix. There are now more than 250 reactions explicitly addressed by the code producing more than 140 distinct lines, compared with the previous 150 reactions producing 100 distinct lines.
4. THE UNRESOLVED-LINE CONTINUUM
In the gamma-ray line production code, the unresolved-line continuum (the emission left after subtracting from the total spectrum the explicit lines addressed by the code) was previously treated as a true continuum, estimated from low spectral-resolution laboratory measurements for proton interactions with only a few target nuclei and at only a few projectile energies. The spectra were assumed to be independent of projectile energy and were binned in relatively wide photon-energy bins of 1 MeV. Here, we will use TALYS to determine the shape of this continuum for protons and α-particle interactions with all relevant target nuclei over a full range of projectile energies. This continuum consists of several components. In this section we will elaborate, evaluate, and demonstrate their properties.
A nuclear interaction between a projectile and a target nucleus can result in one of many possible residual nuclei (including the original nucleus), which can be in one of many possible excited states (or levels). For example, bombardment of 24Mg by energetic α particles can produce 24Mg in one of its excited states or, via spallation or fusion reactions, an excited state of one of the several isotopes (including short-lived isotopes) of C, N, O, F, Ne, Na, Mg, Al, Si, and others. The transition between the excited state and a lower state results in the emission of a photon of energy equal to the difference between the two states. If the lower state is not the ground state, further transitions with emission of corresponding gamma rays can occur. The number of possible gamma rays from all of the possible final nuclei and states can be enormous.
The main contribution to the unresolved-line continuum in solar flares is from interactions involving 24Mg, 28Si, and 56Fe. These three nuclei have 23, 29, and >200 bound excited states, respectively. In addition, all of the various nuclei resulting from spallation and fusion reactions involving those three nuclei have numerous bound states as well. The number of possible gamma-ray emitting transitions clearly can be very large. Experimental confirmation of this can be seen from the measurements of Zobel et al. (1968). In their table, the sum of the cross sections for those lines that they measured from these elements is much less than their measured total cross section for emitted radiation.
The nuclei 12C, 14N, 16O, and 20Ne have only a small number of bound excited states (e.g., 12C has only one) and most of their transitions are already among the explicit lines included in the gamma-ray line production code. However, because of their high relative abundances and the number of possible residual spallation and fusion nuclei, we have now included unresolved-line continuum from these elements as well.
4.1. The TALYS Computational Technique for Computing Gamma-Ray Emission
For computational purposes, TALYS considers two kinds of nuclear levels. The first kind consists of lower-lying levels, treated by TALYS as discrete, bound states decaying only by gamma-ray emission (if allowed by the quantum selection rules). Information used by TALYS about the properties of these levels are from a recent nuclear database (RIPL-3) containing comprehensive libraries of all available experimental nuclear structure data. As explained in Section 4.2.1, we refer to emission from transitions between these levels as the quasi-continuum of discrete lines.
The second kind of level consists of higher-lying levels. These can be very numerous and, for computational purposes, are treated by TALYS as a finite number of bins, with each bin containing a range of levels. TALYS treats the levels within a bin as continuous rather than discrete, with the density of states given by one of the known nuclear-level density functions, again stored as a TALYS library. We refer to emission from transitions between these levels with the term used by TALYS: the compound continuum.
The level structure of a nucleus as treated by TALYS is illustrated schematically in Figure 5. The TALYS parameter Ns sets the level dividing the two kinds of levels, and it can be adjusted according to the structure of the particular nucleus. We note that those bins lying above the first separation energy (the energy above which particle emission is allowed) may decay via particle emission or via gamma-ray emission, with the gamma-ray yield given by the Hauser–Feshbach statistical model of the gamma strength function (see the TALYS user manual).
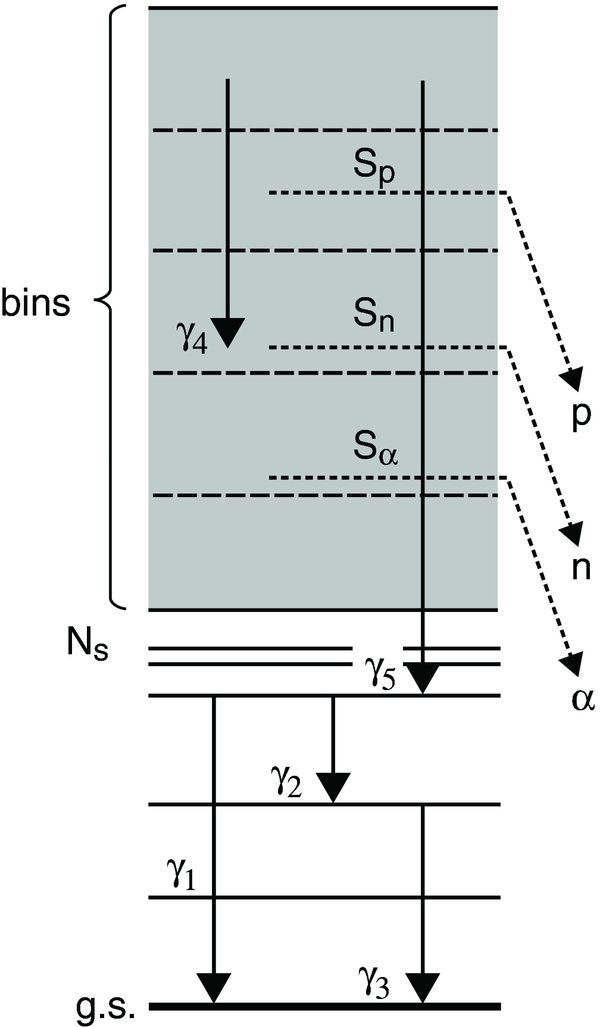
Figure 5. Nuclear level scheme as implemented by TALYS. The level labeled Ns is the level above which levels are treated by TALYS as bins rather than explicitly (see the text). Gamma rays from various possible types of level transitions are indicated. γ1 results from a transition between an excited state and the ground state (g.s.). γ2 results from a transition between two excited states which can be followed by gamma ray γ3 resulting from the transition to the g.s. γ4 results from a transition between two excited states within the bins. γ5 results from a transition between an excited state within the bins and an explicit state. Sp, Sn, and Sα are the proton, neutron, and α-particle separation energies, respectively. Excitation to levels above these energies can result in decay either by emission of the associated particle or emission of a gamma ray resulting from transition to a lower level.
Download figure:
Standard image High-resolution imageIn Section 4.2, we discuss these two unresolved-line continuum components (the quasi-continuum of discrete lines and the compound continuum) in more detail, along with the third component of the unresolved-line continuum: the pre-equilibrium continuum.
4.2. The Components of the Unresolved-line Continuum
4.2.1. Quasi-Continuum of Discrete Lines
This component consists of the radiation from discrete transitions between the first Ns levels treated by TALYS that remains after the explicit lines addressed by the gamma-ray line production code are removed. When all possible residual product nuclei are considered, the number of these lines can be very large (for Fe, the number of nuclei can be greater than 50 resulting in several thousand transitions). These numerous, weak lines often overlap and blend, and because of this blending we refer to this component as the quasi-continuum of discrete lines.
In Figure 6, we show the cross section for production of this radiation from 100 MeV protons interacting with 56Fe. In this figure, we have combined the discrete lines into 1 keV bins. We note that the explicit lines addressed by the gamma-ray line production code have been removed. We also note that the lack of discrete lines above ∼4 MeV is a computational artifact of TALYS. For Fe, the energy of level 25 (the value assigned to Ns for this calculation) is ∼4 MeV, and so 4 MeV is the largest photon energy that could be treated discretely by TALYS for this value of Ns. All transitions initiated from levels above this state which could potentially result in discrete photon energies greater than 4 MeV are instead included in the compound continuum (see below). For lighter elements, the discrete lines extend to higher energies because the energy of level 25 is higher (for Mg it is ∼9.3 MeV and for Si it is ∼10 MeV; see Section 4.3 and Figure 9).
Figure 6. TALYS calculation of the cross section for the quasi-continuum of discrete lines from 100 MeV proton projectiles interacting with 56Fe.
Download figure:
Standard image High-resolution imageWe will use cross sections such as shown in Figure 6 to calculate gamma-ray spectra using the gamma-ray line production code which takes into account the Doppler shift of the photons resulting from the kinematics of the nuclear reactions. We have estimated that for the reaction p + 56Fe → p + n + 55Fe*, which is responsible for many of the lines seen in the figure, the line width due to Doppler broadening is >10 keV for an isotropic projectile angular distribution. In many regions of this spectrum, the separation of the discrete lines is less than 10 keV, resulting in further line blending and an almost continuous spectrum.
We note in Figure 6 that the densities and strengths of the lines are not uniform, with some clustering of lines. As will be discussed in Section 4.3, this results in an unresolved-line continuum with structure, differing significantly from the smooth continuum assumed by RKL. When solar-flare spectral data are re-analyzed using these new calculations, this structure may impact earlier conclusions based on both the narrow and broad explicit gamma-ray lines.
4.2.2. Compound Continuum
TALYS treats the radiation due to transitions initiated in the bins (i.e., from levels >Ns) as a continuum. This radiation includes transitions between the bins themselves and transitions from the bins to lower discrete levels. Because all of the explicit transitions addressed by the gamma-ray line production code originate from lower-lying levels, there is no emission to remove from this component to produce the desired unresolved-line continuum; i.e., all of this component as calculated by TALYS contributes.
As an example of the compound continuum, we show its cross section for 100 MeV protons interacting with 56Fe as the solid curve in Figure 7. We also show in Figure 7 the total continuum, including the discrete-line quasi-continuum emission discussed in Section 4.2.1 and shown in Figure 6. For this case, the compound continuum is relatively strong and shows very little structure. For lighter elements and lower-energy projectiles, the compound continuum is relatively weaker but shows more structure (see Section 4.3).

Figure 7. TALYS calculation of the cross section for the quasi-continuum of discrete lines, the compound continuum, and the pre-equilibrium continuum from 100 MeV proton projectiles interacting with 56Fe.
Download figure:
Standard image High-resolution image4.2.3. Pre-Equilibrium Continuum
The radiation comprising the components discussed in the previous two sections results from transitions between well-defined quantum states (bound or unbound). But nuclear reactions can produce emission even before a definite quantum state is reached. We refer to this component with the TALYS term: pre-equilibrium continuum. Pre-equilibrium emission occurs before statistical equilibrium of the compound nucleus is achieved, and the quantum state therefore cannot be described simply with the values of energy, angular momentum and parity that typically define nuclear levels. Only a few intranuclear collisions have taken place, compared to the many collisions required to achieve the compound nucleus. The emission during pre-equilibrium is essentially bremsstrahlung of a charged particle moving in the electric field of another charged particle and is therefore a true continuum. We show the pre-equilibrium continuum produced by 100 MeV protons interacting with 56Fe as the dashed line in Figure 7. The radiation is significant only above photon energies of ∼15 MeV and is considerably weaker than either the quasi-continuum of discrete lines or the compound continuum. Its relative contribution becomes even weaker at lower projectile energies. Because solar-flare accelerated-particle spectra typically fall rapidly with increasing energy, this component is not expected to have any impact on analyses of solar-flare gamma-ray data.
4.3. Various Dependences of the Unresolved-Line Continuum
The unresolved-line continuum is composed of the three components discussed above. Their spectral shape and their relative importance depend on the projectile and target species and on the projectile kinetic energy. To illustrate how the spectra depend on projectile energy, in Figure 8 we show total unresolved-line production cross sections (combined into 100 keV bins) for interactions of 10 and 100 MeV protons with 56Fe. We see clear evidence for structure in both spectra, but with more structure present for the lower projectile energy. With higher projectile energies, more higher-lying levels are accessed and the larger number of resulting lines blend into a smoother spectrum. Because the final unresolved-line continuum calculated for a solar flare results from interactions of ions with a range of energies, its shape and intensity will therefore depend on the shape of the accelerated-ion kinetic energy spectrum.

Figure 8. Unresolved-line continua from 10 and 100 MeV proton projectiles interacting with 56Fe.
Download figure:
Standard image High-resolution imageFigure 9 illustrates how the unresolved-line continuum depends on target species, showing spectra resulting from interactions of 30 MeV protons with 56Fe and 24Mg targets. Because the number and density of states for the heavier Fe nucleus is higher, there are more transitions and its continuum has less structure. Since the final unresolved-line spectrum calculated for solar flares results from interactions involving both ambient and accelerated C, N, O, Ne, Mg, Si, and Fe, its shape and intensity will therefore depend on the composition of both the accelerated ions and the ambient medium.

Figure 9. Unresolved-line continua for 30 MeV proton projectiles interacting with 56Fe and 24Mg.
Download figure:
Standard image High-resolution imageFigures 10 and 11 illustrate how the unresolved-line continuum depends on whether the projectile is a proton or α particle (or the target is H or He for inverse interactions). Figure 10 is for a high total projectile energy (100 MeV) and Figure 11 is for a low total projectile energy (10 MeV). At high projectile energies, the proton and α-particle spectra are very similar. At low projectile energies, the spectrum from protons extends to higher photon energies. While the ambient H/He abundance ratio may not vary from flare to flare, the accelerated α/proton ratio certainly may. The shape and intensity of the final calculated unresolved-line spectrum will therefore also depend on the assumed accelerated α/proton ratio.
Figure 10. Unresolved-line continua for 100 MeV proton and α projectiles interacting with 56Fe.
Download figure:
Standard image High-resolution image
Figure 11. Unresolved-line continua for 10 MeV proton and α projectiles interacting with 56Fe.
Download figure:
Standard image High-resolution image4.4. Total Cross Sections for the Unresolved-line Continuum
In order to determine the absolute yields of the unresolved-line continua, we must know the total production cross section for the continua as a function of projectile energy. The desired cross section is the total cross section for gamma-ray production as calculated by TALYS less the cross sections for the production of the explicit lines of the gamma-ray line code. The resulting total unresolved-line continuum cross sections for proton projectiles on 12C, 14N, 16O, and 20Ne targets as a function of proton energy are given in Figure 12. The total cross sections for proton projectiles on 24Mg, 28Si, 32S, and 56Fe are shown in Figure 13. The corresponding total unresolved-line continuum cross sections for α-particle projectiles are given in Figures 14 and 15. For consistency, we use the explicit-line cross sections as calculated by TALYS for the subtraction rather than the measured cross sections. For use in the gamma-ray line production code, we extrapolated the cross sections to 1 GeV nucleon−1 based on the trend established at their highest projectile energies.
Figure 12. Total unresolved-line continuum cross sections for proton interactions with 12C, 14N, 16O, and 20Ne.
Download figure:
Standard image High-resolution image
Figure 13. Total unresolved-line continuum cross sections for proton interactions with 24Mg, 28Si, 32S, and 56Fe.
Download figure:
Standard image High-resolution image
Figure 14. Total unresolved-line continuum cross sections for α-particle interactions with 12C, 14N, 16O, and 20Ne.
Download figure:
Standard image High-resolution image
Figure 15. Total unresolved-line continuum cross sections for α-particle interactions with 24Mg, 28Si, 32S, and 56Fe.
Download figure:
Standard image High-resolution imageAn interesting property of the total gamma-ray production cross section is revealed when we consider it as a function of A2/3, where A is the nucleon number of the target. A2/3 is proportional to the geometrical area of the target (geometrical area = π(R0A1/3)2, where R0A1/3 is the nuclear radius and R0 is a constant (∼1.5 fermi)). Figure 16 shows this relationship as calculated by TALYS for various energies of proton projectiles on 12C, 14N, 16O, 20Ne, 24Mg, 28Si, and 56Fe targets. We see that for Ne and heavier elements at proton energies of 100 MeV and above, the relationship is linear, showing that the cross section at high proton energies is indeed proportional to the nuclear area. (For Fe at 200 MeV, the cross section calculated by TALYS is, in fact, equal to the geometrical area.) This property allows the determination of cross sections for elements between Si and Fe (such as S, Ar, and Ca) by interpolation. Another feature seen in Figure 16 is the monotonic decrease of the cross sections as a function of proton energy. Only the cross section for Fe at 10 MeV does not follow this rule, probably because of suppression due to the high Coulomb barrier at low energies. In Figure 17, we show the corresponding total cross section for α projectiles as a function of target A2/3 for various projectile energies. Excluding 2 MeV nucleon−1 curve, the linear dependence is even stronger.

Figure 16. Total cross section for gamma-ray production by protons as a function of A2/3 (where A is the nucleon number), parameterized with projectile energy.
Download figure:
Standard image High-resolution image
Figure 17. Total cross section for gamma-ray production by α particles as a function of A2/3 (where A is the nucleon number) parameterized with projectile energy.
Download figure:
Standard image High-resolution imageZobel et al. (1968) measured the total cross sections for gamma-ray emission above 700 keV for a few targets at a few proton energies. For Fe, the agreement with the cross sections calculated with TALYS is reasonably good at all three proton energies considered by Zobel (15.7, 31.4, and 155 MeV). Zobel only measured the cross section for Mg at 31.3 MeV and it is larger than that calculated with TALYS by about 60%. Overall, the cross sections calculated with TALYS are in reasonable agreement with those measured by Zobel although we note that the Zobel measurements are consistently somewhat higher, perhaps resulting from issues related to background subtraction. Because of the potential uncertainties and the scarcity of measurements for different energies and targets, we will use the TALYS calculations for the total gamma-ray production cross sections.
4.5. Unresolved-Line Continua for Arbitrary Accelerated-Ion Power-Law Spectra and Abundances
As we have seen from the above discussion, the unresolved-line continuum depends on the target species and on the projectile species and energy. For analyses of solar-flare gamma-ray data, we require unresolved-line continua for arbitrary accelerated-ion kinetic energy and angular distributions, accelerated-ion and ambient compositions, and flare location on the solar disk. To construct such continua using the gamma-ray line production code, we use TALYS to produce a library of unresolved-line continua which the production code can access. The library consists of gamma-ray spectra (such as shown in Figures 8–11) calculated for proton and α-particle interactions with C, N, O, Ne, Mg, Si, and Fe for 35 projectile energies (3–200 MeV for protons and 0.75–60 MeV nucleon−1 for α particles). We rebin the spectra calculated with TALYS into 100 keV bins. This level of rebinning represents an acceptable compromise between computational efficiency and preservation of the spectral details. After modifying the gamma-ray line production code to properly access and interpolate the TALYS spectral libraries, we used it to explore how the unresolved-line continuum depends on various physical parameters relevant to solar flares, such as the accelerated-ion energy spectrum, composition and angular distribution and the ambient abundances.
To illustrate how the continuum depends on the accelerated-ion spectral index, in Figure 18 we show calculated unresolved-line continua for two cases of power-law spectral indexes: s = 2 and s = 4. For these calculations, we have assumed a "coronal" composition (Reames 1995) for both the ambient medium and the accelerated ions (but with He/H = 0.1 and α/proton = 0.1, respectively) and an isotropic ion angular distribution. For each case, the upper curve is the total continuum (direct plus inverse components) and the lower curve is the inverse component only. The s = 2 curves have been divided by 100 for plotting clarity. For the harder index s = 2, more high-energy ions produce the continuum and, as discussed above, the structure of the spectrum is smoother. This is true of both the direct and inverse components. But a harder ion spectrum also results in more Doppler broadening of the radiation, and this is particularly true of the inverse component, as clearly seen in the figure. This further reduces the structure of the total continuum for harder spectra. This is particularly important when the relative contribution of the inverse component is larger (see below).
Figure 18. Unresolved-line continuum from interactions of isotropic accelerated ions for two spectral indexes: s = 2 (lower curves) and s = 4 (upper curves). For each index, the upper curve is the total continuum (direct plus inverse components) and the lower curve is the inverse component only. The ambient and accelerated-ion compositions were both coronal (but with He/H = 0.1 and α/proton = 0.1, respectively). The curves for s = 2 have been divided by 100 for plotting clarity.
Download figure:
Standard image High-resolution imageThe unresolved-line continuum depends on the accelerated-ion spectrum in another way. The production cross sections for the unresolved-line continua are generally larger at high projectile energies than those for the explicit lines (compare, e.g., Figure 1 and Figures 12–15). As a result, a harder accelerated-ion spectrum will increase the yield of the unresolved-line component (both direct and inverse) relative to the explicit lines. Because the unresolved-line spectrum itself is smoother for harder spectra (see above), hardening the ion spectrum has the effect of making structure in the total gamma-ray spectrum (explicit lines plus unresolved lines) less conspicuous.
We note in Figure 18 that the inverse component is clearly less than half of the total, implying that the inverse component yield is significantly less than the direct yield even though the accelerated-ion and ambient abundances are assumed identical. In thick target interactions (thought to be the case for gamma-ray line production in solar flares), the gamma-ray yield results from competition between nuclear reactions and projectile energy losses. Energy-loss rates are proportional to Z2/A, where Z is the charge of the projectile as it slows in the solar atmosphere. As a result, heavy ions suffer larger energy-loss rates than protons or α particles, reducing the yields of inverse reactions relative to those of direct reactions. This reduction can be compensated for if the abundances of the accelerated ions heavier than He (which produce the inverse component) are increased relative to the accelerated protons and α particles (which produce the direct component), as is the case for the 3He-rich composition (see below).
Figure 18 suggests that the relative contributions of the direct and inverse components to the total unresolved-line continuum do not depend strongly on the spectral index. But this is true only for the specific ambient and accelerated-ion abundances assumed there. Generally, the cross sections for direct reactions involving accelerated α particles (or inverse reactions involving ambient He) have lower threshold energies than those for direct reactions involving accelerated protons (or inverse reactions involving ambient H). The α reactions would then be enhanced for steeper ion spectra. If the accelerated α/proton and ambient He/H ratios are the same, as was the case in Figure 18, there would be no dependence of the relative direct and inverse yields on spectral index. But if, for example, the accelerated α/proton ratio were greater than the ambient He/H ratio, steepening the ion spectrum would enhance the direct component contribution relative to that of the inverse, and vice versa.
The relative contributions of the direct and inverse components to the total unresolved-line continuum depend most directly on the composition of the accelerated ions. If the abundances of the accelerated heavy ions are enhanced relative to the accelerated protons and α particles, the relative yield of the inverse component will be larger. Such abundance enhancements have been observed in 3He-rich solar energetic particle events in interplanetary space (Reames 1995) where the abundances of Ne, Si, Mg, and Fe relative to protons are enhanced compared to coronal abundances, with Fe enhanced by up to a factor of 10. In Figure 19, we show how the continuum is affected for two cases of the accelerated-ion composition: coronal and 3He-rich (but both with α/proton = 0.1). For these calculations we have assumed a spectral index s = 4 and coronal ambient composition. As in Figure 18, the upper curve for each case is the total continuum (direct plus inverse components) and the lower curve is the inverse component only. The 3He-rich curves have been divided by 100 for plotting clarity. The relative contribution of the inverse component is larger for the 3He-rich case, and because this component has less structure, the total unresolved-line continuum consequently has less structure. (We note that the relative contributions of the direct and inverse components to the total unresolved-line continuum similarly depend on the abundances of the ambient heavy elements relative to ambient He and H, but the ambient composition is not expected to vary as significantly from flare to flare as the accelerated-ion composition.)

Figure 19. Unresolved-line continuum for two cases of isotropic accelerated-ion composition: coronal (upper curves) and 3He-rich (lower curves) with α/proton = 0.1 for both cases. The accelerated-ion spectral index s was 4 and the ambient composition was coronal (but with He/H = 0.1). For each case, the upper curve is the total continuum (direct plus inverse components) and the lower curve is the inverse component only. The curves for the 3He-rich case have been divided by 100 for plotting clarity.
Download figure:
Standard image High-resolution imageThe relative contributions of the direct and inverse components also depend on the accelerated α/proton ratio. Because both accelerated α particles and protons contribute to the direct component of the unresolved-line continuum, increasing the α/proton ratio increases the direct component yield relative to that of the inverse component.
We show in Figure 20 the total unresolved-line continuum (lower curve) for s = 4 from Figure 18 and also the total gamma-ray spectrum (upper curve) which includes the explicit narrow and broad lines addressed by the gamma-ray line code in addition to the unresolved-line continuum. We see that for this combination of parameters, there are regions of the spectrum where the unresolved-line continuum makes a significant contribution to the total emission.

Figure 20. Total gamma-ray spectrum from isotropic coronal composition accelerated ions (but with α/proton = 0.1) on coronal ambient material (but with He/H = 0.1). The accelerated-ion spectrum was a power law with index s = 4.
Download figure:
Standard image High-resolution image5. SUMMARY
The gamma-ray de-excitation-line production code (see, for example, RKL and KMR) has been and continues to be the primary theoretical tool for analysis of gamma-ray line data from solar flares. The newly revised code is currently being rewritten in Interactive Data Language (IDL) and optimized for efficiency, usability, and ease of improvement. It will be incorporated into the spectral-fitting environment OSPEX of SolarSoft (Freeland & Bentley 2001) and can then be used by all members of the solar physics community to analyze data not only from current sources of solar-flare gamma-ray data such as RHESSI and the Gamma-Ray Burst Monitor (GBM) on Fermi, but also from past detectors, such as SMM and Yohkoh, and future detectors. With the improvements to the code, researchers can confidently use its calculations in analyses of solar-flare gamma-ray line data to determine flare parameters such as ambient and accelerated-ion compositions and accelerated-ion spectral and angular distributions. Here we summarize the changes to the code and discuss the impact of the changes on solar-flare analyses.
5.1. Summary of Modifications
We improved the completeness and accuracy of the code in three ways. First, new measurements (Belhout et al. 2007) of the cross sections for the de-excitation lines explicitly addressed by the code have become available since the last update (KMR). They reported cross sections for more than 50 lines (many of which had not been reported before), measured in the energy range from 5 to 25 MeV with proton beams and from 5 to 40 MeV (1.25 to 10 MeV nucleon−1) with α-particle beams (energies somewhat higher than previous measurements). We use their measurements where appropriate to both improve the cross sections for lines already explicitly included in the code and add new lines.
Second, for the first time, we give a full and detailed evaluation of the nuclear de-excitation unresolved-line continuum. This continuum consists of all emission not accounted for by the explicit lines included in the line production code. Although it has always been included in the code, its photon energy distribution had been estimated from low spectral-resolution laboratory measurements for only a few target nuclei at only a few projectile energies. Because adequate laboratory measurements for this component are not available or given in a usable form, the primary tool for this evaluation was the theoretical nuclear program TALYS (http://www.talys.eu/). TALYS is a user-friendly, efficient code for simulating nuclear reactions of 1 keV to 250 MeV projectiles. We validated the accuracy of TALYS for our purposes by comparing its calculated gamma-ray line production cross sections with measured cross sections where available. We explored the dependence of this continuum on various parameters relevant to solar flares.
The resulting unresolved-line continuum spectrum is quite different from that previously calculated with the line production code. For example, in Figure 21 we compare the previous continuum from 30 MeV protons interacting with 24Mg with the continuum as calculated with TALYS. Several differences can be seen. For example, the TALYS continuum shows a rich spectrum of features in contrast to the smooth shape of the previous. Also, the TALYS continuum extends to higher energies and does not exhibit the peak at 1–2 MeV. The unresolved-line continua as now implemented in the code are also improved in that they now depend on projectile energy, include α-particle reactions, and include C, N, and O targets.
Figure 21. Comparison of unresolved-line continuum from 30 MeV protons on 24Mg as calculated with TALYS and as given in RKL.
Download figure:
Standard image High-resolution image
Laboratory measurements of the unresolved-line continuum are important for establishing the reliability of the TALYS calculations we are using. Preliminary results of measurements of the total cross sections for gamma-ray emission at the Orsay tandem accelerator (Kiener et al. 2008) show remarkably good agreement in both shape and absolute magnitude for proton and α-particle reactions with 24Mg and 56Fe below 15 and 25 MeV nucleon−1, respectively. At higher energies, the measured cross sections are generally higher than the TALYS predictions, similar to the Zobel et al. (1968) comparison (see Section 4.4). When the analysis of these new data is complete, we will incorporate the results into the gamma-ray line code.
Finally, we use TALYS to improve the treatment of explicit lines addressed by the code. There are two aspects to this. First, for those lines already included, we use TALYS to provide the energy dependence of their cross sections at energies where no measurements exist. Previously, these dependences were estimated using assumptions of their behavior based on analogous reactions for which measurements were available. Second, we add a number of new lines to the code for which no measurements are available, using TALYS to provide the complete cross sections. Typically, these lines are relatively weak, with cross sections peaking from 10 to 100 mbarn.
Numerical cross section values for all lines explicitly addressed by the code and for the unresolved-line continua are given in the Appendix.
5.2. Impact of Modifications
The modifications to the original gamma-ray line production code have not significantly changed the calculated yields of the strongest narrow lines. The cross sections for most of the strongest proton-induced lines were well measured and have not been modified using the TALYS calculations. Although we have now modified many of the alpha-inelastic lines (see Section 3.1), adding additional reaction cross section at higher energies, the impact on the strong line yields is small (less than 10%). This is because the accelerated α/proton ratio is probably less than 1 and because α-particle line yields would only be affected by hard spectra and such hard spectra de-emphasize the contribution of the α interactions relative to protons due to their generally lower cross section threshold energies. De-excitation line yields published prior to the modifications described here (e.g., Ramaty et al. 1996; Murphy et al. 2007) are therefore still reasonably accurate.
Information about the flare process (such as the accelerated-proton spectral index) has been obtained (e.g., Ramaty et al. 1996) by comparing such calculated yields with measured (e.g., Share & Murphy 1995) narrow-line fluences. Conclusions from such studies are necessarily tentative since they depend on the assumed accelerated α/proton ratio and the composition of the ambient material, both of which have not been well established and may vary from flare to flare. In addition, recent studies of flare data obtained with the medium-resolution SMM/GRS detectors have shown that measured fluences of the strongest lines, derived by fitting them with Gaussian shapes along with smoothly varying shapes representing the remaining nuclear component (such as a number of very-broad Gaussians), depend on the shape assumed for that nuclear component. Our studies here of the unresolved-line continuum show that this remaining emission has considerable structure. Only spectra calculated with the gamma-ray line code itself will provide adequate modeling of this underlying emission. When flare data have been reanalyzed using such modeling, the reported measured line fluences will probably change, affecting conclusions reached about accelerated-ion spectra and composition and ambient abundances.
The most reliable approach to analyzing solar-flare gamma-ray data is to directly compare the measured spectra with spectra calculated under different assumptions. This allows the simultaneous optimization of as many parameters as the quality of the data will support; parameters such as accelerated-ion spectral index and ambient and accelerated compositions. Using the original RKL code, Murphy et al. (1991) determined abundances in this way using SMM/GRS data from the 1981 April 27 flare. They found a high accelerated α/proton ratio (>0.5) and enhanced ambient abundances of low first ionization potential (FIP) elements relative to O (i.e., more like the corona than the photosphere). Using the updated line production code, we have re-determined ambient and accelerated-ion abundances for this flare. We now find that with the new code the sensitivity of the derived abundances of ambient Mg and Si on the accelerated α/proton ratio has been reduced. While an α/proton ratio greater than that of either the corona or photosphere is still required, the enhancement of the low-FIP elements is not as large as was found originally by Murphy et al. (1991) for this flare.
The addition of unresolved-line continuum to the light elements C, N, and O has affected the determination of the accelerated-ion composition of these elements. Determining the accelerated-ion composition is inherently more difficult than the ambient composition because lines from these inverse reactions are significantly Doppler-broadened and therefore difficult to separate spectroscopically. The presence of unresolved-line continuum makes this even more true. We find that, at least for the April 27 flare, the addition of continuum to C, N, and O has decreased the significance of their derived abundances, in turn reducing the significance of the comparison of heavy-to-light element abundances. The initial conclusion of Murphy et al. (1991) that the flare accelerated-ion composition reflects that of the impulsive solar energetic particles is weakened.
Detailed abundance analyses of the gamma-ray line-producing flares observed with SMM and RHESSI using the revised gamma-ray line production code are in progress. We find that while the code revisions do impact the abundance results as noted above, other changes in the analysis procedure since the original determination by Murphy et al. (1991), such as an improved detector response model and more elaborate electron bremsstrahlung modeling, also significantly impact the abundance results. These abundance analyses will be reported elsewhere.
We are grateful to A. J. Koning for development of the powerful nuclear reaction code TALYS, his help in using the code, and his willingness to answer our questions concerning nuclear physics. This work was supported by NASA DPR W19,977 and grant NNG06GG14G and the Office of Naval Research. B. Kozlovsky acknowledges the Israeli Science Foundation for support.
APPENDIX
We supply numerical values for the cross sections for all explicit lines and for unresolved-line continua currently treated by the gamma-ray line production code.
There are three tables. The first two tables (Tables A1 and A2) provide the necessary information needed to use the cross sections given in the third table (Table A3). Table A1 includes all prompt explicit gamma-ray lines and lines from radioactive nuclei with mean lifetimes less than 100 s. Table A2 includes the unresolved-line continua. In Table A1, the first column gives the line energy in MeV, the second column gives the target nucleus of the reaction, and the third column gives the excited nucleus giving rise to the line. The fourth column gives the name of the cross section for proton-induced reactions. This name identifies the cross section that is given in Table A3. The fifth column gives the multiplicative factor which must be applied to all values of that cross section for the reaction. Columns 6 and 7 give the same information as Columns 4 and 5 but for alpha-induced reactions. Columns 8 and 9 give the same information but for 3He-induced reactions.
Table A1. Explicit Line Index
| Line (MeV) | Target | Excited Nucleus | Proton Name | Factor | Alpha Name | Factor | 3He Name | Factor |
|---|---|---|---|---|---|---|---|---|
| 0.053 | 56FE | 58CO | None | AFE053 | 1.00 | None | ||
| 0.110 | 20NE | 19F | PNE011 | 0.28 | None | None | ||
| 0.158 | 56FE | 56CO | COP | 0.50 | None | None | ||
| 0.197 | 20NE | 19F | PNE011 | 0.37 | None | None | ||
| 0.197 | 16O | 19F | None | AO197 | 1.00 | None | ||
| 0.238 | 20NE | 19NE | PNE011 | 0.20 | None | None | ||
| 0.275 | 20NE | 19NE | PNE011 | 0.15 | None | None | ||
| 0.321 | 56FE | 58CO | None | AFE321 | 1.00 | None | ||
| 0.339 | 56FE | 59NI | None | FNI33 | 1.00 | None | ||
| 0.351 | 20NE | 21NE | None | ANE351 | 1.00 | None | ||
| 0.412 | 56FE | 55FE | PFE411 | 1.00 | None | None | ||
| 0.417 | 24MG | 26AL | None | AMG417 | 1.00 | None | ||
| 0.431 | 4HE | 7BE | None | 43A | 1.00 | None |
Only a portion of this table is shown here to demonstrate its form and content. A machine-readable version of the full table is available.
Download table as: DataTypeset image
Table A2. Unresolved Line Index
| Target | Proton Name | Factor | Alpha Name | Factor |
|---|---|---|---|---|
| 12C | CTP | 1.00 | CTA | 1.00 |
| 14N | NTP | 1.00 | NTA | 1.00 |
| 16O | OTP | 1.00 | OTA | 1.00 |
| 20NE | NETP | 1.00 | NETA | 1.00 |
| 24MG | MGTP | 1.00 | MGTA | 1.00 |
| 27AL | SITP | 0.98 | SITA | 0.98 |
| 28SI | SITP | 1.00 | SITA | 1.00 |
| 32S | STP | 1.00 | STA | 1.00 |
| 40CA | SITP | 1.16 | SITA | 1.16 |
| 56FE | FETP | 1.00 | FETA | 1.00 |
A machine-readable version of the table is available.
Download table as: DataTypeset image
Table A3. Particle Energy and Cross Sections
| Reaction Name | Number of Entries | Energy (MeV nucleon−1) | Cross Section (mbarn) |
|---|---|---|---|
| 16AS | 12 | 3.50 | 0.1 |
| 16AS | 12 | 5.50 | 33.0 |
| 16AS | 12 | 5.75 | 59.0 |
| 16AS | 12 | 6.00 | 87.0 |
| 16AS | 12 | 6.25 | 127.0 |
| 16AS | 12 | 7.50 | 200.0 |
| 16AS | 12 | 10.0 | 106.1 |
| 16AS | 12 | 15.0 | 27.6 |
| 16AS | 12 | 20.0 | 108.4 |
| 16AS | 12 | 40.0 | 100.2 |
| 16AS | 12 | 100.0 | 20.0 |
| 16AS | 12 | 1000.0 | 1.0 |
Only a portion of this table is shown here to demonstrate its form and content. A machine-readable version of the full table is available.
Download table as: DataTypeset image
Table A2 includes the unresolved line continua. The first column gives the target nucleus of the reaction, the second column gives the cross section name for proton-induced reactions, and the third column gives the multiplicative factor which must be applied to all values of that cross section for the reaction. Columns 4 and 5 give the same information as Columns 2 and 3 but for alpha-induced reactions.
We note that Table A1 does not have a cross section name for every combination of projectile and target for every line (as indicated by the letter "none" in the table). There are two possible reasons for this. The first is that the given line cannot be produced by that combination. The second is the cross section for that combination is expected to be weak and so we ignore it. This is discussed in Section 3.1 of the paper.
Table A3 contains the cross section values for all of the reactions. The first column gives the name of the cross section as identified in the first two tables. The second column gives the number of energies for which cross section values are given. The third column gives the projectile energy values (in MeV nucleon−1) and the fourth column gives the cross section value (in mbarn) at each energy.