


ABSTRACT
In this study, a Fourier Transform spectrum of Niobium (Nb) is investigated in the near-infrared spectral range from 6000 to 12,000 cm−1 (830–1660 nm). The Nb spectrum is produced using a hollow cathode discharge lamp in an argon atmosphere. Both Nb and Ar spectral lines are visible in the spectrum. A total of 110 spectral lines are assigned to the element Nb. Of these lines, 90 could be classified as transitions between known levels of atomic Nb. From these classified Nb i transitions, 27 have not been listed in literature previously. Additionally, 8 lines are classified for the first time.
Export citation and abstract BibTeX RIS
1. INTRODUCTION
The hyperfine structure and classification of spectral lines of niobium (Nb) are important in astrophysics for the determination of elemental abundances in stellar atmospheres, as already discussed in Kröger et al. (2010).
Nb, with atomic number 41, is a transition metal and possesses only one stable isotope, 93Nb. This isotope has a nuclear spin of I = 9/2. Due to the large nuclear magnetic dipole moment  =
=  (Lederer & Shirley 1978), the spectrum of 93Nb shows a broad hyperfine structure, which is clearly visible in most lines even in Doppler-broadened spectra, for example, as in Fourier Transform (FT) spectra. The influence of the electric quadrupole interaction on the hyperfine structure is small for this isotope and can mostly be neglected in Doppler-broadened spectra.
The fine structure and the hyperfine structure of Nb have been the subject of several experimental investigations (see Kröger et al. 2010 and references therein). Although extensive studies have been performed, all of the wavelength lists compiled thus far for Nb have been limited to wavelengths below 1100 nm.
A very early, but still very important, work on the classification of Nb spectrum was performed by Humphreys & Meggers (1945).4 They recorded the spectrum of Nb from 200 to 1100 nm and identified 3313 lines of neutral atom Nb as well as 1723 lines of singly ionized Nb. From the 3313 atomic lines, they classified 2836 as combinations among 364 atomic energy levels; from the 1723 ionic lines, they classified 1494 as combinations of 183 ionic energy levels. In this reference, the 364 atomic and 183 ionic levels are given with their total electronic angular momentum quantum number J, spectral terms, and configurations, and they have served as the basis for all subsequent investigations of Nb. These data are complemented and in a few cases revised by new energy levels from Kröger et al. (2004, 2007) and Öztürk et al. (2015).
The aim of the present work is to extend the wavelength range of the Nb spectral line list to the near-infrared up to 1660 nm in order to provide a basis for future astrophysical investigations.
2. EXPERIMENTAL DETAILS
In our experiments, Nb vapor was generated in a hollow cathode lamp that was cooled with liquid nitrogen in order to reduce Doppler broadening. A 20 mm long hollow copper cylinder served as the cathode. The hole had an internal diameter of 3 mm and was covered by a 0.125 mm thick Nb foil. The hollow cathode lamp was filled with argon at a pressure of approximately 3 mbar. The discharge was running at a current of 50 mA. For more details on the hollow cathode lamp, see Messnarz & Guthöhrlein (2000).
Using the high-resolution Bruker IFS 125 HR FT spectrometer and an InGaAs diode as a detector, the spectrum was recorded in the range from 830 to 1660 nm (6000 to 12,000 cm−1). The experiments took place at the Laser Centre of the University of Latvia. The entrance aperture of the spectrometer was set as 2 mm resulting in a spectral resolution of 0.05 cm−1 in the IR wavelength range. This resolution was chosen as low in order to increase the signal-to-noise ratio  and detect weak spectral lines.
We checked the accuracy of the measured wavenumbers in the FT spectra by choosing those lines in our FT spectrum that had been previously classified as Ar lines by comparing their frequencies with the corresponding differences of the Ar energy levels, which were taken from Minnhagen (1973) and Palmeri & Biémont (1995) for the atom and from Saloman (2010) for the first ion. The mean value of the difference between the values from the experiment and from the literature for all of the more than 350 classified Ar lines is 0.0002 cm−1; the maximum deviation does not exceed 0.004 cm−1. Thus, the calibration of the FT spectrometer was confirmed. The achieved accuracy is better than 0.004 cm−1 in the wavelength range from 830 to 1 660 nm.
The relative line intensity is not calibrated for the instrumental response. Instead, only the S/N is determined, which depends on the line intensity but is not proportional because the area within the spectral profile is not taken into account. The S/N values given in the present work correspond to the amplitude of the highest peak of a line.
In Figure 1, a representative portion of the spectrum is presented which shows four Nb lines as well as a few ionic Ar lines.
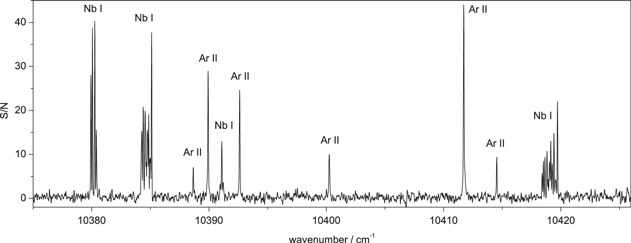
Figure 1. Representative part of the Fourier Transform spectrum of the Nb–Ar plasma.
Download figure:
Standard image High-resolution imageWe estimated the line pattern width W as a distance measured at points where the intensity had fallen by a factor  with respect to the maximum. If the S/N was lower than eight, the width was defined as the distance between the points where the line profile rises above the noise level.
3. CLASSIFICATION METHOD
In the spectrum of the Nb–Ar plasma, both niobium and argon lines were observed. The program Class_lw (Windholz & Guthöhrlein 2003) was used to classify the spectral lines. This program is based on a list of all of the known fine structure levels of atomic and ionic Nb and Ar, which includes information about the total electronic angular momentum J and the parity, as well as the available magnetic dipole and electric quadrupole hyperfine structure constants A and B, respectively. Information about the fine structure levels comes from Humphreys & Meggers (1945), Kröger et al. (2004, 2007), and Öztürk et al. (2015) for Nb and from Minnhagen (1973), Palmeri & Biémont (1995), and Saloman (2010) for Ar. The hyperfine structure constants A and B for Nb i were taken from Büttgenbach et al. (1975), Büttgenbach & Dicke (1975), Fraenkel et al. (1988), Singh & Rao (1989), Singh et al. (1992), Bouzed et al. (2003), Kröger & Bouzed (2003), Kröger et al. (2004, 2010), Kröger (2007), Başar et al. (2008, 2013), Er et al. (2011), and Öztürk et al. (2015), and for the Nb ii from Nilsson & Ivarsson (2008). The most current Nb level list contains 382 Nb i levels and 185 Nb ii levels. Hyperfine structure data are available for 220 Nb i levels (104 levels with A and B constants and 116 levels only with A constants) and 53 Nb ii levels.
The classification program calculates all of the possible transitions which meet the selection rules for optical dipole transitions and lie within a predefined wavenumber interval around the approximate experimental center of gravity of the line. For this wavenumber interval, we have chosen the value of±0.1 cm−1.
The hyperfine structure of the line, which can be simulated using a Gaussian profile with the classification program, served as a fingerprint that allowed us to confirm or disprove a predicted transition. For all of the classified Nb lines, the magnetic dipole hyperfine structure constants A of both levels of the transition were known. In about a quarter of the cases, more than one level combinations were predicted by the classification program for a particular spectral line. In these cases, the hyperfine structure was the decisive criterion for the classification choice.
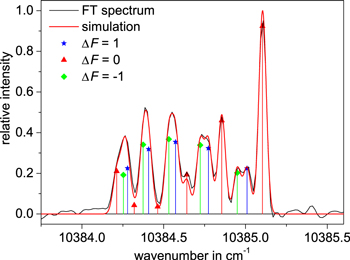
The simulated hyperfine spectrum, shown in a graphic window together with the experimental curve, can be shifted along the wavenumber axis until the simulated and measured curves coincide. In this way the center of gravity can be precisely determined from the FT spectrum. An example of a simulated hyperfine structure is shown in Figure 2. With this procedure, the center of gravity of the line can be determined very accurately, i.e., with an uncertainty of 0.003 cm−1. As long as the S/N is higher than four, the accuracy of the center of gravity is almost independent of the S/N ratio. If we assume a systematic calibration error of 0.004 cm−1, the absolute wavenumber accuracy of the center of gravity is better than 0.007 cm−1. Such accuracy corresponds to 0.5 pm at 830 nm and 1.9 pm at 1660 nm, respectively.
Figure 2. Example of a simulated and an experimental hyperfine structure pattern for the line at  or
or  cm−1. Here, both curves overlap perfectly. Vertical bars depict the relative intensities of a particular hyperfine transition.
Download figure:
Standard image High-resolution image
Using our experimental setup and operating conditions, the Doppler widths of the lines are of the same order of magnitude as the resolution of the FT spectrometer. By applying convolution of the instrumental width of the FT spectrometer with the Doppler width, the FWHM of the hyperfine components takes a value between 0.08 cm−1 at 12,000 cm−1 and 0.06 cm−1 at 6000 cm−1. In the present analysis, very few of the classified Nb lines appear to be fully resolved, while most of the lines are only partially resolved and some are even unresolved.
The lines with only one symmetrical peak are generally Ar lines, but they may also be Nb lines with a narrow hyperfine pattern. To further improve the identification of Ar lines, a list of Ar lines resulting from the analysis of an FT spectrum of Ar–lanthanum plasma (Güzelçimen et al. 2013) were used for comparison. For a number of narrow lines with only one symmetrical peak, no classification could be found. If they do not appear in the La–Ar spectrum, then it is not clear whether these lines are Nb or Ar lines; in any case, a number of unknown levels are observed.
4. RESULTS
In our FT spectrum, more than 800 lines could be observed, the majority of which are Ar lines. In Table 1, which contains 210 entries, a list of all classified Nb lines and all unclassified lines is provided. Those lines unambiguously identified as Ar lines (atomic and ionic) are not listed in the present paper. For anyone interested in a table of Ar lines, we refer to the list resulting from our measurements of La–Ar plasma (Güzelçimen et al. 2013).
Table 1. List of Nb Lines From 6000 to 12,000 cm−1 Classified in the Present FT Spectrum
| W |

|
S/R | int |

|

|

|
Comment | Element |

|

|

|

|
npt |
|---|---|---|---|---|---|---|---|---|---|---|---|---|---|
| (mK) | (mK) | from (1) | (nm) | (cm−1) | (cm−1) | (cm−1) | (cm−1) | ||||||
| 171 | ⋯ | 3 | ⋯ | 833.506 | 11,994.22 | ⋯ | ⋯ | Nb or Ar | ⋯ | ⋯ | ⋯ | ⋯ | ⋯ |
| 179 | −21 | 18 | 60 | 834.6078 | 11,978.383 | 0.097 | ⋯ | Nb i | 11,044.08 | 9/2 | 23,022.56 | 7/2 | 1 |
| 426 | ⋯ | 8 | ⋯ | 834.805 | 11,975.56 | ⋯ | ⋯ | Nb | ⋯ | ⋯ | ⋯ | ⋯ | ⋯ |
| 601 | −214 | 3 | 20 | 835.0033 | 11,972.710 | 0.010 | ⋯ | Nb i | 8410.90 | 1/2 | 20,383.62 | 3/2 | 1 |
| 586 | 581 | 7 | ⋯ | 839.2358 | 11,912.328 | 0.072 | b | Nb i | 20,060.84 | 7/2 | 31,973.24 | 7/2 | 1 |
| 763 | −712 | 3 | 15c | 840.6252 | 11,892.639 | −0.019 | b | Nb i | 15,467.08 | 5/2 | 27,359.70 | 5/2 | 1 |
| 140 | −99 | 3 | 5 | 841.4747 | 11,880.633 | 0.047 | ⋯ | Nb i | 10,126.06 | 1/2 | 22,006.74 | 1/2 | 1 |
| 348 | 240 | 3 | 25c | 843.9775 | 11,845.402 | −0.052 | ⋯ | Nb i | 12,357.70 | 9/2 | 24,203.05 | 11/2 | 1 |
| 1102 | 1013 | 12 | 150c | 847.5989 | 11,794.792 | 0.048 | ⋯ | Nb i | 9043.14 | 5/2 | 20,837.98 | 5/2 | 1 |
| 617 | ⋯ | 4 | ⋯ | 850.376 | 11,756.27 | ⋯ | ⋯ | Nb | ⋯ | ⋯ | ⋯ | ⋯ | ⋯ |
| 193 | 97 | 16 | 50 | 852.6995 | 11,724.239 | 0.051 | ⋯ | Nb i | 10,922.74 | 7/2 | 22,647.03 | 5/2 | 1 |
| 668 | −465 | 6 | 20c | 854.7261 | 11,696.441 | 0.019 | ⋯ | Nb i | 8410.90 | 1/2 | 20,107.36 | 1/2 | 4 |
| 593 | 369 | 8 | 30c | 856.0555 | 11,678.277 | 0.023 | ⋯ | Nb i | 8705.32 | 3/2 | 20,383.62 | 3/2 | 1 |
| 481 | ⋯ | 3 | ⋯ | 856.500 | 11,672.21 | ⋯ | ⋯ | Nb | ⋯ | ⋯ | ⋯ | ⋯ | ⋯ |
| 567 | −352 | 2 | 30c | 857.5850 | 11,657.449 | −0.039 | ⋯ | Nb i | 12,357.70 | 9/2 | 24,015.11 | 7/2 | 1 |
| 1068 | −847 | 3 | 20c | 861.4438 | 11,605.230 | −0.010 | ⋯ | Nb i | 16,828.52 | 9/2 | 28,433.74 | 9/2 | 1 |
| 203 | ⋯ | 3 | ⋯ | 865.018 | 11,557.27 | ⋯ | ⋯ | Nb or Ar | ⋯ | ⋯ | ⋯ | ⋯ | ⋯ |
| 555 | −390 | 4 | 40c | 869.7548 | 11,494.336 | −0.006 | ⋯ | Nb i | 13,012.20 | 11/2 | 24,506.53 | 9/2 | 1 |
| 418 | 264 | 2 | 4 | 871.7066 | 11,468.600 | 0.010 | nc | Nb i | 19,556.91 | 9/2 | 31,025.52 | 7/2 | 1 |
| 306 | −74 | 8 | 20 | 874.0953 | 11,437.259 | 0.021 | ⋯ | Nb i | 12,136.86 | 7/2 | 23,574.14 | 5/2 | 1 |
| 233 | −104 | 13 | 12 | 876.7971 | 11,402.016 | 0.024 | ⋯ | Nb i | 8705.32 | 3/2 | 20,107.36 | 1/2 | 1 |
| 359 | 299 | 3 | 7c | 876.9580 | 11,399.924 | −0.014 | ⋯ | Nb i | 12,136.86 | 7/2 | 23,536.77 | 9/2 | 2 |
| 274 | −111 | 3 | 7 | 879.9742 | 11,360.849 | −0.029 | ⋯ | Nb i | 13,145.71 | 9/2 | 24,506.53 | 9/2 | 2 |
| 966 | 542 | 13 | 100c | 881.5568 | 11,340.454 | 0.026 | b | Nb i | 9043.14 | 5/2 | 20,383.62 | 3/2 | 5 |
| 1286 | 1151 | 13 | 100c | 881.5612 | 11,340.397 | 0.063 | b | Nb i | 9497.52 | 7/2 | 20,837.98 | 5/2 | 5 |
| 639 | 593 | 2 | 4 | 889.6274 | 11,237.576 | −0.026 | ⋯ | Nb i | 12,288.25 | 3/2 | 23,525.80 | 3/2 | 1 |
| 967 | 1584 | 2 | ⋯ | 889.7275 | 11,236.311 | 0.049 | ⋯ | Nb i | 9497.52 | 7/2 | 20,733.88 | 9/2 | 2 |
| 122 | 52 | 14 | 20 | 890.5780 | 11,225.580 | 0.040 | ⋯ | Nb i | 12,018.25 | 5/2 | 23,243.87 | 3/2 | 1 |
| 707 | −48 | 4 | 4c | 891.5769 | 11,213.003 | 0.057 | ⋯ | Nb i | 8410.90 | 1/2 | 19,623.96 | 1/2 | 1 |
| 444 | 74 | 5 | 6 | 893.3421 | 11,190.847 | 0.003 | ⋯ | Nb i | 13,012.20 | 11/2 | 24,203.05 | 11/2 | 1 |
| 778 | −645 | 2 | 20c | 895.9757 | 11,157.954 | 0.026 | ⋯ | Nb i | 15,282.35 | 7/2 | 26,440.33 | 9/2 | 2 |
| 266 | −80 | 3 | 7 | 901.1768 | 11,093.556 | −0.016 | nc | Nb i | 19,931.98 | 5/2 | 31,025.52 | 7/2 | 1 |
| 611 | 533 | 3 | 8 | 903.9240 | 11,059.841 | 0.019 | ⋯ | Nb i | 8705.32 | 3/2 | 19,765.18 | 3/2 | 1 |
| 437 | 353 | 2 | 2 | 904.1267 | 11,057.361 | −0.021 | ⋯ | Nb i | 13,145.71 | 9/2 | 24,203.05 | 11/2 | 1 |
| 272 | ⋯ | 3 | ⋯ | 906.030 | 11,034.13 | ⋯ | ⋯ | Nb | ⋯ | ⋯ | ⋯ | ⋯ | ⋯ |
| 354 | 32 | 6 | 20c | 906.1457 | 11,032.724 | 0.006 | ⋯ | Nb i | 12,982.38 | 7/2 | 24,015.11 | 7/2 | 1 |
| 176 | ⋯ | 3 | ⋯ | 906.602 | 11,027.17 | ⋯ | ⋯ | Nb | ⋯ | ⋯ | ⋯ | ⋯ | ⋯ |
| 797 | 514 | 3 | 7 | 908.4910 | 11,004.243 | 0.067 | ⋯ | Nb i | 12,018.25 | 5/2 | 23,022.56 | 7/2 | 1 |
| 215 | −9 | 3 | ⋯ | 909.7853 | 10,988.588 | 0.022 | ⋯ | Nb i | 12,018.25 | 5/2 | 23,006.86 | 3/2 | 1 |
| 237 | 136 | 2 | 7 | 911.7737 | 10,964.624 | 0.056 | nc | Nb i | 20,060.84 | 7/2 | 31,025.52 | 7/2 | 1 |
| 1288 | 1029 | 7 | 10c | 912.9420 | 10,950.592 | 0.048 | ⋯ | Nb i | 9043.14 | 5/2 | 19,993.78 | 5/2 | 1 |
| 748 | 511 | 7 | 50c | 914.1344 | 10,936.308 | 0.042 | ⋯ | Nb i | 16,918.78 | 7/2 | 27,855.13 | 7/2 | 1 |
| 226 | ⋯ | 4 | ⋯ | 917.754 | 10,893.17 | ⋯ | a | Nb or Ar | ⋯ | ⋯ | ⋯ | ⋯ | ⋯ |
| 489 | 146 | 6 | 20 | 918.6960 | 10,882.007 | 0.013 | ⋯ | Nb i | 12,692.12 | 5/2 | 23,574.14 | 5/2 | 1 |
| 422 | −244 | 3 | 15 | 919.7620 | 10,869.394 | 0.006 | ⋯ | Nb i | 13,145.71 | 9/2 | 24,015.11 | 7/2 | 2 |
| 98 | ⋯ | 6 | ⋯ | 924.061 | 10,818.82 | ⋯ | ⋯ | Nb or Ar | ⋯ | ⋯ | ⋯ | ⋯ | ⋯ |
| 1662 | 1474 | 7 | ⋯ | 924.1179 | 10,818.161 | 0.059 | ⋯ | Nb i | 9497.52 | 7/2 | 20,315.74 | 7/2 | 1 |
| 711 | 469 | 11 | 40c | 932.3605 | 10,722.523 | 0.057 | ⋯ | Nb i | 8705.32 | 3/2 | 19,427.9 | 5/2 | 6 |
| 102 | ⋯ | 5 | ⋯ | 934.163 | 10,701.84 | ⋯ | ⋯ | Nb or Ar | ⋯ | ⋯ | ⋯ | ⋯ | ⋯ |
| 93 | ⋯ | 5 | ⋯ | 934.243 | 10,700.92 | ⋯ | a | Nb or Ar | ⋯ | ⋯ | ⋯ | ⋯ | ⋯ |
| 257 | −79 | 10 | 10 | 935.3188 | 10,688.609 | 0.041 | ⋯ | Nb i | 11,318.09 | 3/2 | 22,006.74 | 1/2 | 1 |
| 505 | −225 | 23 | 20 | 940.8631 | 10,625.623 | 0.027 | ⋯ | Nb i | 8410.90 | 1/2 | 19,036.55 | 3/2 | 2 |
| 323 | −80 | 3 | 4 | 941.2410 | 10,621.357 | 0.043 | ⋯ | Nb i | 15,439.25 | 3/2 | 26,060.65 | 5/2 | 1 |
| 272 | −136 | 4 | 8h | 943.8704 | 10,591.769 | −0.009 | ⋯ | Nb i | 12,982.38 | 7/2 | 23,574.14 | 5/2 | 1 |
| 344 | 227 | 4 | 4 | 947.2084 | 10,554.443 | −0.053 | ⋯ | Nb i | 12,982.38 | 7/2 | 23,536.77 | 9/2 | 1 |
| 414 | −212 | 3 | 5 | 947.4539 | 10,551.708 | 0.042 | ⋯ | Nb i | 12,692.12 | 5/2 | 23,243.87 | 3/2 | 1 |
| 819 | 302 | 2 | 8c | 954.9187 | 10,469.224 | 0.016 | ⋯ | Nb i | 15,460.77 | 1/2 | 25,930.01 | 3/2 | 1 |
| 1386 | 1338 | 21 | 60c | 959.5115 | 10,419.112 | 0.058 | ⋯ | Nb i | 9497.52 | 7/2 | 19,916.69 | 7/2 | 6 |
| 430 | −50 | 12 | 10 | 962.0980 | 10,391.101 | −0.041 | ⋯ | Nb i | 13,145.71 | 9/2 | 23,536.77 | 9/2 | 1 |
| 963 | 892 | 37 | 100c | 962.6908 | 10,384.703 | 0.057 | ⋯ | Nb i | 9043.14 | 5/2 | 19,427.90 | 5/2 | 3 |
| 550 | −465 | 39 | 50c | 963.1142 | 10,380.137 | 0.053 | ⋯ | Nb i | 8410.90 | 1/2 | 18,791.09 | 1/2 | 2 |
| 335 | 248 | 13 | 12 | 965.1002 | 10,358.777 | 0.003 | ⋯ | Nb i | 12,288.25 | 3/2 | 22,647.03 | 5/2 | 2 |
| 421 | 341 | 46 | 50 | 967.6769 | 10,331.194 | 0.036 | ⋯ | Nb i | 8705.32 | 3/2 | 19,036.55 | 3/2 | 1 |
| 314 | 148 | 4 | 4 | 967.7546 | 10,330.365 | 0.075 | b | Nb i | 12,692.12 | 5/2 | 23,022.56 | 7/2 | 1 |
| 228 | 54 | 6 | ⋯ | 982.5590 | 10,174.716 | −0.006 | ⋯ | Nb i | 19,034.71 | 7/2 | 29,209.42 | 7/2 | 1 |
| 276 | ⋯ | 3 | ⋯ | 985.001 | 10,149.49 | ⋯ | ⋯ | Nb | ⋯ | ⋯ | ⋯ | ⋯ | ⋯ |
| 387 | 264 | 2 | 5 | 989.6633 | 10,101.677 | 0.023 | ⋯ | Nb i | 18,332.04 | 11/2 | 28,433.74 | 9/2 | 1 |
| 404 | 248 | 4 | 20 | 991.0349 | 10,087.696 | 0.024 | nc, b | Nb i | 23,048.58 | 11/2 | 33,136.3 | 9/2 | 2 |
| 212 | −103 | 43 | 25 | 991.2300 | 10,085.710 | 0.060 | ⋯ | Nb i | 8705.32 | 3/2 | 18,791.09 | 1/2 | 1 |
| 388 | 3 | ⋯ | 994.357 | 10,053.00 | ⋯ | ⋯ | Nb | ⋯ | ⋯ | ⋯ | ⋯ | ⋯ | |
| 346 | −156 | 9 | 15 | 995.7310 | 10,040.120 | 0.060 | ⋯ | Nb i | 12,982.38 | 7/2 | 23,022.56 | 7/2 | 1 |
| 430 | ⋯ | 3 | ⋯ | 998.856 | 10,008.71 | ⋯ | ⋯ | Nb | ⋯ | ⋯ | ⋯ | ⋯ | |
| 691 | 513 | 27 | 30c | 1000.3886 | 9993.375 | 0.035 | ⋯ | Nb i | 9043.14 | 5/2 | 19,036.55 | 3/2 | 4 |
| 500 | 312 | 4 | 2 | 1001.9443 | 9977.859 | 0.041 | ⋯ | Nb i | 16,918.78 | 7/2 | 26,896.68 | 7/2 | 1 |
| 402 | −348 | 7 | 10c | 1004.2563 | 9954.888 | 0.022 | ⋯ | Nb i | 12,692.12 | 5/2 | 22,647.03 | 5/2 | 1 |
| 1174 | 1028 | 11 | 20c | 1006.7425 | 9930.304 | 0.076 | ⋯ | Nb i | 9497.52 | 7/2 | 19,427.9 | 5/2 | 1 |
| 512 | 441 | 2 | 5c | 1008.445 | 9913.53 | ⋯ | ⋯ | Nb i | 16,918.78 | 7/2 | 26,832.43 | 7/2 | 1 |
| 157 | 123 | 2 | 4 | 1011.0026 | 9888.460 | 0.040 | nc | Nb i | 23,010.58 | 9/2 | 32,899.08 | 7/2 | 3 |
| 83 | ⋯ | 4 | ⋯ | 1017.433 | 9825.96 | ⋯ | a | Nb or Ar | ⋯ | ⋯ | ⋯ | ⋯ | ⋯ |
| 585 | −480 | 3 | 10c | 1018.1443 | 9819.099 | 0.061 | ⋯ | Nb i | 18,035.97 | 9/2 | 27,855.13 | 7/2 | 1 |
| 675 | ⋯ | 5 | ⋯ | 1020.365 | 9797.73 | ⋯ | ⋯ | Nb | ⋯ | ⋯ | ⋯ | ⋯ | ⋯ |
| 92 | ⋯ | 8 | ⋯ | 1025.744 | 9746.35 | ⋯ | a | Nb or Ar | ⋯ | ⋯ | ⋯ | ⋯ | ⋯ |
| 80 | ⋯ | 6 | ⋯ | 1028.981 | 9715.69 | ⋯ | a | Nb or Ar | ⋯ | ⋯ | ⋯ | ⋯ | ⋯ |
| 419 | ⋯ | 4 | ⋯ | 1035.967 | 9650.18 | ⋯ | ⋯ | Nb | ⋯ | ⋯ | ⋯ | ⋯ | ⋯ |
| 570 | ⋯ | 3 | ⋯ | 1038.368 | 9627.86 | ⋯ | ⋯ | Nb | ⋯ | ⋯ | ⋯ | ⋯ | ⋯ |
| 119 | ⋯ | 3 | ⋯ | 1039.411 | 9618.20 | ⋯ | ⋯ | Nb or Ar | ⋯ | ⋯ | ⋯ | ⋯ | ⋯ |
| 273 | ⋯ | 4 | ⋯ | 1043.380 | 9581.61 | ⋯ | ⋯ | Nb | ⋯ | ⋯ | ⋯ | ⋯ | ⋯ |
| 119 | ⋯ | 13 | ⋯ | 1044.778 | 9568.78 | ⋯ | ⋯ | Nb or Ar | ⋯ | ⋯ | ⋯ | ⋯ | ⋯ |
| 426 | 377 | 2 | 3 | 1045.2586 | 9564.389 | 0.041 | nc | Nb i | 22,936.90 | 7/2 | 32,501.33 | 7/2 | 1 |
| 85 | ⋯ | 11 | ⋯ | 1047.314 | 9545.62 | ⋯ | ⋯ | Nb or Ar | ⋯ | ⋯ | ⋯ | ⋯ | ⋯ |
| 290 | ⋯ | 4 | ⋯ | 1050.056 | 9520.69 | ⋯ | ⋯ | Nb | ⋯ | ⋯ | ⋯ | ⋯ | ⋯ |
| 327 | ⋯ | 6 | ⋯ | 1054.924 | 9476.76 | ⋯ | ⋯ | Nb | ⋯ | ⋯ | ⋯ | ⋯ | ⋯ |
| 163 | ⋯ | 4 | ⋯ | 1061.825 | 9415.16 | ⋯ | ⋯ | Nb or Ar | ⋯ | ⋯ | ⋯ | ⋯ | ⋯ |
| 408 | −306 | 3 | 4 | 1063.6449 | 9399.059 | −0.029 | nc | Nb i | 19,034.71 | 7/2 | 28,433.74 | 9/2 | 1 |
| 579 | 431 | 2 | ⋯ | 1066.3414 | 9375.291 | 0.029 | ⋯ | Nb i | 12,136.86 | 7/2 | 21,512.18 | 7/2 | 1 |
| 211 | ⋯ | 4 | ⋯ | 1077.714 | 9276.36 | ⋯ | ⋯ | Nb or Ar | ⋯ | ⋯ | ⋯ | ⋯ | ⋯ |
| 183 | 62 | 6 | 2 | 1086.3194 | 9202.875 | 0.005 | nc | Nb i | 22,936.9 | 7/2 | 32,139.78 | 5/2 | 1 |
| 280 | −19 | 12 | ⋯ | 1092.0561 | 9154.531 | −0.051 | ⋯ | Nb i | 12,357.7 | 9/2 | 21,512.18 | 7/2 | 1 |
| 70 | ⋯ | 5 | ⋯ | 1121.732 | 8912.35 | ⋯ | ⋯ | Nb or Ar | ⋯ | ⋯ | ⋯ | ⋯ | ⋯ |
| 170 | 100 | 15 | ⋯ | 1126.2232 | 8876.804 | 0.026 | b | Nb i | 19,556.91 | 9/2 | 28,433.74 | 9/2 | 1 |
| 260 | −46 | 8 | ⋯ | 1133.4230 | 8820.416 | 0.004 | ⋯ | Nb i | 19,034.71 | 7/2 | 27,855.13 | 7/2 | 1 |
| 266 | −5 | 6 | ⋯ | 1140.8867 | 8762.713 | 0.017 | ⋯ | Nb i | 19,034.71 | 7/2 | 27,797.44 | 5/2 | 1 |
| 142 | ⋯ | 3 | ⋯ | 1154.509 | 8659.32 | ⋯ | ⋯ | Nb or Ar | ⋯ | ⋯ | ⋯ | ⋯ | ⋯ |
| 137 | 36 | 6 | ⋯ | 1157.481 | 8637.09 | ⋯ | ⋯ | Nb or Ar | ⋯ | ⋯ | ⋯ | ⋯ | ⋯ |
| 156 | ⋯ | 3 | ⋯ | 1158.192 | 8631.79 | ⋯ | ⋯ | Nb or Ar | ⋯ | ⋯ | ⋯ | ⋯ | ⋯ |
| 170 | ⋯ | 4 | ⋯ | 1159.240 | 8623.98 | ⋯ | ⋯ | Nb or Ar | ⋯ | ⋯ | ⋯ | ⋯ | ⋯ |
| 87 | ⋯ | 4 | ⋯ | 1160.882 | 8611.78 | ⋯ | ⋯ | Nb or Ar | ⋯ | ⋯ | ⋯ | ⋯ | ⋯ |
| 135 | ⋯ | 4 | ⋯ | 1160.910 | 8611.58 | ⋯ | ⋯ | Nb or Ar | ⋯ | ⋯ | ⋯ | ⋯ | ⋯ |
| 85 | ⋯ | 5 | ⋯ | 1161.176 | 8609.60 | ⋯ | a | Nb or Ar | ⋯ | ⋯ | ⋯ | ⋯ | ⋯ |
| 122 | ⋯ | 4 | ⋯ | 1161.339 | 8608.39 | ⋯ | a | Nb or Ar | ⋯ | ⋯ | ⋯ | ⋯ | ⋯ |
| 127 | ⋯ | 4 | ⋯ | 1162.792 | 8597.64 | ⋯ | ⋯ | Nb or Ar | ⋯ | ⋯ | ⋯ | ⋯ | ⋯ |
| 374 | ⋯ | 4 | ⋯ | 1163.359 | 8593.45 | ⋯ | ⋯ | Nb | ⋯ | ⋯ | ⋯ | ⋯ | ⋯ |
| 75 | ⋯ | 3 | ⋯ | 1163.595 | 8591.70 | ⋯ | ⋯ | Nb | ⋯ | ⋯ | ⋯ | ⋯ | ⋯ |
| 89 | ⋯ | 5 | ⋯ | 1163.976 | 8588.89 | ⋯ | ⋯ | Nb or Ar | ⋯ | ⋯ | ⋯ | ⋯ | ⋯ |
| 192 | 35 | 3 | ⋯ | 1165.2597 | 8579.429 | −0.039 | ⋯ | Nb i | 19,034.71 | 7/2 | 27,614.1 | 5/2 | 1 |
| 196 | ⋯ | 4 | ⋯ | 1168.395 | 8556.41 | ⋯ | ⋯ | Nb or Ar | ⋯ | ⋯ | ⋯ | ⋯ | ⋯ |
| 124 | ⋯ | 3 | ⋯ | 1168.686 | 8554.28 | ⋯ | ⋯ | Nb or Ar | ⋯ | ⋯ | ⋯ | ⋯ | ⋯ |
| 110 | ⋯ | 8 | ⋯ | 1168.910 | 8552.64 | ⋯ | ⋯ | Nb or Ar | ⋯ | ⋯ | ⋯ | ⋯ | ⋯ |
| 148 | ⋯ | 4 | ⋯ | 1169.607 | 8547.54 | ⋯ | ⋯ | Nb or Ar | ⋯ | ⋯ | ⋯ | ⋯ | ⋯ |
| 265 | 147 | 6 | ⋯ | 1169.8694 | 8545.623 | −0.003 | ⋯ | Nb i | 15,439.25 | 3/2 | 23,984.87 | 1/2 | 1 |
| 331 | ⋯ | 5 | ⋯ | 1170.717 | 8539.44 | ⋯ | ⋯ | Nb | ⋯ | ⋯ | ⋯ | ⋯ | ⋯ |
| 82 | ⋯ | 5 | ⋯ | 1171.417 | 8534.34 | ⋯ | ⋯ | Nb or Ar | ⋯ | ⋯ | ⋯ | ⋯ | ⋯ |
| 113 | ⋯ | 3 | ⋯ | 1172.505 | 8526.41 | ⋯ | ⋯ | Nb or Ar | ⋯ | ⋯ | ⋯ | ⋯ | ⋯ |
| 244 | ⋯ | 4 | ⋯ | 1172.689 | 8525.08 | ⋯ | ⋯ | Nb or Ar | ⋯ | ⋯ | ⋯ | ⋯ | ⋯ |
| 122 | 99 | 8 | ⋯ | 1185.5216 | 8432.797 | −0.037 | ⋯ | Nb i | 37,578.72 | 3/2 | 46,011.48 | 5/2 | 1 |
| 99 | ⋯ | 5 | ⋯ | 1187.774 | 8416.80 | ⋯ | ⋯ | Nb or Ar | ⋯ | ⋯ | ⋯ | ⋯ | ⋯ |
| 160 | −34 | 11 | ⋯ | 1194.0077 | 8372.863 | 0.037 | ⋯ | Nb i | 20,060.84 | 7/2 | 28,433.74 | 9/2 | 1 |
| 222 | 89 | 10 | ⋯ | 1194.9204 | 8366.468 | 0.002 | ⋯ | Nb i | 13,145.71 | 9/2 | 21,512.18 | 7/2 | 1 |
| 171 | ⋯ | 5 | ⋯ | 1197.603 | 8347.73 | ⋯ | ⋯ | Nb or Ar | ⋯ | ⋯ | ⋯ | ⋯ | ⋯ |
| 123 | ⋯ | 3 | ⋯ | 1200.211 | 8329.59 | ⋯ | ⋯ | Nb or Ar | ⋯ | ⋯ | ⋯ | ⋯ | ⋯ |
| 243 | ⋯ | 3 | ⋯ | 1200.565 | 8327.13 | ⋯ | ⋯ | Nb or Ar | ⋯ | ⋯ | ⋯ | ⋯ | ⋯ |
| 187 | −3 | 8 | ⋯ | 1261.7787 | 7923.152 | −0.002 | ⋯ | Nb i | 19,931.98 | 5/2 | 27,855.13 | 7/2 | 1 |
| 200 | 111 | 6 | ⋯ | 1272.6302 | 7855.593 | 0.007 | b | Nb i | 12,982.38 | 7/2 | 20,837.98 | 5/2 | 1 |
| 98 | ⋯ | 4 | ⋯ | 1288.325 | 7759.89 | ⋯ | ⋯ | Nb or Ar | ⋯ | ⋯ | ⋯ | ⋯ | ⋯ |
| 76 | ⋯ | 4 | ⋯ | 1289.542 | 7752.57 | ⋯ | ⋯ | Nb or Ar | ⋯ | ⋯ | ⋯ | ⋯ | ⋯ |
| 163 | ⋯ | 3 | ⋯ | 1290.256 | 7748.28 | ⋯ | ⋯ | Nb or Ar | ⋯ | ⋯ | ⋯ | ⋯ | ⋯ |
| 74 | ⋯ | 4 | ⋯ | 1290.631 | 7746.03 | ⋯ | ⋯ | Nb or Ar | ⋯ | ⋯ | ⋯ | ⋯ | ⋯ |
| 85 | ⋯ | 3 | ⋯ | 1290.663 | 7745.84 | ⋯ | ⋯ | Nb or Ar | ⋯ | ⋯ | ⋯ | ⋯ | ⋯ |
| 92 | ⋯ | 4 | ⋯ | 1299.156 | 7695.20 | ⋯ | ⋯ | Nb or Ar | ⋯ | ⋯ | ⋯ | ⋯ | ⋯ |
| 75 | ⋯ | 3 | ⋯ | 1299.407 | 7693.71 | ⋯ | ⋯ | Nb or Ar | ⋯ | ⋯ | ⋯ | ⋯ | ⋯ |
| 207 | ⋯ | 4 | ⋯ | 1299.687 | 7692.06 | ⋯ | ⋯ | Nb or Ar | ⋯ | ⋯ | ⋯ | ⋯ | ⋯ |
| 83 | ⋯ | 4 | ⋯ | 1299.884 | 7690.89 | ⋯ | ⋯ | Nb or Ar | ⋯ | ⋯ | ⋯ | ⋯ | ⋯ |
| 198 | ⋯ | 4 | ⋯ | 1300.160 | 7689.26 | ⋯ | ⋯ | Nb or Ar | ⋯ | ⋯ | ⋯ | ⋯ | ⋯ |
| 180 | ⋯ | 6 | ⋯ | 1300.236 | 7688.81 | ⋯ | ⋯ | Nb or Ar | ⋯ | ⋯ | ⋯ | ⋯ | ⋯ |
| 85 | ⋯ | 4 | ⋯ | 1300.288 | 7688.50 | ⋯ | ⋯ | Nb or Ar | ⋯ | ⋯ | ⋯ | ⋯ | ⋯ |
| 140 | ⋯ | 6 | ⋯ | 1300.314 | 7688.35 | ⋯ | ⋯ | Nb or Ar | ⋯ | ⋯ | ⋯ | ⋯ | ⋯ |
| 135 | ⋯ | 4 | ⋯ | 1308.181 | 7642.11 | ⋯ | ⋯ | Nb or Ar | ⋯ | ⋯ | ⋯ | ⋯ | ⋯ |
| 133 | ⋯ | 5 | ⋯ | 1339.824 | 7461.63 | ⋯ | ⋯ | Nb or Ar | ⋯ | ⋯ | ⋯ | ⋯ | ⋯ |
| 142 | ⋯ | 5 | ⋯ | 1341.798 | 7450.65 | ⋯ | ⋯ | Nb or Ar | ⋯ | ⋯ | ⋯ | ⋯ | ⋯ |
| 128 | ⋯ | 3 | ⋯ | 1342.679 | 7445.76 | ⋯ | ⋯ | Nb or Ar | ⋯ | ⋯ | ⋯ | ⋯ | ⋯ |
| 264 | ⋯ | 5 | ⋯ | 1342.883 | 7444.63 | ⋯ | ⋯ | Nb | ⋯ | ⋯ | ⋯ | ⋯ | ⋯ |
| 78 | ⋯ | 4 | ⋯ | 1344.956 | 7433.16 | ⋯ | ⋯ | Nb or Ar | ⋯ | ⋯ | ⋯ | ⋯ | ⋯ |
| 73 | ⋯ | 3 | ⋯ | 1345.924 | 7427.81 | ⋯ | ⋯ | Nb or Ar | ⋯ | ⋯ | ⋯ | ⋯ | ⋯ |
| 98 | ⋯ | 7 | ⋯ | 1345.999 | 7427.40 | ⋯ | ⋯ | Nb or Ar | ⋯ | ⋯ | ⋯ | ⋯ | ⋯ |
| 90 | ⋯ | 5 | ⋯ | 1346.082 | 7426.93 | ⋯ | ⋯ | Nb or Ar | ⋯ | ⋯ | ⋯ | ⋯ | ⋯ |
| 90 | ⋯ | 4 | ⋯ | 1348.233 | 7415.09 | ⋯ | ⋯ | Nb or Ar | ⋯ | ⋯ | ⋯ | ⋯ | ⋯ |
| 90 | ⋯ | 6 | ⋯ | 1349.381 | 7408.78 | ⋯ | ⋯ | Nb or Ar | ⋯ | ⋯ | ⋯ | ⋯ | ⋯ |
| 97 | ⋯ | 5 | ⋯ | 1351.638 | 7396.41 | ⋯ | ⋯ | Nb or Ar | ⋯ | ⋯ | ⋯ | ⋯ | ⋯ |
| 152 | ⋯ | 5 | ⋯ | 1352.808 | 7390.01 | ⋯ | ⋯ | Nb | ⋯ | ⋯ | ⋯ | ⋯ | ⋯ |
| 158 | ⋯ | 3 | ⋯ | 1355.170 | 7377.13 | ⋯ | ⋯ | Nb or Ar | ⋯ | ⋯ | ⋯ | ⋯ | ⋯ |
| 97 | ⋯ | 4 | ⋯ | 1356.345 | 7370.74 | ⋯ | ⋯ | Nb or Ar | ⋯ | ⋯ | ⋯ | ⋯ | ⋯ |
| 84 | ⋯ | 4 | ⋯ | 1377.566 | 7257.20 | ⋯ | ⋯ | Nb or Ar | ⋯ | ⋯ | ⋯ | ⋯ | ⋯ |
| 148 | ⋯ | 5 | ⋯ | 1380.984 | 7239.23 | ⋯ | ⋯ | Nb or Ar | ⋯ | ⋯ | ⋯ | ⋯ | ⋯ |
| 125 | ⋯ | 7 | ⋯ | 1382.079 | 7233.50 | ⋯ | ⋯ | Nb or Ar | ⋯ | ⋯ | ⋯ | ⋯ | ⋯ |
| 101 | ⋯ | 9 | ⋯ | 1385.856 | 7213.79 | ⋯ | ⋯ | Nb or Ar | ⋯ | ⋯ | ⋯ | ⋯ | ⋯ |
| 93 | ⋯ | 9 | ⋯ | 1386.909 | 7208.31 | ⋯ | ⋯ | Nb or Ar | ⋯ | ⋯ | ⋯ | ⋯ | ⋯ |
| 89 | ⋯ | 10 | ⋯ | 1392.016 | 7181.86 | ⋯ | ⋯ | Nb or Ar | ⋯ | ⋯ | ⋯ | ⋯ | ⋯ |
| 110 | ⋯ | 7 | ⋯ | 1396.556 | 7158.51 | ⋯ | ⋯ | Nb or Ar | ⋯ | ⋯ | ⋯ | ⋯ | ⋯ |
| 153 | ⋯ | 3 | ⋯ | 1397.328 | 7154.56 | ⋯ | ⋯ | Nb or Ar | ⋯ | ⋯ | ⋯ | ⋯ | ⋯ |
| 89 | ⋯ | 10 | ⋯ | 1397.393 | 7154.23 | ⋯ | ⋯ | Nb or Ar | ⋯ | ⋯ | ⋯ | ⋯ | ⋯ |
| 506 | 470 | 8 | ⋯ | 1398.0435 | 7150.898 | 0.082 | ⋯ | Nb i | 23,010.58 | 9/2 | 30,161.56 | 7/2 | 1 |
| 102 | ⋯ | 9 | ⋯ | 1403.046 | 7125.40 | ⋯ | ⋯ | Nb or Ar | ⋯ | ⋯ | ⋯ | ⋯ | ⋯ |
| 142 | ⋯ | 4 | ⋯ | 1408.100 | 7099.83 | ⋯ | ⋯ | Nb or Ar | ⋯ | ⋯ | ⋯ | ⋯ | ⋯ |
| 77 | ⋯ | 4 | ⋯ | 1408.404 | 7098.30 | ⋯ | ⋯ | Nb or Ar | ⋯ | ⋯ | ⋯ | ⋯ | ⋯ |
| 110 | ⋯ | 10 | ⋯ | 1408.980 | 7095.40 | ⋯ | ⋯ | Nb or Ar | ⋯ | ⋯ ⋯ | ⋯ | ⋯ | ⋯ |
| 952 | 781 | 5 | ⋯ | 1414.3063 | 7068.671 | 0.069 | ⋯ | Nb i | 23,048.58 | 11/2 | 30,117.32 | 9/2 | 2 |
| 150 | ⋯ | 4 | ⋯ | 1414.816 | 7066.12 | ⋯ | ⋯ | Nb or Ar | ⋯ | ⋯ | ⋯ | ⋯ | ⋯ |
| 223 | ⋯ | 3 | ⋯ | 1415.079 | 7064.81 | ⋯ | ⋯ | Nb or Ar | ⋯ | ⋯ | ⋯ | ⋯ | ⋯ |
| 147 | ⋯ | 9 | ⋯ | 1415.934 | 7060.55 | ⋯ | ⋯ | Nb or Ar | ⋯ | ⋯ | ⋯ | ⋯ | ⋯ |
| 215 | 127 | 11 | ⋯ | 1417.9508 | 7050.503 | 0.047 | ⋯ | Nb i | 22,936.9 | 7/2 | 29,987.45 | 5/2 | 1 |
| 203 | −164 | 4 | ⋯ | 1419.3413 | 7043.596 | −0.066 | ⋯ | Nb i | 11,524.65 | 13/2 | 18,568.18 | 11/2 | 1 |
| 105 | ⋯ | 7 | ⋯ | 1421.674 | 7032.04 | ⋯ | ⋯ | Nb or Ar | ⋯ | ⋯ | ⋯ | ⋯ | ⋯ |
| 76 | ⋯ | 3 | ⋯ | 1422.743 | 7026.76 | ⋯ | ⋯ | Nb or Ar | ⋯ | ⋯ | ⋯ | ⋯ | ⋯ |
| 117 | ⋯ | 4 | ⋯ | 1428.292 | 6999.45 | ⋯ | ⋯ | Nb or Ar | ⋯ | ⋯ | ⋯ | ⋯ | ⋯ |
| 95 | ⋯ | 2 | ⋯ | 1436.264 | 6960.60 | ⋯ | ⋯ | Nb or Ar | ⋯ | ⋯ | ⋯ | ⋯ | ⋯ |
| 649 | ⋯ | 7 | ⋯ | 1444.212 | 6922.30 | ⋯ | ⋯ | Nb | ⋯ | ⋯ | ⋯ | ⋯ | ⋯ |
| 77 | ⋯ | 3 | ⋯ | 1446.363 | 6912.00 | ⋯ | ⋯ | Nb or Ar | ⋯ | ⋯ | ⋯ | ⋯ | ⋯ |
| 140 | ⋯ | 4 | ⋯ | 1451.342 | 6888.29 | ⋯ | ⋯ | Nb or Ar | ⋯ | ⋯ | ⋯ | ⋯ | ⋯ |
| 96 | ⋯ | 4 | ⋯ | 1455.197 | 6870.04 | ⋯ | ⋯ | Nb or Ar | ⋯ | ⋯ | ⋯ | ⋯ | ⋯ |
| 98 | ⋯ | 4 | ⋯ | 1456.705 | 6862.93 | ⋯ | ⋯ | Nb or Ar | ⋯ | ⋯ | ⋯ | ⋯ | ⋯ |
| 94 | ⋯ | 5 | ⋯ | 1459.166 | 6851.36 | ⋯ | ⋯ | Nb or Ar | ⋯ | ⋯ | ⋯ | ⋯ | ⋯ |
| 64 | ⋯ | 3 | ⋯ | 1460.924 | 6843.11 | ⋯ | ⋯ | Nb or Ar | ⋯ | ⋯ | ⋯ | ⋯ | ⋯ |
| 100 | ⋯ | 3 | ⋯ | 1461.839 | 6838.83 | ⋯ | ⋯ | Nb or Ar | ⋯ | ⋯ | ⋯ | ⋯ | ⋯ |
| 111 | ⋯ | 3 | ⋯ | 1467.096 | 6814.33 | ⋯ | ⋯ | Nb or Ar | ⋯ | ⋯ | ⋯ | ⋯ | ⋯ |
| 79 | ⋯ | 3 | ⋯ | 1467.426 | 6812.79 | ⋯ | ⋯ | Nb or Ar | ⋯ | ⋯ | ⋯ | ⋯ | ⋯ |
| 130 | ⋯ | 2 | ⋯ | 1475.481 | 6775.60 | ⋯ | ⋯ | Nb or Ar | ⋯ | ⋯ | ⋯ | ⋯ | ⋯ |
| 84 | ⋯ | 3 | ⋯ | 1476.020 | 6773.12 | ⋯ | ⋯ | Nb or Ar | ⋯ | ⋯ | ⋯ | ⋯ | ⋯ |
| 157 | ⋯ | 3 | ⋯ | 1477.675 | 6765.54 | ⋯ | ⋯ | Nb or Ar | ⋯ | ⋯ | ⋯ | ⋯ | ⋯ |
| 662 | −366 | 3 | ⋯ | 1480.1050 | 6754.431 | 0.039 | b | Nb i | 13,629.15 | 1/2 | 20,383.62 | 3/2 | 1 |
| 76 | ⋯ | 3 | ⋯ | 1491.915 | 6700.96 | ⋯ | ⋯ | Nb or Ar | ⋯ | ⋯ | ⋯ | ⋯ | ⋯ |
| 82 | −34 | 8 | ⋯ | 1494.4973 | 6689.385 | −0.005 | ⋯ | Nb i | 11,247.88 | 11/2 | 17,937.26 | 9/2 | 1 |
| 93 | ⋯ | 5 | ⋯ | 1496.735 | 6679.39 | ⋯ | ⋯ | Nb or Ar | ⋯ | ⋯ | ⋯ | ⋯ | ⋯ |
| 113 | ⋯ | 4 | ⋯ | 1499.132 | 6668.70 | ⋯ | ⋯ | Nb or Ar | ⋯ | ⋯ | ⋯ | ⋯ | ⋯ |
| 413 | −222 | 7 | ⋯ | 1508.6554 | 6626.608 | 0.072 | ⋯ | Nb i | 14,211.3 | 3/2 | 20,837.98 | 5/2 | 2 |
| 273 | 23 | 12 | ⋯ | 1511.7767 | 6612.926 | −0.006 | ⋯ | Nb i | 14,899.26 | 5/2 | 21,512.18 | 7/2 | 1 |
| 218 | ⋯ | 4 | ⋯ | 1512.411 | 6610.15 | ⋯ | ⋯ | Nb or Ar | ⋯ | ⋯ | ⋯ | ⋯ | ⋯ |
| 162 | ⋯ | 4 | ⋯ | 1539.002 | 6495.94 | ⋯ | ⋯ | Nb or Ar | ⋯ | ⋯ | ⋯ | ⋯ | ⋯ |
| 102 | ⋯ | 9 | ⋯ | 1552.651 | 6438.84 | ⋯ | ⋯ | Nb or Ar | ⋯ | ⋯ | ⋯ | ⋯ | ⋯ |
| 313 | 177 | 3 | ⋯ | 1571.5895 | 6361.246 | −0.006 | b | Nb i | 11,044.08 | 9/2 | 17,405.32 | 7/2 | 2 |
| 489 | −128 | 8 | ⋯ | 1604.7442 | 6229.821 | 0.009 | ⋯ | Nb i | 15,282.35 | 7/2 | 21,512.18 | 7/2 | 1 |
Note. W: line pattern widths in mK (1 mK = 0.001 cm−1);  the total separation of the strong hyperfine components in mK (1 mK = 0.001 cm−1); S/N: signal-to-noise ratio from the FT spectrum; int: intensity from [1];
  center of gravity wavelength in air from the FT spectrum;
  center of gravity transition wavenumber in vacuum from the FT spectrum;
  difference between the wavenumber in vacuum and the energy difference of the levels; a: for this line an Ar classification was found, but it is not visible in the spectrum of La–Ar plasma (2); b: blend with other line (Ar or Nb); nc: new classification for lines, already listed in (1);
 energy level and total electronic angular momentum of the level of even parity;
 energy level and total electronic angular momentum of the level of odd parity; npt: number of possible transitions lying in the wavenumber interval of the overall line profile width.
References. (1) Humphreys & Meggers (1945) (2) Güzelçimen et al. (2013).
From the more than 800 lines in the FT spectrum, 90 have been unambiguously classified as transitions of atomic Nb levels. In all cases, the lower level is the level of even parity. From these 90 lines, 27 are new lines, which means that they have not been published before. An additional 8 of the 90 classified Nb i lines were listed by Humphreys & Meggers (1945), but without classification. In all 8 cases, the recently published levels from Kröger et al. (2007) are involved. For the remaining 55 of 90 lines, the classifications given by Humphreys & Meggers (1945) could be confirmed.
Due to their structure, another 20 lines could be unambiguously associated with the element Nb, even though no classification could be found. This means that the unknown Nb levels are involved in these transitions. Most likely, these lines are atomic lines, not ionic, because no line could be assigned to an Nb ii transition in our IR spectrum, and also because only very weak lines of very strong ionic transitions were detected in our previous investigations of the Nb spectrum in the visible spectral range, which was recorded at very similar discharge conditions (see Kröger et al. 2010).
If we exclude all of the lines that are unambiguously identified as Ar lines, then 94 narrow lines with only one symmetrical peak remain for which no classification was found (neither Ar nor Nb) and which do not appear in the comparative FT spectrum of La–Ar plasma from Güzelçimen et al. (2013). These lines may be either Ar lines or Nb lines with narrow splitting, and are presented in Table 1. In addition, for seven narrow lines, an Ar classification is suggested, but these lines are not visible in the comparative FT spectrum of La–Ar plasma, even though all of the classified Ar lines appear to have better S/N in the La–Ar plasma. These 7 lines are also listed as "Ar or Nb" lines in Table 1 but are marked by respective comments.
In Table 1, the wavelengths in air  and the vacuum wavenumbers
  are listed. The wavelengths in air are calculated from the measured wavenumbers in vacuum using the dispersion relation (Peck & Reader 1972). Additionally, the line pattern widths, W, the S/N values, and the assignments are given. If a line has been published previously, then the intensity from the literature (Humphreys & Meggers 1945) is listed in the fourth column. All of the lines without a mentioned intensity from the literature are new lines. If only the classification is new, then the lines are denoted as "nc" (new classification). If a line overlaps within its line pattern width with another line, it is denoted as "b" (blended).
If a line is classified, then the upper and lower levels are listed. Moreover, the total separation  between the hyperfine components with
  which is calculated by the classification program from hyperfine constants and J quantum numbers, is given in the second column. If the highest hyperfine component lies at smaller frequencies, then
  is defined as negative.
If for a particular transition the classification program offers several possible predicted line identifications, then we chose—as mentioned above—the one for which the fingerprint of the hyperfine structure matches. Nevertheless, other predictions could appear as well, but with lower intensity, which means that they could be blended by the stronger line. In an astrophysical spectrum, the temperatures and conditions differ considerably from a hollow cathode plasma. Therefore, situations may arise in which the weaker line contributes more strongly to the spectral pattern. Accordingly, the number of possible transitions ("npt") that lie within an interval of ±0.1 cm−1 around the classified line is given in the last column of Table 1.
In the seventh column of Table 1, the difference  between the experimental wavenumber
  and the calculated energy difference of levels is given for all of the classified lines:

where  and
and  are the energy levels of even and odd parity, respectively. When looking at these data, the relatively large values of
  can be noticed. As written in Section 2, a conservative estimate of the absolute accuracy of the center of gravity is about 0.007 cm−1. If we assume an uncertainty of about 0.01 cm−1 for most of the level energies, then the values of
  should mostly range below 0.03 cm−1 and, in particular, should be statistically distributed. However, the former requirement is true only for half of the lines and the mean value of
  is not zero, as it should be for a statistical distribution, but reaches a value of more than 0.02 cm−1. A misalignment of the wavenumber axis cannot be the reason for this discrepancy because the calibration was verified using classified Ar as described in Section 2. Therefore, the disagreement can only be caused by the level energies of Nb. Indeed, if the lines are sorted by upper or lower levels, respectively, for some levels a systematic deviation is found. Two extreme examples are given by the two levels 9497.52 cm−1,
  and 23,022.56 cm−1,
  For the former, five lines are classified in the spectrum and the mean value of the difference
  for these five lines is 0.061 cm−1. For the latter, four lines are classified in the spectrum and the mean value of the difference
  for these four lines is 0.075 cm−1. For many other levels, the mean value of the difference
  is smaller but still significant. This fact highlights the need for a revison of the level energies of Nb. The effective deviation of the level energy will be lower than the value of
  shown in the two examples because
  is caused by deviations from upper and lower levels. An easy correction is not possible because the complete system of levels of atomic Nb should be processed commonly. A revision of the fine structure level data is envisaged by taking into account spectral data from IR, VIS, and UV. However, for the list of wavelength and wavenumbers, respectively, which is the focus of the present work, the inaccuracy of the level energies does not matter because the center of gravity of the lines is determined experimentally and is not influenced by deviations of the level energies.
5. CONCLUSIONS
The IR spectrum of Nb–Ar plasma was investigated. The aim of this work is to provide a list of Nb lines in the IR for astrophysical use. The Nb spectrum in the range from 1092 nm to 1660 nm (6022 cm−1 to 9155 cm−1) is reported for the first time.
By using the hyperfine structure as a fingerprint we were able to classify 90 atomic Nb i lines. We fitted the hyperfine patterns with the line profiles in order to determine the center of gravity positions with better than 0.01 cm−1 accuracy. With this accuracy we have detected a discrepancy which is, most probably, caused by the uncertainty of the Nb level energies. These discrepancies do not reduce the quality of the presented spectral data, which are the main focus of this paper, but instead point out the need for revision of the Nb fine structure energies.
Additionally, more than 800 Ar lines could be identified, most of them with classification. The list of Ar lines (not presented here) shows good agreement with the list published in Güzelçimen et al. (2013) for La–Ar plasma.
This work has been supported by the Istanbul University Scientific Research Projects with project No. BYP-24524 and IRP-38320. The Riga team acknowledges support from the Latvian Science Council grant No. 119/2012. The authors are indebted to Florian Gahbauer for useful comments.
Footnotes
- 4
The name originally given to this element and still in use at this time in USA was columbium (Cb). Only in 1950 was the name niobium (Nb) internationally officially committed.