


Abstract
The phase diagram and the possible stable structures of molecular solid hydrogen are intriguing physical phenomena that still remain to be fully unveiled. Particularly, its transition to metallic hydrogen at high pressures is currently a hot topic of discussion. This letter reports a simulation method that links the ab initio, quantum molecular dynamic and mechanical properties calculations to study the relation between the structural phase transitions and sound velocity in solid molecular hydrogen. The pressure range studied is from 0.1 GPa to 180 GPa, at 15 K temperature, thereby our aim is to simulate the conditions of manufacture, handling and early stages of compression of the target fuel used in confinement inertial fusion. Phase I degeneration below 1 GPa is discussed.
Export citation and abstract BibTeX RIS
Introduction
Understanding hydrogen at extreme conditions is a fairly complex theoretical problem. Being the lightest element and composed of a single electron, hydrogen becomes hard to model because of its nuclei movement, which affects the structural stability and vibrational properties even at zero temperature [1]. Since 1935 various structural configurations for hydrogen at high pressures have been proposed [2]. However, only recently experiments are beginning to throw light on the complexity of the phase diagram and structural transformations of this element at high pressure and very low temperatures.
A full comprehension of the H behaviour is still far from being achieved, since the few existing experimental data are totally controversial. The structural configuration and, in particular, the orientation of the molecules making up the solid molecular hydrogen have been discussed by different authors [3–5]. This situation is raising a hot debate in the community and puts on the desk different interpretations [4,6,7].
In 2011 Troyan and Eremets [4] reported H metallization below 300 GPa, using the diamond anvil cell (DAC) technique; nevertheless recent experiments have shown that the conductivity of these pressures may exist, but no H metallization occurs [8]. The first-principles models also show that the solid H is a conductor at pressures lower than 300 GPa, proposing a hexagonal structure of H atoms, similar to the arrangement of carbon graphene layers [6]. Other different structures have been proposed for such a solid [6,9], associating theoretical calculations to experimental results from Raman spectroscopy [6]. While in the range from 150 to 220 GPa, the H phase diagram has not been completely defined yet [8], and for pressures higher than 350 GPa the DAC technique is limited to the pressure which can withstand diamond faces [4]. Such experimental difficulties justify the need to incorporate a new methodology to get insight into the hydrogen behavior at temperatures and pressure ranges that the experiments are not able to resolve. In this regard, simulation techniques, in particular first principles based on molecular dynamics, are here proposed as an effective predictive tool complementary to experiments.
Physics underlying the behavior of molecular solid hydrogen is both of technological and scientific relevance. Astrophysical models for the interior of gas giant planets, like Jupiter and Saturn, benefit from the accurate description of dense hydrogen properties [10,11]. Technologically, cold dense solid hydrogen has been proposed both as a fuel [12,13] or a shielding material in human space vehicles [13]. Aside of all these applications, hydrogen and its isotopes are of critical importance for the future production of energy by means of inertial confinement nuclear fusion (ICF) development [14].
In ICF a spherical target containing a mixture of deuterium-tritium ice (DT-ice) is heated and compressed with the exact efficiency and intensity needed to reach fusion conditions. Compression must be as uniform as possible, since abnormal non-isotropic propagation of the compressing shockwave generated to compress the fuel, may lead to hydrodynamic instabilities that lower the ignition efficiency [15]. Efficient fusion is only achieved if the DT-ice fuel target satisfies the specific quality criteria [16]. Further studies are therefore needed to unveil the properties of solid hydrogen in such conditions, as well as its phase transitions under shock pressure compression, in order to improve target fabrication processes, and at the same time to optimize the gain of future fusion reactors based on the ICF technology [17]. Kozioziemski et al. have explored different problems that occur near the triple point with the solid layer of H isotopes [18]. For the DT fuel target concept, designed and tested in the National Ignition Facility (NIF), irregularities observed in the compression of the DT-target might be related to the mixture of phases near the melting point of H, and are believed to affect the ignition efficiency. This letter reports an original approach capable of predicting properties of solid hydrogen (i.e. sound velocity, bulk modulus) and correlates them with structural changes at molecular level. Moreover, our method can be directly applied to study hydrogen mixtures structural phases both in manufacturing conditions and the range of temperature and pressure experienced in the early stages of compression in ICF.
Methodology
The proposed method in itself constitutes a valuable approach capable of study efficiently the structural evolution of solid hydrogen in a wide range of temperature and pressure conditions, and which are obtained properties like the sound velocity in the solid  . In the first stage this procedure has been validated by direct comparison of previous results about the evolution of cS with respect to pressure changes up to 70 GPa at 165 K [10].
In addition we have characterized each of the structural changes observed at 15 K through three solid phases of molecular hydrogen, at pressures covering the range between 0.1 GPa (typical technical pressure for ICF targets) to 180 GPa. The relationship between changes in the sound velocity in different orientations of the crystal, showing the evolution of the static compression in the first stage of the DT-ice ICF systems compression, was analysed.
The methodology followed combined first principles, to find the specific initial configuration that minimizes energy, and quantum molecular dynamics (QMD) to model the thermodynamical processes, coupling the system to temperature and pressure ramps. Crystallographic and molecular calculations were carried out to sample the evolution of the crystal structure of the solid, and compute the speed of sound for any particular temperature and pressure.
Our approach to model hydrogen at high pressure and low temperature started from an ideal hexagonal closest packed order (HCP) perfect system [19], with oriented molecules in the Z-axis (axis "c" of the hexagonal structure, see fig. 1). Every H2 molecule occupied a HCP lattice point. Periodic boundary conditions were used. QMD exploration consisted of a combination of well-founded individual stages. The process was initiated by the search for the most stable structure [17], which implied finding a target configuration involving molecular orientations that described the proper initial simulation box (576 atoms or 288 hydrogen molecules). Such a configuration was the result of applying the method of conjugated gradient (CG) to relax a non-thermalized system into an ordered one; see stage A in fig. 1. The result of this analysis method is shown in a previous work [17]. After obtaining this minimum energy configuration, molecules were thermalized by means of the implementation of a Nose-Hoover thermostat, using QMD. For any thermalized box we found the proper settings for a starting pressure by coupling both the dynamics of a Parrinello-Rahman barostat to a Nose-Hoover thermostat, stage B fig. 1. Pressure was stabilized using a ramp strategy, in which each new pressure stabilization benefits from the previous one. We have started from pressure equal to 1 GPa, and increased the pressure by controlling stable steps up to 180 GPa. The increase in pressure ramps followed particular steps and parameters:  ;
;  ;
;  to
to  and
and  until 180 GPa. The stabilization time was selected 5 ps before 20 GPa and 1 ps after 20 GPa.
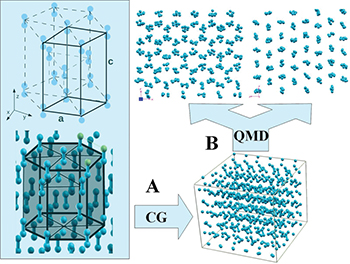
Fig. 1: (Colour on-line) Diagram depicting the simulations process followed. It is possible to obtain the initial configuration from an ideal one, by mean of conjugates gradient (CG) minimization (level A), at  . Then, this output is first placed in contact to a thermostat at 165 K or 15 K, in order to control and raise the initial pressure of 1 GP from an ideal state, this latter process (level B) is accomplished using QMD.
Download figure:
Standard imageDensity functional theory (DFT) and QMD simulations were carried out using the SIESTA code [20]. We used exchange-correlations functional local-density approximation (LDA) based on Ceperley-Alder (CA) functional with double-zeta basis plus polarization orbitals (DZP basis), with a MeshCutoff of 100 Ry. The size of the basis set, as well as MeshCutoff, were increased to explore and discard a possible dependence of our results on these parameters. In a benchmark test for different pressures sets below 180 GPa, we found absolutely no differences between using a generalized gradient approximation (GGA) functional with revised Perdew-Burker-Ernzerhof (revPBE), and LDA calculations (comparison not shown). At this first stage of the process does not take into account the zero-point vibration (ZPV) correction, but for the calculation of 15 K ZPV estimates the effect of taking the approach proposed by Blanco et al. [21].
Elastic constant
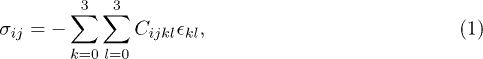
Sound velocities for each of the structures and configurations explored and described in this letter were obtained using the Newton-Laplace equation  , that relates the speed of sound to the bulk modulus
  with respect to the density
  . The results for cS 165 K are shown in fig. 2. In the unidirectional case the velocity was calculated by the Young modulus in each direction. For each stable state found, deformation runs at a rate of 1% on each of the different axes of the box were applied (see fig. 2). Stress tensor variations, together with deformation, define the elastic constants or stiffness tensor elements according to the definition of Hooke's law for a transverse isotropic material, where for the X, Y axes are symmetric. To do this we need to calculate C11, C12, C13, C33 and C44 [22], with
where ε is the strain 1% and  with
with  : stress after deformation, relax position (CG) and
  : stress without deformation, relax position (CG). The Voigt average [22] was applied to compute the bulk modulus for hexagonal crystal:

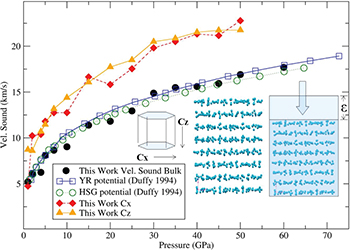
Fig. 2: (Colour on-line) Predictions for the speed of sound in hydrogen at 165 K in a range of pressures up to 70 GPa. The plot shows results from different authors [10] that validate, by direct comparison, the predictive methodology based on DFT and QMD simulations described in this work (black filled circles). Curves describing the prediction for the uniaxial sound velocity in the X and Z axes  are presented (filled diamonds and triangles symbols). Inset: elastic constants obtained through the deformation of structural configurations for a certain T and P. CG was applied to obtain the initial stress, and then deform in 1% stress for the structure. The difference between the starting and ending stress is the stress used in the calculation of the elastic constants.
Download figure:
Standard imageResults and discussion
Comparison with other models
165 K was taken as a particular temperature to compare with respect to the work of Duffy et al. [10], who simulated the variation of sound velocity on the surface of Jupiter (solid molecular hydrogen); in a range from 1 to 300 GPa, Duffy et al. used a model based on the potentials of Hemley-Silvera-Goldman (HSG) and Young-Ross (YR). Their results are shown in fig. 2 as empty circles and squares, respectively.
Our calculations (black filled circles in fig. 2) predicted a non-linear sound velocity variation with pressure in the range from 1 to 60 GPa, and matched the prediction of Duffy et al. [10]. Moreover, the difference between the results is less than 5%, and compatible with both potentials used in their work (see graph, fig. 2).
Note that one of the advantages of our methodology relies on its capability to provide information about the structural changes of the solid and how they correlate with variations in the predicted curve for sound velocity, since each crystal structure resulted from an evolutionary sequential compression of the material, through ramps in T and P. Univocally the uniaxial sound velocity provides relevant information about the structural changes on each of the molecular axes, a consequence of the solid evolution through phase transitions. In this case, the magnitude of the uniaxial sound velocity in the X and Z axes was calculated directly from the elastic constants, (depicted in fig. 2 as  (filled diamonds) and
  (filled triangles)), and velocity direction with respect to the hexagon crystal.
Near triple point
Uniaxial sound velocities are presented in fig. 3 (X and Z axes) for solid hydrogen at 15 K in function of a wide range of pressures, from 0.1 GPa to 180 GPa. Of interest is to remark the possibility to observe and associate phase transitions, I-II-III, previously predicted by other authors [23,24] for this temperature, without reaching extreme pressures  .
.
Fig. 3: (Colour on-line) Estimation of the uniaxial sound velocity in the X and Z directions  for solid hydrogen at fixed temperature of 15 K. Results are derived from the QMD methodology described in this work. The study is extended to show variations as a function of pressure in a range from 0.1 GPa to 180 GPa at constant temperature. The inset shows a zoom in the range of low pressures from 0.1 GPa to 1 GPa of interest in ICF [25], and later discussed in fig. 5. The vertical dashed lines show the locations of the transition phase from phase I to II and phase II to III for parahydrogen [24]; here
  and
and  show discontinuities but
  and
and  do not.
Download figure:
Standard imageThere is a non-linear growth for the system energy evolution coupled to logarithm changes in the sound velocity as pressure is increased in the region from 0.1 to 25 GPa. Within phase I, our observations at different pressures revealed that molecular-solid-hydrogen samples explored structural rearrangements in the axes of its HCP structure. A strong evolution is observed particularly in the range up to 1 GPa as reflected by sound velocities (inset of fig. 3) and changes in the slopes of the curves depicted by both energy and uniaxial sound velocities. Another way to relate the phase changes associated with the structure of the system is the enthalpy  , calculated as
  , where
  is the total energy, P the pressure and V the volume. In fig. 3
  and
and  show discontinuities in the phase transition pressure, while
  and
and  do not.
Interestingly this range of pressures, in which fast changes are observed, covers the full range of targets design and operation for ICF [16,25]. Solid-hydrogen features at this range raise a lot of questions not only on the optimization of the manufacturing process of ICF targets [18], but also on the pressure propagation effectiveness at their implosion [25].
A complement of value to discuss the data shown in fig. 3 is to get an insight into the full correlation between structural changes in the solid, phase transitions and the prediction of variations in the sound velocity, as is depicted in fig. 4. Snapshots of the solid structure (projections XY, ZY, XZ) are represented for particular values of pressures of remarkable interest. Three well-defined regions are shown in the graphic composition, corresponding to the three phases predicted for solid hydrogen. Phase transitions were found by our methodology at the precise exact conditions in agreement with previous works [23,24]. In this respect we reproduced the conditions in which the experiments are performed by modelling a quasi-static compression in which pressure is rhythmically increased by small steps up to the given range, thereby simulating longer times (greater than 1 ps).

Fig. 4: (Colour on-line) Structural changes anticipated for molecular solid-hydrogen under pressure evolution at 15 K and correlated with the uniaxial X variation of the sound velocity in the solid. A non-linear variation of the sound velocity is observed. It is related to the structural changes shown in the projections of the simulation box. In phase I the slopes (continuous line, dashed line and dotted line) are associated with changes in the orientations of the hydrogen molecules observed in the different projections of the XY plane, ZY and XZ. The graph was divided to represent the phase transition between phase I and phase II and between phase II and phase III. The entire evolution from 0.1 to 180 GPa is shown. The snapshots for projections ZY, XZ at the bottom, describe clearly the structural transition observed between phases I and II (35 and 80 GPa), and between phases II and III (120 and 180 GPa), which can be described as changes in the orientation of the molecules in the solid. The morphological analysis of structures was carried out using XCrysden Display [26].
Download figure:
Standard imageThe non-linear growth of the sound velocity observed within phase I is a clear consequence of a small molecular evolution and restructuration. Three clear changes in slope defined the peculiar evolution of the value of the speed of sound in solid hydrogen at 15 K in a region that ranges from 1 GPa to 70 GPa. Each slope relates to a distinct orientation distribution of the projection planes ZY and XZ.
On the other hand, symmetry was broken only after passing 60 GPa. The rupture of symmetry found matched the transition from phase I to phase II according to both current predictions in the literature [17,23] and the phase diagram for parahydrogen [24]. In accordance, a new much more oriented state was found and described at 80 GPa (see structural snapshots in fig. 4), in which molecules passed from a symmetric rotation to a restricted rotation, totally breaking the symmetry in the orientation of molecules, (see XZ and ZY planes in fig. 4). This step, known as the break phase of symmetry, matches the description of Toledano et al. [23]. Consequently a different evolution of the sound velocity in the solid was found and correlated with such a state.
In addition to the transition between phases I and II, fig. 4 shows the change in phase from II to III, which is taken as a modification in the orientation of the molecules above 150 GPa in agreement with what was anticipated by Pickard et al. [1]. The transition between phase II and phase III was observed around 150 GPa, where a break in the continuity of the curve occurred, this point coincides with the conclusions reported by Mazin et al. and Toledano et al. [23,24]. Moreover, for the high-pressure range, the structural evolution in fig. 4 is similar to that presented by Azadi et al. [27] for LDA calculations, proving the existence of a transition from a solid molecular system (100 GPa) to a partially dissociated one over 160 GPa in phase III.
While at 1 GPa molecules displayed no apparent orientation, and were free to rotate, at 35 GPa a precise molecular order involved a restriction in the range of rotation. Note that an additional intermediate stable state was found at 15 GPa, still showing rotation and partial orientation of the molecules. In phase I, the symmetry was not broken and the molecule was able to describe the entire sphere in its rotation. In the early stages of solid molecular hydrogen, molecules do not rotate with its axis in the centre of the HCP configuration, but vibrate and rotate around this centre. Therefore, discontinuities between 0.1 and 5 GPa in sound velocity occur, according to our results, as a result of this configurational change, that can also be associated with Raman discontinuities pressures below 10 GPa, in agreement with Mazin et al. [24]. In phase I the hydrogen molecules rotate freely making the center H2 molecule coincide with the HCP lattice position [23]; below 15 GPa we observed that this coincidence disappears gradually, so that at 0.1 GPa the center H2 molecule and HCP lattice position do not coincide, producing what we call phase I degeneration.
In fig. 5 the molecule movement is shown (288 molecules have the same behavior) for the pressure range from 0.1 GPa to 1 GPa. We build a histogram of the position of the H2 molecule center, normalized to the simulation box (fig. 5(a)). The histogram is narrow and tall, to 1 GPa, compared with 0.1 GPa which is wide and flattened. For the molecule trajectory projection in the XY plane the area increases with decreasing pressure (fig. 5(b)). This we represent as an ellipse or circle that scans the H2 molecule, the radius of the virtual circle increases with decreasing pressure, giving rise to phase I degeneration.
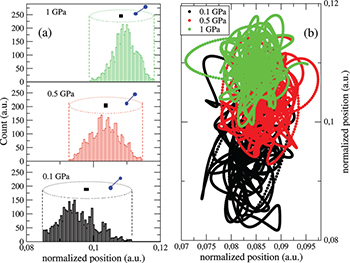
Fig. 5: (Colour on-line) Phase 0 representation. (a) Histogram of the position of H2 molecule. The width of the histogram represents the magnitude of H2 path, and is depicted on the histogram as a circle (ellipse) that reduces its radius as pressure is raised. (b) Projection of the molecule in XY plane. It can be observed that the area swept by the molecule is increased as pressure gets lower. The 288 molecules of the simulated case suffer the same behavior.
Download figure:
Standard imageThe continuity of this work is addressed to study pressures below 0.1 GPa, and relate the phase I degeneration with the metastable polymorph of solid H2, D2 and DT observed in the DT-ice target used in ICF [18] and the mixture of HCP-FCC structural phases observed in the crystallization experiment deeply cooled in liquid parahydrogen [3].
Finally, let us mention that one of the limitations of the DFT simulations is the loss of the contribution of the zero-point vibration. To approximate the effect of this on the calculations, we use the one proposed by Blanco et al. [21] the correction  . The last term represents the correction ZPV for the Gibbs free energy
  , which depends on the temperature; this term from the known ZPV magnitude of the correction in the Gibbs energy is given by [21]

where n is the number of atoms, K is Boltzmann's constant, T the temperature,  the Debye temperature and D(y) is the integral of Debye. Solving for
  we obtain the expression used by Freiman et al. [28], related to the equation of state:

Hence the pressure is corrected  , we have
  , where h is Planck's constant, V the volume,
  the sound velocity, in our case the unidirectional velocity. Via the relation of the equation of state:
  , and with
  , the sound speed with the ZPV correction:
Calculating the Debye temperature we obtain the value of  and
and  . The average correction for both unidirectional velocities is lower than 0.3 km/s, i.e. it does not represent the 5% error with respect to the HSG and RY models. The ZPV effect increases to reduce pressure but the sound velocity difference is still lower than 5% with
  . The state equation is obtained as
Conclusion
We have validated a unique methodology able to predict properties of solid hydrogen (i.e. sound velocity, bulk modulus [29]) and correlate them with structural changes at molecular level. The results presented in this work match predictions about the behaviour and properties of solid hydrogen at 165 K, in agreement with previous findings [10]. Moreover, we have shown the structural evolution of solid hydrogen at 15 K as a function of a wide range of pressures, finding agreement with phase I, II, III described by other authors [1,23,24] and correlating molecular changes with the sound velocity variation in the solid molecular hydrogen.
This work shows the evolution of H compression, addressing the possible changes that the DT-ice suffers when achieving high pressures in ICF systems, particularly at the early stages of laser-induced compression. Discontinuities in the uniaxial curve of the sound velocity (not observed in total energy or enthalpy, fig. 3) may explain the onset of hydrodynamic instabilities observed in the compression process for ICF targets, a phenomenon that is still not fully understood and affects the ignition efficiency. In addition, this work may represent a valuable seed for a multiscale study of the physics of shock compression of DT-fuel at very low temperature.
For pressures below 15 GPa, a number of changes observed in the slope of the velocity curve relate well to changes in the entropy. We associate these changes with rearrangements in the configuration of the molecule about its axis of rotation and the HCP position.
The configuration reached at 0.1 GPa define a new phase (phase 0), originated from phase I degeneration; this point is open for further study.
Our results point to the presence of different phases and phase I degeneration, as a possible source of instabilities in the ICF system. Future work is expected to link directly these phenomena with the growth of instabilities reported in target compression process. Furthermore work is in progress to apply this methodology to explore greater pressures in the range from 150 GPa to 220 GPa, values which are of great interest in astrophysics, where the phase diagram is not well defined [8]. In turn, we have proposed the equation of state, taking into account the ZPV correction, eq. (6).
Acknowledgments
The author acknowledges the computer resources and technical assistance provided by the Centro de Supercomputación y Visualización de Madrid (CeSViMa). Authors thank the Spanish Ministry of Science and Innovation for economical support via the ACI-PROMOCIONA program 2009 (ACI2009-1040). We thank E. R. Koresheva, M. Tolley and G. Schurz for fruitful discussions about ICF targets.