


Abstract
We considered the transfer of multi-spot optical patterns through disordered two-dimensional waveguide arrays with shallow refractive index modulation. In computer simulations, it was uncovered that statistically averaged output intensity distributions of complex inputs retain their structural features for suitable disorder strengths due to the Anderson-like localization of light. To characterize the quality of the input-output pattern similarity, we introduced corresponding criteria and analyzed their variations with the disorder level.
Export citation and abstract BibTeX RIS
The possibility of transferring optical information through inhomogeneous disordered materials is relevant in many practical applications, in particular, that involve turbid media. Usually disorder, which unavoidably appears in many physical systems, serves as a deteriorating factor. Similarly, it is associated to beam spreading and optical pattern delocalization. However, in some cases disorder plays just the opposite role, as in the phenomenon termed Anderson localization. This general wave phenomenon, which in electronic systems manifests itself as a localization of electronic wave functions in the presence of a static disordered potential, was introduced in solid-state physics by Anderson more than fifty years ago [1,2]. It has now been experimentally observed in many areas of physics [3], including microwaves [4,5], acoustics [6,7], Bose-Einstein condensates [8,9], and optics [10–17]. A particularly fascinating manifestation of the effect is the so-called transverse Anderson localization [13], which occurs when a wave packet propagating through a disordered medium remains statistically localized in the transverse plane, even though it spreads along the propagation coordinate.
Optical systems provide excellent settings to visualize and explore Anderson-localization phenomena [14,15]. Current technologies allow fabrication of photonic lattices and waveguide arrays with periodic shallow transverse modulations of the refractive index, where controllable disorder, invariable in the direction of light propagation, can be readily introduced [16–20]. Transverse Anderson localization has been observed in optically induced [19] and in fabricated lattices [20–25], in both two- [19,23,24] and one-dimensional [20–22,25] geometries. The impact of the inhomogeneity of disorder [26], refractive index gradients [25], nonlinearity [19,20,27,28], and interfaces [21,24,28,29] has been elucidated. Moreover, the possibility of Anderson localization in optical arrays under Bragg-guiding conditions [30] and in PT-symmetric structures [31] has been studied.
Usually Anderson localization in waveguide arrays is studied for the simplest single-site excitations, closely matching the fundamental bell-shaped eigenmode of an isolated waveguide. Rare exceptions include investigations of the effect of a transverse phase modulation on the evolution of broad one-dimensional inputs in disordered discrete lattices [32] and analysis of the phenomenon of Anderson localization of light with nested screw topological dislocations propagating in disordered two-dimensional arrays of hollow waveguides illuminated by vortex beams [33]. Recently it was demonstrated that contrary to the common belief in materials with deep refractive index modulation, such as disordered glass fibers [34,35], satisfactory image transfer is possible practically in each particular realization of disordered structure under suitable conditions. Notice that pattern transfer is also possible in regular lattices in the presence of nonlinearity, but one needs sufficiently high intensities and a suitable phase engineering [36].
Here we address the very different structure, namely the disordered array consisting of single-mode guides and consider excitations and transport of multi-spot patterns. The single-spot pattern experiences strong distortion and spreading in the course of propagation in regular arrays, due to standard discrete diffraction. Interference of the diffractive waves from different spots completely changes the initial intensity distribution after a few coupling lengths and, therefore, deteriorates the structure of the input pattern and eventually destroys the information encoded in it.
In this letter we show that in such photonic structures disorder can suppress the transverse ballistic transport of complex multichannel patterns and thus allows to conserve, rather than to destroy, the structures of collective excitations under the condition of Anderson localization. More specifically, we uncover that for sufficiently large disorder levels, the output intensity distributions, averaged over ensembles of array realizations, closely match the input intensity distributions even for complex multi-spot patterns, whereas in regular waveguide arrays one observes severe distortion of the corresponding outputs. We introduce suitable quantities to characterize the quality of the transmitted pattern and show that the quality of transmission grows with the disorder strength. Different types of input multi-spot patterns are considered including geometrical figures and letters.
We study the propagation of multi-spot coherent light patterns along the ξ-axis of a two-dimensional disordered waveguide array with shallow refractive index modulation  , where the evolution of the dimensionless light field amplitude q is described by the equation

Here the transverse coordinates  and propagation distance ξ are normalized to the characteristic transverse scale r0 and the diffraction length
  , respectively, where k is the wave number. The refractive index distribution
  in the array stands for a superposition of individual super-Gaussian channels
 ![$G(\eta,\zeta )=\exp [-(\eta^{2}+\zeta^{2})^{2}/w^{4}]$](https://content.cld.iop.org/journals/0295-5075/109/5/54001/revision1/epl16945ieqn4.gif) with width w and refractive index modulation depth pnm. All waveguides are placed in the nodes
with width w and refractive index modulation depth pnm. All waveguides are placed in the nodes  ,
,  of a square grid, where d is the spacing between neighboring guides (see fig. 1). We address arrays that exhibit so-called diagonal disorder, where the depths of the individual waveguides are randomized as
  , where
  is a random refractive index perturbation uniformly distributed within the segment
 ![$[-p_{\text{d}} ;+p_{\text{d}}]$](https://content.cld.iop.org/journals/0295-5075/109/5/54001/revision1/epl16945ieqn9.gif) , and p0 stands for the mean refractive index. In the numerical simulations reported here, we used values of the parameters aligned with standard experimental values of laser written arrays [21,23]. Thus, we set
, and p0 stands for the mean refractive index. In the numerical simulations reported here, we used values of the parameters aligned with standard experimental values of laser written arrays [21,23]. Thus, we set  , d = 2, and
  , which for a characteristic scale
  correspond to an actual refractive index contrast of
  , a waveguide width of
  and a period
  . A normalized propagation distance
  at the wavelength
  corresponds to an actual length of
  .
.
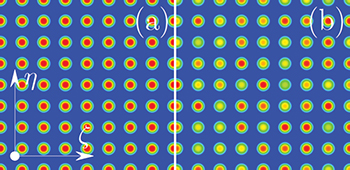
Fig. 1: (Colour on-line) (a) Regular and (b) disordered two-dimensional waveguide array.
Download figure:
Standard imageNote that contrary to disordered fiber addressed in [34,35], here we consider lattice with the well-defined spatial structure and randomized depths of individual guides (fig. 1). We set typical values of the refractive index contrast so that an isolated guide supports only a single mode. Such waveguide arrays are fabricated using, e.g., widely accessible direct laser-writing techniques [21] that also impose technological restrictions on the maximal value of the refractive index contrast. In computer simulations, the lattice period and the sample length were selected to observe sufficiently strong diffraction of the input pattern. Further, we focus our attention on arrays with a square geometry, but a qualitatively similar scenario is observed for honeycomb and hexagonal array geometries. To check it one can compare typical diffraction patterns in disordered square [23,24] and honeycomb lattices [37].
We considered a variety of different input patterns constructed using fundamental modes of the isolated waveguides, as illustrated in fig. 2 and fig. 3, with equal peak amplitude a = 1 for all bright spots in all cases. We followed the evolution of such patterns in a regular waveguide array and we observed that the patterns rapidly expand and distort due to discrete diffraction, so that similarity with the original pattern is lost already at the distance  . In order to analyze the effect of disorder on such inputs, we generated
  realizations of disordered arrays for each level of disorder
  . Using a standard split-step Fourier method, we integrated eq. (1) for each complex input excitation up to the distance
  in order to achieve a steady-state regime of propagation. Notice, that L is ten times larger than the distance at which the pattern is already completely distorted in the regular array. At high enough disorder level, one observes that discrete diffraction is arrested and beating between multiple Anderson-localized eigenmodes of the disorder array dominates light propagation. In most cases, the localization regime is reached already at moderate ξ values, well within the range of experimentally available setups.

Fig. 2: (Colour on-line) Input (left column) and corresponding averaged output intensity distributions in the disordered waveguide arrays for different disorder levels.
Download figure:
Standard image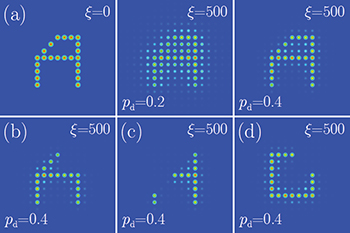
Fig. 3: (Colour on-line) (a) Input (left column) and averaged output intensity distributions for different disorder levels, for an input beam in the form of the capital letter A. (b)–(d) Averaged output distributions when  for various inputs when the lattice is regular in one quarter ((b) and (d)) and in half (c) of the space.
Download figure:
Standard imageTo perform statistical analysis, the output intensity distributions  were averaged over the ensemble of array realizations as

The averaged output intensity distributions for simple multi-spot inputs in the form of geometrical figures (such as a square, a triangle, etc.) are shown in fig. 2. As expected, at small disorder levels  the averaged patterns are strongly blurred. The overall pattern width may considerably exceed that of the initial one. Increasing the disorder level results in the convergence of the averaged output pattern toward the input one. Already at
  , the geometry of the input pattern is clearly visible at the output (fig. 2, center). At even larger disorder levels, such as
  , the Anderson-localized eigenmodes reside nearly on a single channel of the array and therefore the input beam excites predominantly such strongly localized modes. Under such conditions, the averaged output intensity distribution almost perfectly matches the input one. As one can see, in the averaged pattern, the light penetrates only into the nearest neighbor waveguides (fig. 2, right). Thus, on average, increasing the disorder level results in a better pattern transmission, enabled by the Anderson localization of the individual light spots.
Similar results were obtained for patterns in the form of various letters. For example, the top row of fig. 3 shows the evolution of the averaged output intensity distribution of an input in the form of the capital letter A, for increasing levels of disorder. Importantly, the particular arrangement of bright spots in the input pattern is not important from the point of view of quality of transmission. We also checked that the relative phases of bright spots do not play any significant role here, which is in contrast with the pattern transmission in nonlinear regular lattices where a suitable phase engineering is essential [36]. Interestingly, in highly disordered fibers the phase modulation of the input beam leads to the light focusing [38].
To confirm the disorder-induced nature of the pattern localization and at the same time test its global robustness, we performed simulations in arrays where selected spatial parts are regular. In this case, some fraction of the input excitation (initially located in the regular region of the array) practically disappears in the averaged output pattern because of the pronounced discreet diffraction. Figures 3(b) and (d) depict the cases where the array is regular in the first quadrant and fig. 3(c) shows the case of an array that is regular above the diagonal.
For each particular disorder realization, the output intensity distribution may be notably different from the input one, as illustrated in fig. 4, left column. However, despite the fact that the output distribution looks irregular, the plots indicate that disorder provides practically full inhibition of tunneling to neighboring waveguides. Therefore, while dynamical evolution does result in distortions of the pattern, the output retains information about the input geometry. In particular, the bright spots in the output pattern are concentrated mostly within the region occupied by the initial pattern. Averaging over the ensemble of realizations restores the information about the input pattern already for a few realizations  , as shown in fig. 4. Such approach is very similar to Labeyrie's well-known method [39] for measuring star diameters with high resolution in spite of the turbulent atmosphere, when the averaging over many images, made with small exposure time in order to freeze the atmospheric turbulence, compensates the influence of turbulence. In our case, the output pattern at a particular array realization corresponds to a single image in Labeyrie's method. Notice that one may use such approach for pattern transfer in the system of coupled channels with non-stationary randomly varying channel parameters if transfer time is less than the characteristic time of parameters variation.

Fig. 4: (Colour on-line) Averaged output intensity distributions at  for a progressively increasing number Q of realizations of the disordered arrays. In (a) the input pattern has a square shape, while in (b) it has the form of the capital letter A.
Download figure:
Standard imageTo quantify the similarity of the input and output patterns, we introduced the integral criteria
where  is the maximal value of the averaged intensity in the transverse plane, while
  is the initial intensity distribution (as it was indicated above,
  ). These criteria characterize the integral difference of the input intensity distribution and the averaged output one. Small K1,2 values indicate a high similarity of the input and output patterns, or better transmission quality. We calculated K1,2 for the input pattern in the form of the letter A (depicted in fig. 3(a)) for different disorder levels. Both quantities reach a steady-state value upon propagation, and the transition length diminishes with the growth of the disorder level (fig. 5(a)). This is a consequence of the suppression of ballistic transport and the onset of the Anderson localization, which appears faster for larger
  . The asymptotic K1,2 values at
  monotonically decrease as a function of the disorder level
  (fig. 5(b)). For high disorder levels, both quantities K1 and K2 are very close to each other, because the peak intensity
  in the output pattern remains close to the input one and does not drop considerably as it happens in the regular limit
  (in this latter case the decrease of the peak intensity is accompanied by a considerable broadening of the entire averaged distribution). Note that higher values of the refractive index contrast p0 will result in weaker discrete diffraction and, thus, in smaller values of disorder necessary for effective localization.
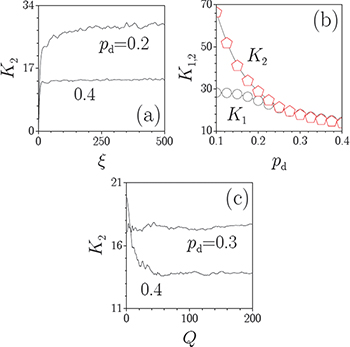
Fig. 5: (Colour on-line) (a) Integral criterion K2 characterizing the degree of pattern distortion vs. propagation distance at Q = 200 and different disorder levels. (b) Output values of K1,2 vs. disorder level at Q = 200. (c) Output value of K2 vs. number of realizations Q at different disorder levels. In all cases the input pattern has the form of the capital letter A.
Download figure:
Standard imageWe also analyzed the dependence of the integral criteria on the number of realizations Q of disorder arrays over which the statistical averaging is performed. It was found that for each particular pattern and for a fixed disorder level, there is a characteristic number of array realizations, beyond which the quantities K1,2 stabilize and remain nearly unchanged. A typical dependence  is illustrated in fig. 5(c). Interestingly, the saturation of the K2 factor with the increase of the number of array realizations in the statistical ensemble occurs faster for smaller disorder levels. One can see that while the difference between the output patterns for Q = 1 and Q = 25 is remarkable (see fig. 4), the patterns obtained for Q = 25 and Q = 200 are nearly identical (compare the last panels presented in fig. 4(b) and fig. 3(a)).
We verified that the Anderson localization is robust enough to allow the transfer of patterns composed of spots with different intensities. In fig. 6 we show the input and the corresponding averaged output intensity distributions for patterns including spots with two different amplitudes  and
and  . The simulations showed that the small-scale amplitude modulation is preserved in the output pattern, again as long as the disorder level is high enough. However, if the modulation amplitude
  is too large, it becomes difficult to distinguish small-amplitude spots on the background arising due to the penetration of the exponential tails of localized spots into neighboring guides.
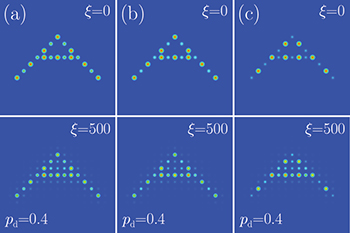
Fig. 6: (Colour on-line) Input (top row) and averaged output (bottom row) intensity distributions for different amplitude modulation depths  (a),
(a),  (b), and
  (c) at
  .
.
Download figure:
Standard imageFinally, we also considered the possibility of pattern transmission in arrays with off-diagonal disorder, namely when the coordinates of the waveguide centers are randomized. We found that in such case the transmitted patterns always experience strong distortions, which are associated with several factors. Among them are fluctuations in a waveguide position that cause the broadening of individual bright spots in the averaged pattern. Moreover, in the case of off-diagonal disorder Anderson-localized modes usually form on two closely spaced waveguides (rather than on a single waveguide, as in the case of diagonal disorder), a key effect that also results in the blurring of the transmitted patterns.
To summarize, we showed that the Anderson localization of light allows the transfer of complex patterns in a two-dimensional shallow waveguide array with diagonal disorder. At high enough disorder levels, the averaged output intensity distributions reproduce well complex input excitations. The quality of the input-output similarity was confirmed to increase with the growth of the disorder level.
Acknowledgments
OVB acknowledges the financial support of Russian Foundation of Basic Research (project No. 13-02-01122).