


Abstract
We propose a model for the dynamics of a probe embedded in a living cell, where both thermal fluctuations and nonequilibrium activity coexist. The model is based on a confining harmonic potential describing the elastic cytoskeletal matrix, which undergoes random active hops as a result of the nonequilibrium rearrangements within the cell. We describe the probe's statistics and we bring forth quantities affected by the nonequilibrium activity. We find an excellent agreement between the predictions of our model and experimental results for tracers inside living cells. Finally, we exploit our model to arrive at quantitative predictions for the parameters characterizing nonequilibrium activity, such as the typical time scale of the activity and the amplitude of the active fluctuations.
Export citation and abstract BibTeX RIS
Actin filaments are involved in a number of functions including cell motility, adhesion, gene expression, and signalling. When fueled by ATP supply, myosin motors advance along these filaments by performing a directed stochastic motion. By tracking the trajectory of a micron-size probe embedded within the cytoskeletal network, and by subjecting it to microrheology experiments, one can hope to access and understand some of the properties of the nonequilibrium activity inside the cytoskeletal network. Experiments were first carried out in actin gels without molecular motors, known as passive gels [1–5]. Some progress in the experimental field has provided new results for tracers attached to the cortex of living cells [6], and also for in vitro actin gels [7,8]. In such gels, called active gels, the tracer dynamics exhibits large excursions corresponding to directed motion events, in addition to the thermal fluctuations already observed in passive gels. Due to the active processes, the actin network fluctuations comprise a strongly nonequilibrium component. Experimentally, the out-of-equilibrium nature of such activity has been evidenced by the violation of the fluctuation dissipation theorem (FDT) [9–11]. To account for nonequilibrium activity, a generalization of the FDT has been developed introducing a frequency-dependent effective temperature [12–14]. This generalization is based on a description of tracers dynamics at a mesoscopic scale, which can be described using a generalized Langevin equation [15–17]. At a macroscopic scale, the dynamics of acto-myosin networks have been described via hydrodynamic treatments [18] or polymer theory [19,20].
In what follows, we present results of microrheology experiments in the cytoplasm of living cells, which are characterized by a highly nonequilibrium activity. Along with experiments, we propose a model which mixes simple but nontrivial rheology with random fluctuations due to active processes inside the cell. We carry out a comparison with experimental data, which allows us to directly determine some microscopic mechanisms that drive active fluctuations inside the cell. We demonstrate that our quantitive estimation of the nonequilibrium active features is consistent with different kinds of experimental measurements, thus supporting the overall consistency of our model.
We inject sub-micron colloidal tracers in the cytoplasm of living A7 cells, and track a two-dimensional projection of their fluctuating (3-D) motion with confocal microscopy [21]. We observe some directed motion events in the tracers' trajectories in addition to the thermal fluctuations of small amplitudes (fig. 1), as already reported in synthetic active gels [7]. To investigate the role of biological activity in the intracellular mechanics, we subject cells to two treatments. We inhibit myosin II motors by adding  of blebbistatin to the culture medium, and we deplete cells of ATP through addition of 2 mM sodium azide and 10 mM of 2-deoxyglucose. We extract the one-dimensional mean square displacement (MSD) from the spontaneous motion of tracers for different radius sizes
  . We present the MSD multiplied by a for the control, blebbistatin and ATP depleted conditions in fig. 2(a), showing that the MSD scales like
  . The small time MSD is constant in the three conditions, while the large time behavior is diffusive, apart for ATP depleted cells, where it remains almost constant. Since the time evolution of the MSD is qualitatively similar for tracers of different sizes, we deduce that the tracers are bigger than the mesh size of the cytoskeletal network, thus allowing us to consider that they evolve in a continuous medium in the first approximation.
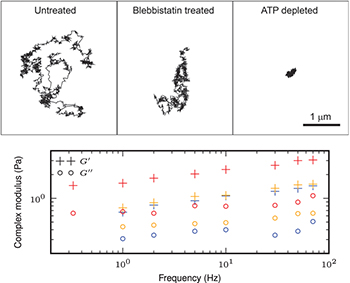
Fig. 1: (Color online) Top: typical trajectories of 200 nm PEG coated beads in A7 cells under three conditions: control,  blebbistatin treatment, ATP depletion. The trajectory length is about 2 min. Bottom: elastic storage modulus
  and loss modulus
  from active microrheology experiments in untreated (red), blebbistatin treated (orange), and ATP depleted (blue) A7 cells.
Download figure:
Standard image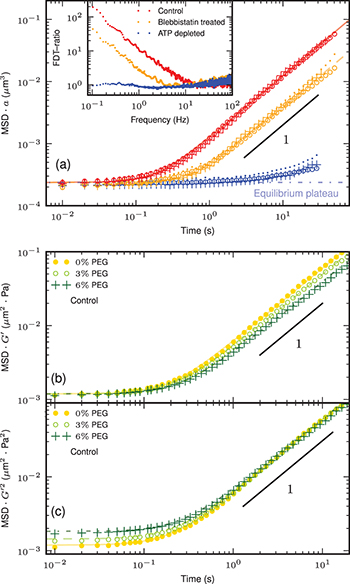
Fig. 2: (Color online) (a) Time evolution of the one-dimensional mean square displacement scaled with the tracer radius  ,
,  and 250 nm (small dots) for control (red), blebbistatin treated (orange), and ATP depleted (blue) cells, and the corresponding best-fitting curves (eq. (2)): solid, dashed, and dot-dashed line, respectively. Inset: FDT-ratio as a function of frequency. It equals 1 in ATP depleted cells as for an equilibrium system, and it deviates from it in the two other conditions at small frequency showing that nonequilibrium processes drive the dynamics in this regime. (b) Time evolution of the MSD scaled with
  measured with tracers of radius
  in control cells. The
  value increases with the percentage of PEG introduced in the cell: 0% (yellow •), 3% (light green ∘), and 6% (dark green +). The best-fit curves are shown as solid, dashed, and dot-dashed lines, respectively. The short-time scale plateau scales like
  . (c) Time evolution of the MSD times
  . The large-time diffusive part scales as
  .
.
Download figure:
Standard imageWe measure the mechanical properties of the cytoplasm via active microrheology method by using optical tweezers [22]. We impose a sinusoidal oscillation on a particle with diameter  within the cytoplasm. From the resultant displacement of the bead, we extract the complex modulus
  , where χ is the Fourier response function. It reveals that it weakly depends on frequency, and that the elastic contribution is significantly larger than the dissipative one (fig. 1), in agreement with previous results [22,23]. Moreover, we do not observe a significant change in the cytoplasmic mechanical property according to active processes. The cytoplasm is still mainly elastic in blebbistatin treated and ATP depleted cells, with a storage modulus being twice as small as in untreated cells where it equals approximately 2 Pa.
To quantify the departure from equilibrium, we extract the FDT-ratio which compares the active microrheology measurement with the random intracellular motion visualized by tracer particles [9–11]. It is defined in terms of the position power spectrum  and the imaginary part of the Fourier response function
  as
as ![$\text{FDT-ratio}(\omega)=-\omega\tilde C(\omega)/{\left [ {2\chi''(\omega)k_\text{B} T} \right]}$](https://content.cld.iop.org/journals/0295-5075/110/4/48005/revision1/epl17124ieqn21.gif) , where T is the bath temperature. It equals 1 for an equilibrium system, and deviates from it otherwise. The control and blebbistatin treated cells are out-of-equilibrium, whereas the effect of the nonequilibrium processes are negligible in ATP depleted cells (inset in fig. 2(a)). This supports that the nonequilibrium processes hibernate in the latter as long as no ATP supply is provided, suggesting that there is an equilibrium reference state where the tracer particle is trapped in an elastic cytoskeletal network. Given that we cannot rely on equilibrium physics to describe the tracer's dynamics in the two other conditions, we offer a new model to characterize its nonequilibrium properties.
, where T is the bath temperature. It equals 1 for an equilibrium system, and deviates from it otherwise. The control and blebbistatin treated cells are out-of-equilibrium, whereas the effect of the nonequilibrium processes are negligible in ATP depleted cells (inset in fig. 2(a)). This supports that the nonequilibrium processes hibernate in the latter as long as no ATP supply is provided, suggesting that there is an equilibrium reference state where the tracer particle is trapped in an elastic cytoskeletal network. Given that we cannot rely on equilibrium physics to describe the tracer's dynamics in the two other conditions, we offer a new model to characterize its nonequilibrium properties.
We vary experimentally the elastic modulus  by adding various amount of 300 dalton polyethylene glycol (PEG) into the cell culture medium1
. This results in an osmotic compression on the cell, so that
by adding various amount of 300 dalton polyethylene glycol (PEG) into the cell culture medium1
. This results in an osmotic compression on the cell, so that  increases with the amount of PEG applied [24]. We report in figs. 2(b), (c) the MSD data multiplied by
  and
and  for different values of
  . It appears the value of the small time plateau scales as
  while the long-time diffusion constant scales as
  .
.
The cytoskeleton acts as a thermostat for the tracer particle. Provided that inertial effects are negligible in the intracellular environment, we model the dynamics of the tracer's position r by means of an overdamped Langevin equation. We use a harmonic approximation to account for the interaction of the tracer with the surrounding network. The main new ingredient of our model lies in expressing the effect of nonequilibrium activity. We postulate that the underlying action of the active processes induces local rearrangements of the network, resulting in an active force applied on the tracers. As an example of such nonequilibrium processes, the activity of myosin II motors can slide cytoskeletal filaments past each other leading to a local deformation of the network [7]. To account for the directed motion events observed in our experimental trajectories, we consider that the active force proceeds by a sequence of rapid ballistic jumps followed by quiescent periods. It remains constant during intervals of average quiescence time  , when the tracer is only subjected to thermal fluctuations, and it varies during a persistence time of order τ by a quantity
  , where
  is a random direction in the three-dimensional space. We assume that the persistence and quiescence times are exponentially distributed variables as observed in synthetic active gels [7,8,25], and that they do not depend on the network and tracer properties. Putting these ingredients together, we arrive at the equation for x, the one-dimensional projection of r,

where ξ is a zero mean Gaussian white noise with correlations  , and
, and  is a random force with typical realization described in fig. 3(a). The spring constant of the surrounding network is k, and γ is the friction coefficient of the environment. Our model is associated with a Fourier response function
  , from which we deduce that the complex modulus is of the form
  , where η is the viscosity of the fluid surrounding the tracer [17,26]. We neglect the weak frequency dependence of the real part
  as determined from active microrheology measurements, so that the spring constant is directly given by
  , as already reported in other complex fluids with similar elastic behavior [26]. Stokes' law ensures that γ is independent of
  , and
, and  .
.
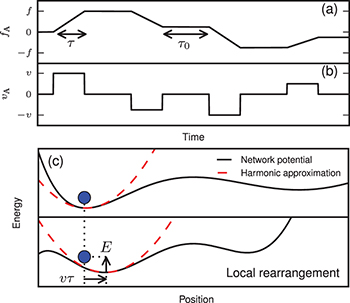
Fig. 3: (Color online) Typical realization of (a) the active force  , and (b) the corresponding active bursts
  .
.  is constant over a quiescence time of typical value
  , and varies linearly with a slope uniformly distributed in
 ![${\left [ {-f,f} \right]}$](https://content.cld.iop.org/journals/0295-5075/110/4/48005/revision1/epl17124ieqn47.gif) during a persistence time of order τ.
during a persistence time of order τ.  is proportional to the time derivative of
  . (c) Schematic representation of the energetic landscape rearrangement due to nonequilibrium activity and its modeling using the active burst applied on the local minimum. We depict the network potential with a black solid line, the harmonic approximation with a dashed red line, and the tracer particle with a filled blue circle. Nonequilibrium activity leads to a displacement vτ of the potential, resulting in an energy gain
  for the tracer.
Download figure:
Standard imageTo illustrate our model with an immediate physical picture, we introduce the variable  which we regard as the position of the local minimum of the potential in which the tracer is trapped. The local rearrangements of the network due to nonequilibrium activity result in a shift of the local minimum the tracer sits in. Thus, this position has a dynamics of its own given by a random active burst
  in which a burst
  is felt during the persistence time, while it equals zero during the quiescence time (fig. 3(b)). The active force projection is simply related to the active burst projection as
  . We assume that the typical variation f of the active force is independent of the network properties, whereas the active burst amplitude
  depends on the properties of the cytoskeletal network via k.
From the Fourier transform of eq. (1), we compute the position autocorrelation function  , and then deduce the one-dimensional MSD as
  . We denote the thermal contribution to the MSD by
  , and the MSD when the particle is only subjected to motor activity by
  , so that:
  . The thermal MSD is the same as for the Ornstein-Uhlenbeck process, and we compute the active contribution in terms of the parameters characterizing the active force:

where  is a microscopic relaxation time scale. In the passive case, i.e. when
  , it saturates to the value
  within a time
  as predicted by the equipartition theorem, meaning that the tracer is confined in the cytoskeleton. The active force represents the random fluctuations of the cytoskeletal network induced by the nonequilibrium activity. With such a force, the MSD exhibits a plateau at the equilibrium value corresponding to a transient elastic confinement at times
  , and then has a diffusion-like growth on longer times with coefficient
  . Provided that
  , it follows that the equilibrium plateau scales like
  , as we observe experimentally (fig. 2(b)). The energy scale
 ![$k_\text{B} T_\text{A}=\gamma (v\tau)^2 /[3(\tau+\tau_0)]$](https://content.cld.iop.org/journals/0295-5075/110/4/48005/revision1/epl17124ieqn69.gif) defines an active temperature, which is related to the amplitude of the active fluctuations as defined by the active burst correlations
defines an active temperature, which is related to the amplitude of the active fluctuations as defined by the active burst correlations  . The independence of f and τ with respect to
  yields
  , from which we deduce that the long-time diffusion coefficient scales as
  , in agreement with our measurements (fig. 2(c)).
On the basis of our phenomenological picture where the nonequilibrium dynamics is driven by an active remodelling of the cytoskeletal network, we propose a physical argument for the scaling of the MSD with the tracers' size a presented in fig. 2(a). As presented above, we first assume that k and γ scale like a. Within our model, the active burst represents the activity-driven network deformation and reorganization, which result in a change of the tracer's local energetic landscape. During a burst event, the local minimum is shifted by a random amount. Regarding this event as instantaneous, the tracer finds itself at a distance of order  from the new local minimum position after each burst. It follows that the typical energy provided by nonequilibrium activity to the particle is
  , as depicted in fig. 3(c). We assume that it does not depend on the particle properties, just as τ and
  , thus being independent of the tracer's typical size a. Since
  , we deduce
  , implying that
  is independent of a. Finally, the relaxation time
  is also independent of a, leading to a scaling of the MSD like
  which agrees with our observation.
We use our analytic expression to fit the MSD data multiplied by a for the three conditions described above. We assume the viscosity of the fluid surrounding the tracer is the cytoplasm viscosity  [27], and we deduce the damping coefficient from Stokes' law:
  . We estimate the k value from the small time plateau. The only remaining parameters are the ones characterizing nonequilibrium activity:
  ,
,  , in control and blebbistatin treated cells, respectively. The estimation error made on
  is of the order of 1% in control, and 0.1% in blebbistatin treated cells.
The amplitude of the active fluctuations is smaller in blebbistatin treated cells, meaning that the inhibition of myosin II motors reduces the proportion of nonequilibrium fluctuations with respect to the thermal ones as expected. Other nonequilibrium processes drive the out-of-equilibrium dynamics in this condition. The typical time scale τ of the persistent motion events is enhanced in blebbistatin treated cells. Assuming that each active burst persists until the stress that accumulates in the network causes the network to locally fail, weaker motors due to the addition of blebbistatin will contract for a longer duration until such a critical stress builds up. Provided that  is the typical frequency below which the nonequilibrium processes affect the dynamics, this supports that the active fluctuations take over the thermal ones at larger frequencies in the control cells compared with the blebbistatin treated ones. Notice that
  represents the ability of the tracer to diffuse on long times, and T quantifies here only the motion of the bead at short times when it is trapped within the elastic cytoskeletal network. The fact that we find
  small compared to T does not mean that the active processes are negligible, as they control entirely the long-time and long-distance diffusion of the tracer. In the absence of activity, the tracer does not diffuse at all and remains trapped in the elastic network.
To characterize the properties of the active force, we focus on the power spectrum of the stress fluctuations, i.e. the Fourier transform of the time correlation function  [9,11,15]. We extract the power spectrum of the overall force
  as the power spectrum of the position times
  [15]. Provided that the ATP depleted condition is in an equilibrium state, the active force
  is negligible in these cells and the overall force reduces to the ξ, thus providing a direct measurement of the thermal force spectrum. We remove this equilibrium contribution to the overall spectrum to deduce the active force spectrum in the two other conditions. We observe a
  behavior at low frequency as already accounted for on general grounds [9,14,15,28], and the large-frequency curvature hints a crossover to another power law (figs. 4(a), (b)). Our analytic prediction for the active force spectrum reads
It combines properties of the network and parameters characterizing the active force, since the effect of nonequilibrium activity on the tracer is mediated by the network within our model. We recover the divergence as  at low frequency, and we predict a power law behavior
  at high frequency, the crossover between the two regimes appearing at
  . We compare our prediction with the experimental data by using the best-fit parameters estimated from the MSD data. Without any free parameter, we reproduce the measured spectra (figs. 4(a), (b)). This result is a strong support for our model, in which
  not only quantifies the long-time diffusion coefficient of the tracers, it is also related to the typical amplitude of the fluctuations generated by the nonequilibrium active force. The study of the high-frequency spectrum calls for new experiments as it would confirm the validity of our phenomenological picture.
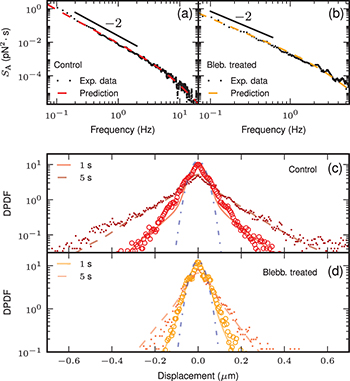
Fig. 4: (Color online) Top: active force spectrum  as a function of frequency measured with tracers of radius
  in (a) control, and (b) blebbistatin treated cells. The experimental data are in black small dots, and the dashed lines correspond to eq. (3) with the parameter values deduced from the best fit of the MSD data. Bottom: probability distribution function of the tracer displacement (DPDF) at two different times:
  , and
, and  (small dots). The DPDF is measured with tracers of radius
  in (c) control, and (b) blebbistatin treated cells. We present the corresponding results from numerical simulations of eq. (1) in solid and dashed lines, respectively. The blue dot-dashed line is the corresponding equilibrium Gaussian. The parameter values are the same for the two lag times: (b)
  , (c)
, (c)  .
.
Download figure:
Standard imageTo study in more detail the properties of the active force, we analyze the probability distribution function of the tracer displacement (DPDF). It exhibits a Gaussian behavior at short and long times. In the intermediate regime, we observe a central Gaussian part which matches our equilibrium prediction in the absence of activity, and exponential tails accounting for directed motion events consistent with previous observations in synthetic active gels [7]. Within our model, the non-Gaussian behavior of the DPDF is a direct and unique consequence of the non-Gaussianity of the active force. We ran numerical simulations of the dynamics in eq. (1) to reproduce the time evolution of the DPDF. We set the different parameter values to the one estimated previously, letting us with only one free parameter: the average quiescence time  . It quantifies the average time between two successive directed motion events, thus controlling the relative importance of the exponential tails with respect to the Gaussian central part. We adjust this parameter by matching the exponential tails observed at different times.
With a fixed  value, we manage to reproduce the evolution in time of the whole experimental DPDF. This shows that the specific form we choose for the active process is sufficient to reproduce not only the MSD and force spectrum data, but also to account quantitatively for the dynamic non-Gaussian properties of the distribution (figs. 4(c), (d)). We estimate
  in control and blebbistatin treated cells, respectively. The extracted values are very similar for the two conditions, showing that the addition of blebbistatin does not affect the typical time over which the tracers are only subjected to thermal fluctuations. It suggests that this time scale is related to the recovery of the network following a large reorganization, thus being barely independent of the activity of the nonequilibrium processes. Notice that the corresponding duty ratio
  is smaller in control than in the blebbistatin treated cells:
  , respectively. It is a quantitative evidence that the exponential tails are more pronounced in the control condition, namely the proportion of directed motion events is increased. We deduce the value of the typical active burst amplitude:
  in control and blebbistatin treated cells for
  , which are compatible with velocity scales observed in [29].
Microrheology methods have become a standard technique to explore cellular activity in living organisms [30]. In this work, we introduce a new model for characterizing the motion of a tracer in a living cell. This model explicitly accounts for the elastic behavior of the cytoskeletal network and successfully combines it with a description of the cellular active force —a well-defined non-Gaussian colored process. By analyzing the MSD data, we quantify two essential features of this force: its strength, and the typical time scale over which it is felt. Our model goes beyond previous modeling which treated the nonequilibrium activity as a random noise with unprescribed characteristics [15]. In a previous work, activity was modeled as a trichotomous noise acting directly on the particle [12], whereas such activity is mediated by the surrounding network within our new proposal. The present model combines the short-time confined behavior with a long-time free diffusion which is driven by the active force, and recovers all the main experimental results. The model applies as long as we are in the regime of simple viscoelastic behavior. Dressing our model with a more realistic rheology, e.g., with a power law behavior for the complex modulus, usually observed in cell rheology [31], is conceptually straightforward as a future elaboration of the model. Further generalization of our model could be used to describe active fluctuations in other nonequilibrium (living or mechanically driven) systems that exhibit similar behavior [7,32,33].
Acknowledgments
We acknowledge several useful discussions with Julien Tailleur and François Gallet. NSG gratefully acknowledges funding from the Israel Science Foundation (grant No. 580/12).
Footnotes
- 1
After the stress, cells are allowed to equilibrate for 10 min at 37°C and 5% CO2, before we perform the imaging or optical-tweezer measurement. The cell size and mechanics equilibrate in 2 min after adding PEG based on our imaging and previous studies [24].