


Abstract
Two luminescence bands from zinc oxide (ZnO) nanoparticles are known and have been experimentally observed previously. The unanswered question concerns the mechanism leading to the visible spectrum in the blue or green region. So far there have been many postulations trying to elucidate this phenomenon, but none of them gives a mathematical expression that simultaneously explain these two spectra. Here we interpret this phenomenon as the combination of distribution functions and the density of states of electrons and holes, precisely the product of both. From the analysis, the narrow UV emission is predominantly attributed to the quantum confinement, and the product of the density of states and the distribution functions determines the visible spectrum. We find that varying the density and the effective mass of holes causes a pronounced effect on both UV and visible emissions, which reflects the fact that acceptors take the main responsibility in the experimental observations.
Export citation and abstract BibTeX RIS
Introduction
Wide visible luminescence bands of ZnO nanoparticles have attracted great interest due to their potential applications in optoelectronics and sensors. Although the narrow UV band emission of ZnO has been firmly attributed to the excitonic emission, the visible emission is still now open to debate. The explanations to the visible emission are mainly described as the effect caused by additional acceptors [1], such as copper (structured and structureless) [2,3], oxygen vacancies [4–6], indium doping [7,8], zinc implantation [9], additional nitrogen acceptors by thermal annealing [10,11], yttrium doping [12], lithium acceptor [13], and aluminium doping [14]. All of the above can be summarised into the imperative role played by the acceptors. Most of the recent research on this subject reinforces or confirms the previous argument [12,15–20]. So far descriptive explanations have been provided on the various mechanisms making ZnO exhibit visible luminescence. Many controversial statements surround the arguments of electrons transiting from various vacancies to the valence band [21,22], or from the conduction band to their interstitials [23]. However, these arguments are not well supported by the continuous and stable visible emission as electrons trapped in the vacancies or defects can vary. Also the vacancies and defects are very uncontrollable and unpredictable, which make it hard to explain the stable visible spectrum. Of these observed visible bands, green emission sparks several explanations, e.g., it may be caused by electrons transiting from a vacancy to the valence band [24] or it may be due to electron transition from conduction band to vacancy [25]. There have been longer wavelength emissions such as orange and red emissions [26,27]. Figure 1 shows the previously reported observation of double-band emissions from ZnO nanoparticles [28], and a scanning electron microscope (SEM) image of ZnO nanowires [29]. In this work we propose a theory that can predict the UV and visible emissions simultaneously. It reveals that the visible emission is the combined effect of the distribution functions and density of states of electrons and holes. Effective masses, density of electrons/holes and the temperature have been investigated to show their effect on the luminescence.
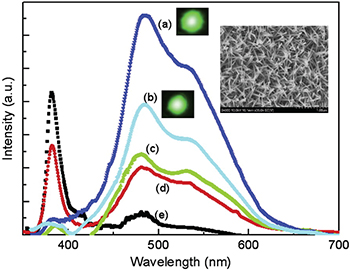
Fig. 1: (Colour online) Experimental observation of double-band luminescence of ZnO nanoparticles (reprinted from [28] with permission from Elsevier). The inserted graph is a scanning electron microscopic image of ZnO nanowires (reprinted from [29] with permission from Elsevier).
Download figure:
Standard imageAnalysis and results
Luminescence comes from electrons transiting from higher-energy states in the conduction band to lower-energy states in the valance band. In a nutshell, the bandgap of the material directly determines the luminescence spectrum. For the nanometre-sized ZnO structures, quantum confinement increases the bulk bandgap Eg by  , where
  is the reduced Planck constant, and me,h denote the effective masses of electrons and holes. r is the radius of the nanoparticle. In the analysis only ground states are taken into account. The exciton binding energy decreases the Eg by
  , where
  stands for the exciton Bohr radius [30]. Relative dielectric constant and permittivity in free space are represented by
  and
and  . Here
  is the reduced mass for the electrons and holes characterizing macroscopically conductivity. Therefore, the effective bandgap En after considering all these effects for the nanoparticles is expressed by

This is the energy that an electron loses through transiting from the ground state of the conduction band to the ground state of the valence band, subsequently generating a photon with energy  , where ω is the frequency of the photon. The above represents the basics of the luminescence of the semiconductor nanoparticles, and this well explains the UV luminescence. Taking all essential parameters, the calculated maximum is at 372 nm. In order to obtain more detailed results, factors such as the number of electrons in higher-energy states and the number of holes in the lower energy states available for taking part in the recombination process, as well as the number of excitation energies from the incident photons, i.e., the number of photons will be required. In the analysis it is assumed that the number of incident photons at all wavelengths are the same. According to the quantum optics theory [31], the emission rate that is the function of the number of incident photons and number of free electrons and holes can be expressed as

where  represents the interband matrix element of the perturbation
  , for most of the semiconductor material; this matrix does not vary very much, which can be considered as a constant in the calculation.
  and
and  denote the density of states and Bose-Einstein distribution for the incident photons, respectively. As the assumption of constant incident photons number is taken,
  remains unchanged.
  are density of states for the carriers and Fermi-Dirac distributions for electrons in the conduction band and the valence band, respectively,
  . Here we use the self-consistent iteration method to derive the chemical potentials
  ascribed to electrons in the conduction band and holes in the valence band. The density of states for 0D confined nanoparticles can be expressed using a Lorentzian, which is

where the  is the width at half its maximum of the Lorentzian, which is determined by the coupling between the nanoparticle and the outside metal. The empirical value has to be extracted from the experiment, here a value of around 25 meV is used. It is envisaged that the emission rate is proportional to the product of a Lorentzian and distribution functions. Therefore, it should be expected an emission spectrum with the peak at the energy of En corresponding to a wavelength of around 373 nm in the ultraviolet (UV) region, which has been experimentally observed previously in many works. It is the emission at the visible band that is ambiguous. The parameters and constants used in the simulation are described in the appendix.
In the analysis, we tune the following parameters to observe the phenomenon of the luminescence: they are the effective mass of the heavy hole, unbalanced numbers of electrons and holes (extra electrons and extra holes), and the temperature.
The effective masses of electrons and holes are virtual values derived from the  method with the aim of understanding the energy curves (electrons and holes) in the k-space. Physically it can be interpreted as the mobility of carriers. A large effective mass implies that the carrier is heavy and less mobile, semi-classically explained by the Newton law. Mathematically the effective mass can be written as
  . Some materials have larger electron effective mass and some have larger hole effective mass. For ZnO, the electron effective mass is smaller than hole's. It should be added that the electron effective mass varies much less than that of the hole. The valence band usually contains three sub-bands corresponding to three values of hole effective masses, namely light hole, heavy hole, and split-off. ZnO exhibits a direct bandgap, which means that the conduction band minimum is aligned with the valence band maximum. As to three valence bands, the light hole and the heavy hole share the maximum point when k = 0, also known as the Γ-point. The split-off band has a
  shift from the maximum of the light- and heavy-hole bands. The light-hole energy curve is steeper than that of heavy holes. We shall focus on the heavy hole, as the heavy hole dominates the property of the valence band. This is because the heavy-hole curve is much flatter than that of the light hole, indicating that for a fixed
  , the density of states of heavy holes is much larger.
The calculation results in fig. 2 show that there are two spectra, one in the UV region, and the other in the visible region. UV emission originated from the Lorentzian depends on the En. According to eq. (2). the distribution functions have several determining factors, which are effective mass, carrier concentration, and the temperature. We vary the effective mass of the heavy hole from 0.7m0 to 1.1m0 while keeping the other parameters unchanged. It is seen that as mh increases, the peak of the visible band shifts to the green region and the amplitude of emission reduces. The UV spectrum does not change except for the reduction of the amplitude. The shift of the visible spectrum is seen due to the flattening of the Fermi function (shown in fig. 2(b)). The appearance of the visible spectrum can be seen as the narrowed bandgap caused by the Fermi level split to one closer to the conduction band  and the other closer to the valence band
  shown in fig. 3. The level splitting is due to the increased electron-hole pairs by the incident photons. It is envisaged that when there are excessive electrons and holes, the material becomes highly conductive, in which case
  is very close to the conduction band minimum and
  is very close to the valence band maximum, resembling the properties of metals, in which case the visible luminescence arises from the recombination of conduction band electrons below the Fermi energy with holes in the d band [32].
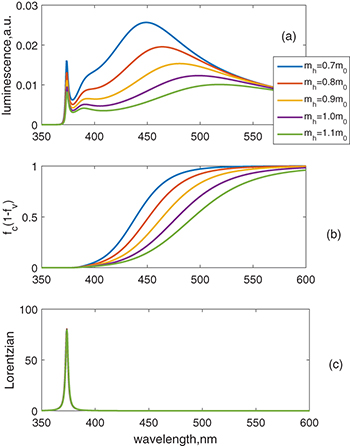
Fig. 2: (Colour online) Calculated luminescence of ZnO nanoparticles due to the factor of the varied hole effective mass mh. The electron effective mass is taken as 0.23m0, and the density of electron-holes pairs remains as  . (a) Luminescence vs. wavelength. (b)
  vs. wavelength. (c) Lorentzian vs. wavelength.
Download figure:
Standard image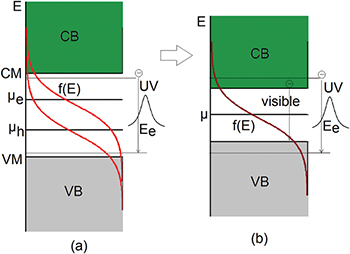
Fig. 3: (Colour online) Schematic graph of the band structure explaining the double emission of ZnO nanoparticles.
Download figure:
Standard imageWhen the density of holes exceeds the density of electrons, luminescence varies as shown in the calculated results in fig. 4, where the amplitudes of both the band-edge and visible emissions increase when increasing the value from  to
to  . This is understood as the increasing recombination probabilities for a larger number of holes, compared with the results in fig. 5, in which case only the density of electrons increases while keeping the density of holes unchanged, which does not affect the visible spectrum. It is seen that increasing the number of electrons does not change the Fermi distributions (fig. 5(b)) at the observable scale.
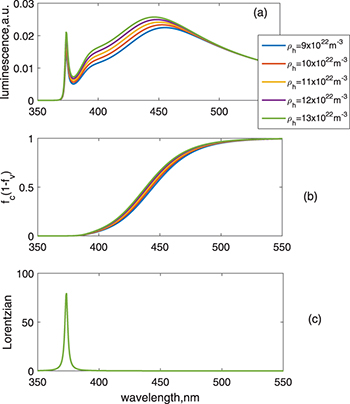
Fig. 4: (Colour online) Results for varying the density of holes. The other parameters are the same as those used in fig. 2. The hole effective mass is designated as 0.7m0. (a) Luminescence vs. wavelength. (b)  vs. wavelength. (c) Lorentzian vs. wavelength.
Download figure:
Standard image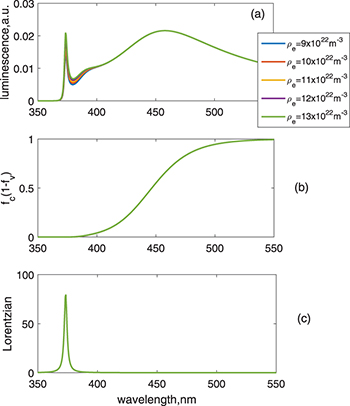
Fig. 5: (Colour online) Model for different values of densities of electrons, density of holes and the other parameters remain the same as in fig. 4. (a) Luminescence vs. wavelength. (b)  vs. wavelength. (c) Lorentzian vs. wavelength.
Download figure:
Standard imageThe temperature has a significant effect on the luminescence, as shown in the fig. 6. It is demonstrated that when temperature decreases, the visible spectrum shifts to the UV region and joins with the band-edge emission, the emission amplitude is also much increased. This is due to the sharpening of the Fermi distribution functions, so that the chemical potential splitting does not cause effective narrowing of bandgap. The emission is dominated by En at very low temperatures.
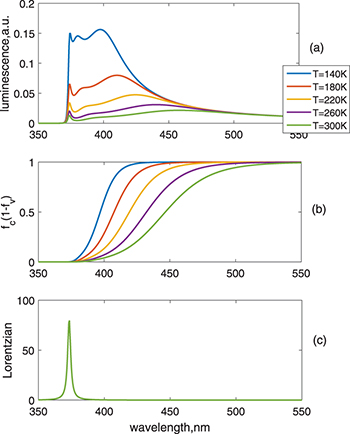
Fig. 6: (Colour online) Simulation of the luminescence from the temperature impact. Temperature changes from 140 K to room temperature. (a) Luminescence vs. wavelength. (b)  vs. wavelength. (c) Lorentzian vs. wavelength.
Download figure:
Standard imageConclusion
To conclude, an explanation of how the two emission bands appear for ZnO nanoparticles has been described underpinned by the quantum optics theory. It is revealed that this well-experimented phenomenon is the effect of the product of distribution functions and quantum confined density of states. The analysis provides a first general equation to simulate these two luminescence spectra simultaneously. Theoretical results match with the previously reported argument, which consists in the acceptors contributing to the visible luminescence. Our work shows that the properties of holes (effective mass and density) have a significant impact on the visible luminescence. It offers another way to describe the multi-band luminescence of the ZnO nanoparticles besides ambiguous explanations on the basis of defects and impurities.
Acknowledgments
LL acknowledges the support of the College of Engineering, Swansea University.
Appendix
In the analysis, constants were taken with values as follows: Planck's constant  , Boltzmann constant
  , single electron mass
  , single-electron charge
  , and permittivity of free space
  . The relative dielectric constant has been taken as
  [33], and radius of the nanoparticle was given as 50 nm. The bulk energy bandgap for ZnO was taken as 3.35 eV. The chemical potential in the Fermi distribution has to arrive from the density of carriers. For calculating the chemical potential, the following carrier density equation is used:

where an initial μ was given to arrive at n, then iterating the process by increasing/decreasing μ until n was very close to the pre-set value.
In order to investigate the impact due to the effective mass, effective masses of electrons and holes were initially given as 0.23m0 and 0.7m0, respectively, then the hole effective mass has been increased from 0.7m0 to 1.1m0 when keeping the electron effective mass unchanged as 0.23m0. Equation (2) was used to calculate the emission rate. The results are shown in fig. 2.
For researching the carriers concentration effect on the luminescence, the densities of electrons and holes were set initially to  , then we varied each of them from
  to
to  . In the temperature analysis, densities of electrons and holes were all given as
  , and effective masses of electrons and holes were designated as 0.23m0 and 0.7m0, respectively.