


Abstract
Plasma-assisted combustion is a growing field of applied physics. In this study, a DC gliding arc plasma reactor used as part of a swirler stabilized burner was characterized to evaluate the discharge repetition frequency as a function of process parameters. The discharge was generated in fuel-rich premixed mixtures of air and natural gas. The repetition frequency was determined by applying a fast Fourier transform to the voltage waveforms. The results show that the mean voltage and mean current of the gliding arc remain almost constant as a function of the total gas flow rate. The increase in fuel concentration promotes a drop in the breakdown voltage, which leads to a rise in the discharge repetition frequency. However, for a fixed natural gas flow rate, the repetition frequency grows with the increased total mass flow rate due to a higher arc velocity.
Export citation and abstract BibTeX RIS
Introduction
Non-thermal plasmas have been applied in combustion processes due to their capability of increasing rate constants and inducing new chemical routes. The plasma acts as an additional energy source, improving thermal effects. However, the main effects are related to the generation of radicals, excited species and electrons that can lead to different chemical pathways [1]. Among the beneficial effects for combustion, the broadening of the flammable range [2–6] and the pollutant emissions control [7–10] can be highlighted. Non-thermal plasmas at atmospheric pressure can be produced by various techniques, such as nanosecond pulsed discharges, sparks, coronas, dielectric barrier discharges (DBD) and gliding arc (GA) discharges [1,11]. The latter has the simplest design; it can operate with AC or DC power supplies and can be constructed in different geometries [12,13]. In particular, the reverse vortex flow configuration [14–17] assures better gas mixing inside the reactor, as well as lower heat losses through the walls.
Gliding arc discharges are non-stationary discharges generated between two divergent electrodes. The breakdown occurs at the shortest gap between electrodes, and then the generated plasma column is dragged by the gas flow, thereby promoting its elongation. In this phase, the plasma column is cooled down, which increases the discharge resistance and discharge voltage. When the power supply cannot sustain the increase in discharge length, the plasma extinguishes and the cycle restarts at the shortest inter-electrode gap. The discharge can also be reignited, even before the extinction of the previous plasma column, if the breakdown voltage is reached again during the cycle. Discharge current waveforms have an opposite behavior compared to the discharge voltage: at the breakdown, the current in the plasma column is the maximum; with elongation, there is a decrease in the discharge current until the next breakdown [18,19].
Although many studies deal with the electrical characterization of gliding arc discharges [20–22], little attention is given to the effect of the gas mixture in the discharge repetition frequency. Yu et al. [23] showed that the use of humid air increases the amplitude of the fundamental frequency of the GA discharge, and reduces high-frequency undulations in comparison with that of dry air. However, when water is added to the gas flow by spray, the increase in the spray rate can strengthen the sawtooth undulations in the voltage waveform. Rusu and Cormier [24] showed the existence of two fundamental frequencies in a rotating gliding arc: one at 100 Hz (due to the power supply) and another at 39 Hz. The increase in the weight of the second decreases the conversion of methane in a GA generated in a mixture of methane and water.
When operating at low current, gliding arc discharges can change to a glow discharge [18]. Korolev et al. showed that, in these cases, the breakdown and glow-to-spark transitions are responsible for the fuel ignition in plasma-assisted combustion of air-propane mixtures [25]. Recent studies in plasma-assisted combustion of fuel-rich air-natural gas mixtures show an increase in flammability limits when using an AC gliding arc discharge. However, it was observed from high-speed camera measurements that the flame generated in this extended flammable range occurs in cycles, as well as the discharge [3,7]. In fact, the flame ignition occurs at the breakdowns and is extinguished shortly after the discharge [3]. Such flame pulsation can affect the combustion stability.
One promising application of GA discharges is fuel-rich combustion in rich-quench-lean (RQL) combustors [26]. In such systems, the combustion is divided in two zones: a fuel-rich and a fuel lean zone. As the total amount of fuel in the combustor is generally kept constant, the fuel flow rate to the fuel-rich zone is an important parameter to determine the operation of the system.
In this study, the repetition frequency of a gliding arc discharge was analyzed by applying a fast Fourier transform (FFT) to the voltage waveforms. Two different fuel mass flow rates were used at different equivalence ratio and total mass flow rate conditions. The main goal was to determine how these parameters affect the breakdown occurrence.
Experimental setup
The reverse vortex flow plasma reactor is coupled to a swirler stabilized burner. However, in this study, only the plasma reactor was used, i.e., the gas mixture was injected only into the plasma reactor. This choice was made because the focus of the study is on the repetition frequency, and not on the overall aspects of plasma assisted combustion. Measurements with the burner in operation show that the flame in the burner does not have significant effects on the discharge characteristics, nor repetition frequency.
The plasma reactor is composed of a hollow stainless-steel cylinder 50.0 mm in length, with an inner diameter of 25.7 mm and a wall 10.1 mm thick. A convergent-divergent nozzle acts as the ground electrode while the reactor wall acts as the negative one. The smallest gap between the electrodes is 4 mm. The reactor is electrically insulated by a polytetrafluorethylene (PTFE) sleeve. Figure 1 shows schematics of the reactor and the burner.
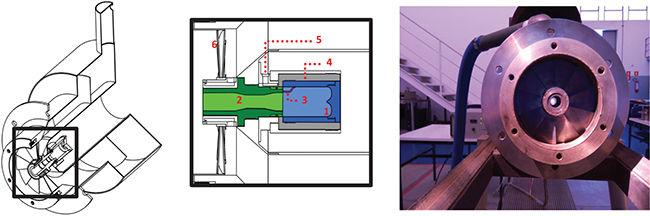
Fig. 1: (Colour online) Schematics of the reactor in the burner (left); reactor visualization (center) and a frontal picture of the system showing the swirler and the plasma formation at the center. Central panel: fig. 1 —the plasma reactor (negative electrode); 2 —the exit convergent-divergent nozzle (ground electrode); 3 —an example of breakdown between the electrodes; 4 —PTFE insulation sleeve; 5 —the reactor gas inlet; 6 —the swirler.
Download figure:
Standard imageThe plasma was generated in a fuel-rich premixed mixture of air and natural gas. Gas injection was controlled by two AALBORG GFM 77 mass flow meters. The flows were controlled by needle valves. The ranges for the mass flow meters are 0–1 g/s for natural gas and 0–15 g/s for air, both with a 1.5% precision of the full scale.
A BRC 10 kV –1 A Unipower DC power supply with a 10 kW maximum output power and a possible operational mode of current or voltage regulation (both with  adjustment precision) was used to generate and sustain the discharge. In the present case, the power supply was used in the voltage regulation mode. A 50 k Ω–2 kW ballast resistor was installed in series with the power supply in order to limit the discharge current to 200 mA. Voltage and current waveforms were recorded using a Tektronix TDS2024C oscilloscope with an impedance of 1 M Ωin parallel with 20 pF, 2 GS/s maximum sampling rate and two Tektronix P6015A 1000:1 voltage probes. Current waveforms were obtained from the subtraction of the voltage signals measured at the two terminals of the ballast resistor, in accordance with Ohm's law.
The equivalence ratio (Φ) is used to define the gas mixture condition:

where  is the fuel-air ratio in experimental conditions and
  the fuel-air ratio in the stoichiometric condition (complete fuel oxidation). Therefore,
  indicates a fuel lean mixture,
  a stoichiometric mixture and
  a fuel-rich mixture.
In the first series of measurements, the GA reactor operated using two fixed fuel mass flow rates: 0.25 g/s and 0.49 g/s. For each one, the air mass flow rate was varied to achieve equivalence ratios (Φ) from 3.0 to 5.2. Therefore, the total mass flow rate varied at same time. A set of additional experiments was performed using fixed total gas flow rates (1.85 g/s and 2.10 g/s), i.e., the air flow rate was reduced proportionally to the fuel flow rate increase, in order to change only the equivalence ratio.
Results
In the first set of experiments, for a fixed equivalence ratio, the increase in the fuel mass flow rate (and, consequently, in the total gas flow rate) promotes only a small increase in the mean voltage. This increase is around 2.6–5.3% except for the equivalence ratio of 3.5, where the variation reached 15%, as shown in fig. 2(a). However, in all the cases, the mean voltage variation is within the error bar, which includes the standard deviation and the equipment uncertainty (around 3%). Likewise, the mean discharge current does not change significantly, about 1% in all conditions, as shown in fig. 2(b). In the same way, the variation of the equivalence ratio (by increasing the air mass flow rate) does not significantly change the mean voltage and current.

Fig. 2: (Colour online) Mean discharge voltage (a) and current (b) as a function of the equivalence ratio for both the fuel conditions. Mean voltage and mean current in absolute values.
Download figure:
Standard imageFigure 3 shows the voltage waveforms for two different total mass flow rates at an equivalence ratio of 3.0. The cyclical behavior of the GA is observed in both cases: the breakdown voltage is between ( ) and (
 ) kV. After the breakdown, the discharge voltage drops close to 221 V, and the plasma column elongation causes the voltage to rise until a new breakdown restarts the cycle.
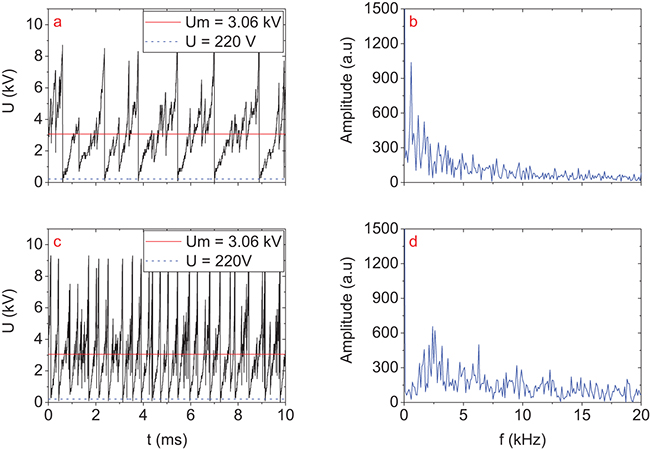
Fig. 3: (Colour online) Voltage waveforms ((a), (c)) and respective FFTs ((b), (d)) for two different conditions with  . (a) and (b):
  g/s,
g/s,  g/s; (c) and (d):
  g/s,
g/s,  g/s. Voltage in absolute values. The red line corresponds to the mean discharge voltage (
 ). Similarly, the blue dashed line in (a) and (c) corresponds to the voltage drop to almost 220 V after the breakdown.
Download figure:
Standard imageThe cycle period (time between successive breakdowns) changes slightly for each cycle, as can be seen in fig. 3. Given that the plasma column glides along the cathodic wall, different paths are allowed in each cycle.
In the second set of experiments, for a total gas mass flow rate of 1.85 g/s, the breakdown voltage is about ( ) kV and (
 ) kV when operating using 0.25 g/s and 0.49 g/s fuel flow rates, respectively. For a higher total flow rate of 2.10 g/s, the breakdown voltage was around (
 ) kV and (
 ) kV when fuel flow rate is 0.25 g/s and 0.49 g/s, respectively. The increase in the breakdown voltage (
 ) with the total mass flow rate was also reported in the literature [27].
An increase in the natural gas flow rate, for constant total flow rate, promotes a drop in the breakdown voltage, which results in a flattening of the voltage waveform as can be seen in fig. 4.
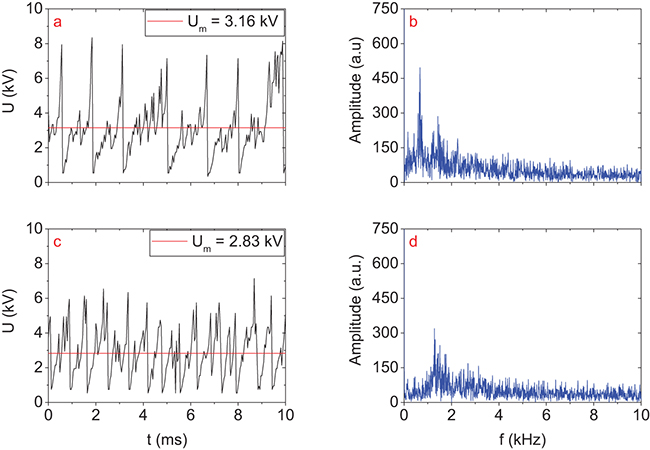
Fig. 4: (Colour online) Voltage waveforms and respective FFTs (in blue) for two conditions with a total mass flow rate of 1.85 g/s. (a) and (b):  g/s,
g/s,  g/s and
  ; (c) and (d):
  g/s,
g/s,  g/s and
  . Voltage in absolute values. The line corresponds to the mean discharge voltage (
 ).
).
Download figure:
Standard imageThis drop in breakdown voltage can be associated with the lower ionization energies of the major components of natural gas (89% methane - 12.61 eV, 6% ethane - 11.52 eV and 2% propane - 10.94 eV, other components corresponds to 3%) when compared with those of air (78% N2 - 15.58 eV, and 21% O2 - 12.07 eV, the sum of the other components is closer to 1%) [28]. Besides that, the total ionization cross-section for electron collisions is higher for methane [29] than for N2 [30] and O2 [31]. Also, a decrease in oxygen concentration along with an increase in equivalence ratio can lead to a decay in negative ion formation. The sum of these factors facilitate discharge ignition with increased equivalence ratio, i.e., a decrease in the breakdown voltage with an increase in natural gas concentration.
A Fourier analysis was performed on the voltage waveforms to analyze the behavior of the discharge frequency when the total mass flow rate and/or equivalence ratio are varied. This can be seen in figs. 3 and 4. A DC component is observed in the frequency spectrum in all conditions. As expected, this component has the highest amplitude when using a DC power supply. A relatively high noise in the spectrum is observed (figs. 3 and 4), which is caused by the variations in the discharge voltage within each cycle. The discharge repetition frequency was determined by the peak with the maximum amplitude, excluding the DC component. All the results are summarized in fig. 5, plotted against the equivalence ratio (fig. 5(a)) and total mass flow rate (fig. 5(b)).
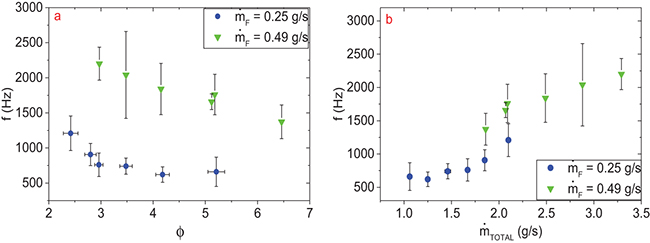
Fig. 5: (Colour online) Discharge frequency as a function of the equivalence ratio (a) and total mass flow rate (b).
Download figure:
Standard imageIt can be seen that by increasing the total gas mass flow rate for a constant natural gas flow, i.e., reducing the equivalence ratio, there is a growth in the discharge repetition frequency (fig. 5(a)). From fig. 5(a), it is noted also that, for a constant equivalence ratio, there is an increase in the discharge repetition frequency with increased natural gas flow rate (and total gas flow rate). From this and from fig. 5(b) (and fig. 3), it is clear that when the gas flow rate increases, the discharge repetition frequency rises. This is due to the increase in arc velocity, so the critical length is achieved in a shorter time [21,32,33]. This leads to a new breakdown and restarts the cycle.
From fig. 5(b) (and fig. 4), it can be seen that, for a given total mass flow rate, the discharge repetition frequency rises with the natural gas flow rate. This is caused by the reduction in the breakdown voltage observed in fig. 4. The lower breakdown voltage reduces the time interval between breakdowns, increasing the discharge repetition frequency.
So, the differences between the curves for 0.25 g/s and 0.49 g/s of natural gas in fig. 5(a) are due to the higher arc velocity caused by the rise in the total mass flow rate. On the other hand, the differences between the curves in fig. 5(b) (for the same total mass flow rate) are due to the methane concentration in the discharge. A higher methane concentration implies a higher discharge repetition frequency.
In a plasma-assisted burner, if the fuel mass flow rate is kept constant, the increase in the equivalence ratio leads to a decrease in the discharge frequency. For high equivalence ratios, the flame ignition is more difficult due to the excess of fuel. As the breakdown is responsible for the mixture ignition, the results show that the probability of failure in ignition is even higher in these conditions, due to the lower discharge repetition frequency. Such a behavior can cause the system to be unstable at high equivalence ratios.
Although there is an increase in the discharge repetition frequency with the total mass flow rate, it must be pointed out that this is related to an increase in flow velocity, which can lead to a flame blow-off.
Conclusions
The mean voltage and mean current of the discharge have no significant variation for the range of equivalence ratios and total mass flow rates used in this study. However, the discharge repetition frequency can increase up to 2.6 times. Both the increase in equivalence ratio (with constant total mass flow rate) and the increase in total mass flow rate (for constant equivalence ratio) lead to a rise in the discharge repetition frequency. In the first case, this is caused by the higher methane concentration, which has a lower ionization potential leading to a lower breakdown voltage and higher discharge repetition frequency. The drop in the breakdown voltage is evidenced by a flattening of the voltage waveform. In the second case, the rise in the discharge repetition frequency is a consequence of the increased arc velocity.
The decrease in the discharge repetition frequency with increased equivalence ratio (with constant fuel mass flow rate) leads to a higher probability of failure in flame ignition, causing the system to be unstable at high equivalence ratios. On the other hand, the increase in the total mass flow rate can lead to a flame blow-off. Both phenomena must be considered when choosing an optimum operational condition for plasma assisted burners.