

Abstract
This paper provides a brief review of the interesting physics that arises from the use of detrending methods for time series analysis for the study of phenomena related to problems of adaptation to climate change. It presents illustrative examples of some of the newly developed or already existent methodological solutions that can be used to study climate phenomena, and of three sectors —public health, infrastructure and cultural heritage— where statistical physics tools can be utilized. In the context of adaptation to climate change statistical physics can offer data-led understandings that are of wider value to the scientific community and applicable local-scale insights.
Export citation and abstract BibTeX RIS
Introduction
Two decades ago a series of papers came out introducing investigations realized at that time in the area of the "exotic statistical physics" by a group of cross-disciplinary researchers in Boston [1–6]. These papers introduced new theoretical approaches and methodological solutions, and novel results to deal with various phenomena that display strongly correlated randomness, to which principles of scale invariance and universality are relevant [4,6]. Those also proposed the notion of "exotic" to describe applications of statistical physics that looked "for interesting physics in a more or less mundane and "dirty" phenomenon" [7].
In the following twenty years this pioneering work spread across research groups and disciplines. This is how detrending methods for fluctuation analysis [8], a set of methodological solutions developed by the Boston group [9] that forms the focus of this paper, were extended to include different (from originally linear) orders of detrending as data pre-processing [10], to provide for both monofractal and multifractal measures [11], to additionally test for residue intrinsic data non-stationarities [12], and to allow for different (from originally polynomial) ways of detrending [13]. The basic assertion behind these analyses, that those can be used to help clarify the behaviour of nonstationary time series [4], was systematically examined against artificially generated data series [14–17] and in comparison with conventional methods of statistical analysis [18,19]. They were used to study a variety of records, mainly time series, to assess universality of scaling across complex systems and disciplines —from the electrical activity of single nerve cells [20] and hand movements in persons with pathological tremors [21], through stock market returns [22], also in Bitcoin and Ethereum markets [23], gearbox vibrations [24] and nuclear collisions [25], to seismic activity [26], distribution of forest fires [27], plant identification [28], animal behaviour [29], and number of war casualties [30].
As a consequence, there is probably no phenomenon that would today be considered "exotic" for the application of statistical physics. What is of interest now is rather the question of where the interesting physics will lead us next, in search for data quantification, results interpretation, development of new analytical tools, and ultimately integration of findings from different disciplines to understand links between fluctuation phenomena and common underlying physics that govern their evolution [2]. In this paper I present a brief overview of problems of adaptation to climate change that can be of interest to statistical physicists and open these new study areas.
The paper is organized as follows: The next section provides examples of some of the newly developed (by other groups and also by our group at the University of Belgrade) or already existent methodological solutions that can be used to study climate phenomena. The following section presents three sectors where a range of possible applications of statistical physics developed to deal with climate adaptation can be utilized. The last section concludes the paper.
Methodological solutions
Attribution and detection, new statistical measures and novel understanding of global warming
The existence, nature and role of stochasticity in climatic variables have been as of now extensively studied. Present-day scaling techniques even originated in statistical hydrology [31,32], where it was demonstrated for the first time that there exists a power-law–type time dependence of statistical functions that were used to describe river discharges. This type of dependence seemed to be widespread in the dataset of world rivers available at the time [32,33] and was soon after extended to include the "long-run property" of other geophysical records [34], a phenomenon investigated to the present day.
This is how recent statistical physics studies of observational, derived and proxy regional and global temperature data showed the existence of strong natural long-range autocorrelations in land station records [35–38], in global temperature data gridded datasets [39,40], and in the reconstructed long time series of proxies for temperature variations [41,42]. In this way those studies re-introduced the notion of long-range temporal order or long-term persistence (LTP) into the modern climate science assessments. This immediately opened a methodological question of how this new statistics can relate to the detection —"the process of demonstrating that climate or a system affected by climate has changed in some defined statistical sense" [43]— and attribution —"the process of evaluating the relative contributions of multiple causal factors to a change or event with an assignment of statistical confidence" [43]— which are central problems connected to the physics of climate change [44]. Namely, the estimations of significance of trends in global or regional warming that stem from currently dominant statistics which assumes that the underlying fluctuation order is of the short-term type are different from those for the assumed underlying long-range temporal order.
To help clear this out, Lennartz and Bunde [45–47] derived an analytical formula for the probability estimate of significance of anthropogenic trends in long-range autocorrelated data. Using second-order detrended fluctuation analysis (DFA, DFA2) they calculated the probability that in a Gaussian distributed record of length L, characterized by a scaling exponent α, an increase of size Δ occurs inside of a 95% confidence interval [46]. DFA is a modified variant of fluctuation analysis in which a fluctuation function F(n) is calculated as a root mean square variation about the "local trend", a polynomial fit calculated on data segments of window size n [9,10]. As it was developed from one-dimensional random walk theories [48], DFA analyzes a series of "net displacement" profiles  ,
,  , rather than the original data series xi
. The order of subtracted polynomial defines the order of DFA (DFAm); in DFAm trends of order m –1 are considered as eliminated from the original record [9,10]. For LTP data, due to the inherent power-law data dynamics, F(n) appears as
, rather than the original data series xi
. The order of subtracted polynomial defines the order of DFA (DFAm); in DFAm trends of order m –1 are considered as eliminated from the original record [9,10]. For LTP data, due to the inherent power-law data dynamics, F(n) appears as  , with
  for stationary series [9]. The method proved to be more stable than the conventional autocorrelation (ACF) or Fourier power spectra (PwS) analyses, with less pronounced finite-size effects [49]. The fact that it eliminates linear trends in the data made DFA2 an ideal tool for analyzing climate records, since linear regressions are standardly used as initial tests for trends in climate sciences [50].
From their analytical probability expressions Lennartz and Bunde numerically estimated boundary values of dimensionless relative trends, defined as  , where
  is a standard deviation around a linear trend in a time series of size L:
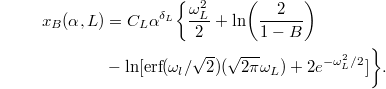
Here [46]  ,
,  ,
,  , B is a statistical confidence limit (conventionally
  ), while
  is the error function. Values of xB
increase with α by a power law and depend on L logarithmically.
is the error function. Values of xB
increase with α by a power law and depend on L logarithmically.
If larger than boundary value xB
, a trend is significant for it cannot be considered to arise from natural long-range variability of records. Lennartz and Bunde [46] provided their calculations of  for
for  (with a step
  ) and
) and  (with a step
  ; for monthly temperature data L = 500 corresponds to a time series length of approximately 42 years and L = 2500 of 208 years). Tamazian et al. [51] later provided a proof that these results hold for both Gaussian and highly skewed non-Gaussian data.
The estimates for significance of trends in temperature data developed by Lennartz and Bunde were to date used to re-calculate significance of warming from derived global temperature data [46] that showed that while global warming over land is significant also in a long-range statistics, the warming over sea is not. Other researches looked into trends of the observed land stations' records from Antarctica [38,52–54] and corrected significance of temperature increase, estimates of the uncertainty of sea level rise and significance of seasonal warming and cooling over the continent. Finally, this trend significance estimation method was used on other (than temperature) climatic variables, such as river discharges and precipitation records [46], or sea level data [55].
Cyclic trends, analysis of local scaling
Fluctuation functions calculated with detrending methods for scaling analysis are rarely ideal linear functions on log-log graphs of their (time) scale dependence for observed, derived or proxy temperature data. This is often the case for other climatic variables too, and in other complex systems. Instead, DFA functions very frequently exhibit existence of transient crossovers in their behaviour, signs of trends that arise as effects of periodic or aperiodic cycles [14]. These can be studied in more detail with the use of wavelet transform spectral analysis (WTS) or equivalents to WTS that are derived from DFA [56].
The wavelet transform (WT) method was introduced to expand the limits of Fourier analysis [57] and achieve better signal localization in time and frequency. It performs a two-dimensional time/space and scale decomposition with a basis of functions constructed by expanding by scale and translating along time/space of a specifically chosen original wavelet function [58]. This allows for visualisation of local temporal/spatial components of analysed records [58]. Mean wavelet power spectra EW
(n) (WTS), wavelet energy density functions, are mathematically comparable [59] to Fourier power spectra. For LTP data both WTS and PwS are of the power-law type, with the same power-law exponent β that can be related to the DFA exponent α through the scaling relation  [60]. In fig. 1 an example of DFA2 and WTS functions for the derived global temperature data from the UK Meteorological Office HadCRUT4 database [61] is given, together with its local wavelet spectrum.

Fig. 1: Top: results of the WTS (short-dashed dark grey line) and DFA2 (solid dark grey line) analysis of the time series of global average temperature anomalies of the HadCRUT4 data. WTS and DFA2 are depicted in the form EW
(n) (WTS) and  (DFA2), to allow for visual comparability between the two methods. Bottom: local WTS spectrum of the HadCRUT4 global temperature series. Horizontal lines indicate locations of significant WTS peaks, as identified in the upper panel; those serve as visual guides to explore peak features. It is visible that not all cycles are periodic. This is particularly prominent for the 110 months peak that may arise from significant singular events such as volcanic eruptions [40].
Download figure:
Standard imageWe recently developed a technique to cluster or differentiate climatic records based on the presence and influence of cycles in data [62]. It was shown across complex systems that when cycles (or signs of cycles) appear in statistical functions (WTS or DFA), those are always positioned at same or similar time scales [40,62,63]; this stems from the commonality of external influences in complex systems. We used this universal feature to define a space of p-vectors  that represent record ts in any kind of dataset from any complex system. Vectors
  are populated by scaling exponents α calculated on subsets of time scale windows that bound cyclic peaks in WTS of a time series ts, by way of use of the time-dependent centered detrended moving average algorithm (tdDMA; [22,64,65]). DMA is a DFA modification where running averages are used for detrending instead of polynomial fits [13]. The length p of
  depends on the number of WTS peaks in that complex system. Since scaling exponents α are frequently also called Hurst exponents [49], we dubbed our space of
  vectors Hurst space, and our derived clustering method the Hurst space analysis (HSA). Along with representation of time series with p-vectors we included one other practical solution into HSA: in order to be able to quantify any time series ts with a single number, we decided to project its relative unit vectors
  (with
(with  ) onto a unit vector
  of an assigned preferred direction in the Hurst space. The definition of the "preferred" direction depends on the characteristic behaviour one wants to investigate with HSA —projection of unit vectors
  of any record ts with a "preferred" behaviour onto the unit vector
  will then always be positive [62].
The HSA procedure can serve to differentiate and classify records within any datasets of randomly selected time series of any climatic variable, based on their stochastic, that is WTS and tdDMA behaviour only. We just used the method on a dataset of records of observed temperature data from land stations from different climatically and topologically homogeneous regions [66]. A graphical presentation of our findings is given in fig. 2. We were able to cluster these records according to the "preferred" characteristic that those do not "belong to the ocean", and to further extend HSA constructed from our dataset to group teleconnection indices that may influence their dynamics. In this way our results suggested that there probably exists a necessity to examine cycles in climate records as important elements of natural variability [67].

Fig. 2: Hurst space represented by p-vectors in two coordinate systems: in the general Hurst space, defined by the vector  and the "preferred" Hurst space (depicted by blue and red lines, respectively). The unit vector
  is directed to a portion of the Hurst space where presumably continental influences dominate the scaling behaviour. Vertical planes mark behavioural division (clustering) lines along the e-axis.
Download figure:
Standard imageSuperposition of noises
One of the goals of data analysis in the interdisciplinary efforts to develop strategies for adaptation to anthropogenic climate change is to disaggregate and study the influence of physical climatic parameters on physical and non-physical, mostly health or socio-economic data. Complexities that characterize datasets from health and societal sectors arise from constant interactions of (bio)physical and social complex systems [68]. Records of their variability may thus be mixtures of independent signals, or may contain trends that arise from the intrinsic dynamics of the system that are correlated with the fluctuations generated by the system [14].
While studying effects of trends on DFA for artificially generated time series, Hu et al. [14] derived a superposition rule for DFA that states that if any two independent signals xi
and yi
of any kind (and thus of any corresponding value of  and
and  ) are combined, the detrended fluctuation functions of their combination equals
  , where Fx
and Fy
are DFA functions of xi
and yi
, respectively. This methodological solution can be applied to studies that seek to understand mixed climate- or environment-related signals.
, where Fx
and Fy
are DFA functions of xi
and yi
, respectively. This methodological solution can be applied to studies that seek to understand mixed climate- or environment-related signals.
Applications
Public health
Exposure to certain meteorological conditions and air pollution has significant impact on human health that can result in deaths or increased hospital admissions and ambulance callouts for groups of climate- or environment-related illnesses [69,70]. Modern public health interventions require several weeks to several months to appropriately prepare for effects of climate or environment [68]. A strong motivation for statistical physicists to step into this arena may come from the necessity to understand and quantify these physical causes of temporal variations of disease incidence in various health datasets, to enable modelling of their complex health risks.
Our current work includes statistical analysis of time series of daily admissions from two large public hospitals in Limpopo Province in South Africa, in relation to time series of temperature, rainfall and air quality ground records or satellite data from the same geographical area [71]. We used wavelet cross-correlation analysis to monitor coincidences in changes of meteorological (temperature and rainfall) and air quality (concentrations of PM2.5 and NO2) variables with admissions to hospitals for a number of diseases. We found preconditioning [72] of incidences of respiratory diseases by changes in air quality and showed that malaria in South Africa is a multivariate event, initiated by a specific combination of weather conditions. We were able to provide new (other than already known seasonal variations) statistical estimates of time delays between the change of weather or air pollution and hospital admissions for these diseases. Our work can be further extended to serve as a database for future models of hospital admissions that combine future climate projections and obtained relations of climate with disease development [73].
In another set of our public-health–related studies we analysed time series of personal solar ultraviolet radiation (pUVR) exposure, datasets important to identify populations at risk of excess or insufficient exposure, given the health risks and benefits of the time spent in the sun [74,75]. Our data were collected by a number of individuals, mostly citizen scientists, in five countries on three continents, who were wearing recently developed personal electronic UV dosimeter devices [76] during their normal days. We used DFA2 and WTS to characterize pUVR time series; this quantification enabled us to identify similarities of exposure patterns in different groups of activities (such as outdoor work, sport, or tourism and leisure), and to differentiate between sun exposures with similar cumulative properties [74]. This was the first study that showed that DFA and WTS are valuable tools to apply in the investigation of pUVR measurements.
In our pUVR studies we furthermore assumed that recorded pUVR signals are results of a superposition of the outside solar ultraviolet radiation (UVR) and personal patterns of behaviour under the sun. We thus used the DFA superposition rule to separate and investigate individual patterns of behaviour from pUVR data [75]. We showed that the pUVR scaling on lower time scales is completely determined by personal patterns of exposure and that this dominance ends at the range of time scales equivalent to either the maximal duration of repeated exposure to the sun, or to the longest duration of singular continuous exposure during the day. We were able to provide that measure (duration of the longest continual exposure), demonstrating how the DFA superposition rule can be used to quantify behavioural patterns, particularly accurate if it is determined on WTS curves. Our results can be further used to fine tune safe sun exposure public health campaigns as well as parameter inputs for personal sun prediction modelling tools [75].
Infrastructure
Critical infrastructure of interest for the adaptation to climate change includes all systems that provide basic services to societies, such as the energy, water, food, transport and security [68]. These can drastically change with climate and undergo or cause damage and risks to society.
In an example of an effort to address one of such issues and advance civil structure health monitoring Livina et al. [77] used the tipping point analysis to study data recorded at the UK National Physical Laboratory (NPL) Teddington footbridge. This structure serves as a testing ground for assessing structural monitoring sensors in a regular bridge-crossing regime and under various structure-stressing experiments [77]. In Livina et al. [77], sensory data at the footbridge were collected for over a decade. Tipping point analysis is an established methodology with a generalized approach to dynamical systems studies, which can be applied to any sort of complex records [77]. It utilizes DFA, along with the use of conventional ACF, as a tool for detection of transitions in the system behaviour that serve as early warning signs of critical changes or bifurcations in time series. The use of DFA and ACF constitutes the first —anticipated or pre-tipping— stage of the tipping point analysis, when early signs may allow for adequate reactions that can effectively address the problem at hand [78].
The application of the tipping point analysis to sensory data from the NPL footbridge allowed for clear identification of major damage experiments (events) and their locations, and for estimation of their criticality [77]. It furthermore demonstrated the importance of environmental conditions for the nature of structural monitoring findings; the results of the analysis showed that unusual weather conditions could lead to unexpected thermal loading of the structure and therefore different structural behaviour. This leads to the suggestion that a full description of the environment around a large structure is required to correctly characterise and include thermal loading or other environmental effects [77] into the infrastructure risk assessments.
Infrastructure can cause the change of climate as well, therefore it is also critical for climate mitigation efforts. In that respect Livina et al. [78,79] recently used the tipping point analysis to provide for early warning signs of non-linear decrease of atmospheric oxygen that is caused by a previously unaccounted sink that serves multiple industries. They applied tipping point analysis to nine observational oxygen concentration records around the globe, studied their dynamics and performed forecasts under possible future scenarios leading to oxygen deficiency in the atmosphere. For the modelling part of their work they used the framework of statistical physics to account for the stochastic component of oxygen changes [78]. They additionally included the effects of rising technologies that may lead to mass production of new vehicles causing double sink of atmospheric oxygen —due to combustion and also due to synthesis of intermediate materials [78]— into their modelling efforts. Their results lead to the conclusion that "if some new mass technologies with oxygen sink would be adopted by the world consumers (in addition to the industrial combustion processes), this may drastically increase oxygen deficiency, eventually leading to critical misbalance of the atmosphere", suggesting that "all industries introducing new technologies with air consumption should be assessed with respect to oxygen consumption before they are deployed at full scale".
Cultural heritage
Cultural heritage (CH) assets that are located outdoors are constantly exposed to changing weather and reactive compounds in the air [80]. Change of outdoor conditions can dramatically influence their state by endangering their location or interacting with the materials they are made of. Similar risks apply for the buried archaeological items as well, irrespective of whether those are covered by soil or water [80]. In order to mitigate this problem, a variety of protective coatings are developed for preserving the integrity of the CH items and slowing down their degradation process [80].
Artesani et al. [80] provided the most recent overview of the advances for protective coating for CH, a systematic survey of novel, mostly green and sustainable coatings developed by the CH community to overcome problems of irreversible, sometimes toxic protectives that were used to date. These solutions are presented according to the type of surface they were developed to protect: metallic objects, glass, or limestone [80]. Novel coatings, unlike the conventional ones, firstly need to be rigorously tested against different outside conditions, and in relation to their specific function in CH intervention. In that regard Artesani et al. proposed a generalized protocol for the introduction of protective coatings in conservative applications. It includes: 1) evaluation of the surface deterioration and definition of the conservation status of the object and creation of the corresponding artificial specimens, 2) tests of new coating products on artificial objects that include corrosion and ageing experiments and 3) validation of coating durability and removability, before 4) the decision is made on the safety of their applicability on the object [80].
Methods and approaches of statistical physics can be applied to assist all the stages of such a proposed process. Corrosion outcomes are studied mainly by electrochemical techniques that give information about the resistance of the coating, out of which its protectiveness properties are estimated [80]. Differential thermal analysis is customarily applied to determine degradation products of the coating [80]. Both of these techniques can result in time series outputs, which can be analysed with detrending methods for data analysis (or any other data analysis method), providing for their effective characterization and robust differentiation. Finally, multifractal DFA or other multifractal analysis techniques can be utilized to assess both the surface deterioration and micro-roughness and durability of the coating. This would provide for completely new, much needed information for the preservation of cultural heritage sites.
Concluding remarks
This paper provides a mini review of the interesting physics that arises from the use of detrending methods for time series analysis for the study of phenomena related to problems of adaptation to climate change. Even in this narrow range of analysis techniques a potential for future applications is very broad. Methodologically, the trend significance estimates for long-range correlated data can be applied in the future to global gridded temperature datasets, to provide better insights into the significance of global warming. HSA or similar methods may be systematically utilized to characterize and classify climate records by nature and sources of their cyclic dynamics. Applications of DFA superposition or any similar or derivative rules for separation, quantification and understanding of climatic and environmental causes in health and socio-economic variables can be further explored.
In general, applications of statistical physics to understand physics of climate change or assist climate adaptation efforts have an additional (to their vast research potential) appeal, particularly to the statistical physics community that standardly works in interdisciplinary areas; those can bring together researchers, practitioners and communities with discrete expertise, in order to better understand climate change and its impacts. Focuses of these researches can be different and can include any critical issue that climate change threatens to seriously exacerbate. In this paper I focused on the the data-led understandings of wider value to the scientific community and applicable local-scale insights that statistical physics can offer in this context. To add model-led contributions, statistical physics of climate change needs yet to offer an effective model that can capture long-range interactions between a large number of interacting parts that would add to understanding of long-term persistence that is an output from various climate systems, and possibly even include emergence of cycles in statistical functions of climate data.
Acknowledgments
This paper is written in loving memory of Prof. Sava Milošević. My work is financed by the Serbian Science Fund grant No. 451-03-68/2020-14/200015. Thank you to two anonymous reviewers for stimulating comments that only improved this work.
Footnotes
- (a)
Contribution to the Focus Issue Progress on Statistical Physics and Complexity edited by Roberta Citro, Giorgio Kaniadakis, Claudio Guarcello, Antonio Maria Scarfone and Davide Valenti.