


Abstract
It is well known that the outbreak of infectious diseases is affected by the diffusion of the infected. However, the diffusion network is seldom considered in the network-organized SIR model. In this work, we investigate the effect of the maximum eigenvalue on Turing instability and show the role of network parameters (the network connection rate, the network's infection, etc.) on the outbreak of infectious diseases. Meanwhile, stability of network-organized SIR is given by using the maximum eigenvalue of the network matrix which is proportional to the network connection rate and the networks infection rate. The bridge between the two rates and Turing instability was also revealed which can explain the spread mechanism of infectious diseases. In the end, some measures to mitigate the spread of infectious diseases are proposed and the feasible strategies for prevention and control can be provided in our paper, the data from COVID-19 validated the above results.
Export citation and abstract BibTeX RIS
Introduction
After COVID-19 was first reported in December 2019, some researchers investigated the early transmission dynamics and its assessment through data-driven models [1,2]. However, the available data is often incomplete or insufficient in such a short interval. Therefore, the mathematical model is an important tool for analyzing the spread and prevention of epidemic and pandemic diseases [3–8] through bifurcation [9,10]. Stolerman et al. tried to deal with the propagation of disease epidemics in highly populated cities through the SIR-network model [11]. Dottori and Fabricius investigated the quasi-stationary state of a SIR model on a dynamical network and found rescaling the rate of infective contacts of the model could absorb network effects partially [12]. And the propagation of SIR disease on random networks with spatial structure was studied, which provided a theoretical modeling framework for disease propagation [13]. Then Ball et al. investigated a stochastic SIR network epidemic model with the preventive dropping of edges to show the importance of the connection between nodes [14]. Although the diffusion network was treated as an important factor of infectious diseases [15,16], the diffusion network's role in the distribution of the infected was seldom investigated, especially in the SIR model with the random network [17,18]. Therefore, spatial considerations have been included in this study.
Since the Turing pattern was first proposed in 1952 [19], many researches about pattern formation [20–22] were carried out to explain some biological mechanisms. It was found that cellular networks also played a vital role in the Turing instability, and some extensive networks were proposed as well [23–25]. Recently, some theoretical research methods of the network-organized Turing pattern about the un-directed and directed network were provided, which laid the basis for the study of network-organized pattern dynamics [26–29]. The subsequent research showed key features (like stability, pattern formation) of Turing systems are determined purely by the network topology in the network-organized system [30–32]. However, the pattern dynamics of the SIR model with the diffusion network was never investigated.
It is well known that human relations in society can be treated as an extensive network, the epidemic can spread along with the network when infectious diseases occur. In general, the spreading along the network could induce the outbreak of infectious diseases, especially COVID-19. However, the diffusion (network) does not work in the stability of the reaction-diffusion SIR system. Namely, traditional diffusion no longer explains the spread of infectious diseases in the SIR model. Therefore, some dynamics mechanisms and biological mechanisms should be proposed to investigate the epidemic's diffusive behavior. To understand the dynamical and biological mechanism of the outbreak of infectious diseases and explore the practical measures, we will investigate the dynamic behavior of a modified SIR model and the effect of the random network on the distribution of infectious diseases. We first propose a modified SIR model based on the characteristic of infectious diseases, analyze why the outbreak of infectious diseases occurs, and show the importance of the strategies. Furthermore, we construct a network-organized SIR model, show the connection probability and the infection rate of network that play an essential role in the Turing instability. Also, we find the maximum of the network matrix's eigenvalues, which is proportional to the connection probability and the infection rate of the network, affects the Turing system's stability directly. The Turing instability is important due to spatial consideration, which is specifically important in the outbreak of infectious diseases. Finally, the evolution of the infected cases of the COVID-19 epidemic is analyzed.
Model of the modified SIR system
It is well known that the death rate of infectious diseases for S (susceptible individuals), I (infectious individuals), R (removed or recovery individuals) is different [33]. Meanwhile, the infection rate of those diagnosed with infectious diseases is also different from the participant infection rate (i.e., that could infect others), because most of the infected can be isolated. Nevertheless, the incubation of the infectious diseases is difficult to check, and it is infective when it is in the incubation stage, so the amount of the participant infection is different from the final diagnosis. Due to the characteristic of infectious diseases and the existing SIR model [5], a modified SIR model can be written as
where  is the death rate of S, I,R, and
  generally holds because the natural mortality rate is relatively low and the mortality rate of those infected is relatively high;
  is the infection rate (including both isolated and un-isolated infected individuals),
  is the infection rate of the participant infection (including the incubation and the un-isolated infected individuals) next,
  infectious individuals may be isolated or hospitalized, who cannot infect the others next, namely only the infected who could make a difference to the outbreak of infectious diseases are considered; δ is the recovery rate.
There are two equilibrium points  :
:  and
and  making the right-hand side of system (2) equal to zero. In general, the equilibrium point E1 means the infectious diseases disappears, and the equilibrium point E2 means the outbreak of infectious diseases. Then, we analyze the stability of E1, E2 through linear stability analysis. The characteristic values are the solution of the characteristic equation, the system is stable when all the eigenvalues are negative and the system is unstable when a positive eigenvalue exists. The characteristic equation can be expressed as
  , where A is the Jacobian matrix and the linear part of system (2)
The characteristic equation for E1 is  and the characteristic equation for E2 is
  . There are two states for the epidemic in this paper, the outbreak of infectious diseases, and eventually, disappearance with time. According to the characteristic value of E1, E2, E1 is stable when
  , E2 is stable when
  . It is well known that the infectious diseases can be effectively controlled when the equilibrium E1 of system (2) is stable and the infectious diseases will spread far and wide when the equilibrium E2 is stable. In this paper, the default parameters of our simulations are
  and initial value (1, 1,1). E1 will tend to be stable (the infectious diseases disappear) for lower birth rate, and E2 is stable (outbreak of infectious diseases) when α becomes larger (fig. 1(a)). We are more concerned about the death rate
  of the infected people. Although the higher death rate can induce the disappearance of infectious diseases (fig. 1(b)), it is an unacceptable way to prevent contagious diseases. The theoretical results show that
  does not affect the stability of the equilibrium E1. If we decrease the infection rate of the participant infection (i.e.,
  ) from 0.1 to 0.01, the outbreak disappears (fig. 1(c)). Moreover, the outbreak of infectious diseases may occur when the incubation time is large because the incubation of infectious diseases could infect others. Therefore testing the incubation of people on a large scale and the isolation of the infected are important strategies for the prevention of the infection, especially in some places where the number of infected grows exponentially (fig. 1(c)). For the recovery rate δ of the infected, the lower recovery rate is not good for the prevention of infection (fig. 1(d)). The 10 fold increase of the recovery rate
  (i.e., from 0.1 to 1.0) could make the infectious diseases disappear quickly (fig. 1(d)). We notice that the recovery rate is a vital factor to prevent the outbreak (fig. 1(d)). The higher recovery rate (including self-cure) could also lead to the generation of herd immunity, which enhances the immune system of the recovered against the infectious diseases. It is also explained that the vaccine and isolation strategies are an effective measure to take control of the spread of infectious diseases. Although high-efficacy drugs are challenging to obtain for this current epidemic, it is crucial to deal with future epidemic. From fig. 1, we know only the endemic disease or the disappearance of infectious diseases happens in the general SIR model. Still, we cannot explain the secondary outbreak of infectious diseases in the social network. Therefore, we investigate the network-organized SIR system in the following.

Fig. 1: The stability and bifurcation of system (2). (a) The bifurcation about α. (b) The bifurcation about  . (c) The bifurcation about
  . (d) The bifurcation about δ.
Download figure:
Standard imageModel of the network-organized SIR system
In fact, traditional diffusion no longer explains the spread of infectious diseases in the SIR model. Therefore, we try to transfer eq. (2) into the network scheme. And we combine the dynamics of the SIR model and the infection network to investigate the infection's dynamical behavior. For the random network [28], we can transfer it into a symmetric matrix A1. First, a null matrix A1 is given; then if node i and j connect in a loop,  are assigned. Finally, we repeat the above process till a symmetric matrix A1 is obtained. Suppose ri
is the i-th row sum (degree) of A1, and
are assigned. Finally, we repeat the above process till a symmetric matrix A1 is obtained. Suppose ri
is the i-th row sum (degree) of A1, and  (the degree) is a Laplacian matrix (the elements of the main diagonal represent the spreading rate of the network through diffusion and the other non-zero element is the infection rate by the receipt of diffusion). We treat matrix A2 as a diffusion matrix. Meanwhile, the number of the infected is invariable (all row sums are zero). Finally, assume
  and q is the infection rate through the network (we know that the amount of susceptibility, infection, and recovery varies in the infectious process, we redefine the ratio of the spreading rate and the receipt in the diffusive matrix). Meanwhile, q can be treated as the perturbation of the social network. Here the social distance p is different from the isolation in this paper. Although the social distance may decrease the infection rate, it could infect some people, and it may not even work for a highly contagious disease q. The isolation here means there is no contact.
In general, the number of the infected will increase by diffusion. After this consideration, system (2) (suppose the infected are not isolated and move freely in the 1st place) on the network can be written as
where  , only the infected in the first city (or place) affect others and
  ,
,  are the k-th eigenvalue of Δ and the corresponding eigenvector, respectively. Substituting
  into the linear part of system (2) [26], we obtain the Jacobian matrix of system (2), the characteristic equation
  at E1; and Turing instability occurs when
  or
or  holds. The characteristic equation for E2 is
  , and
, and  ,
,  . The corresponding characteristic values are
  . And the Turing instability occurs when
  holds [26,34].
Here we assume  . If A is a Laplacian matrix
  , the corresponding eigenvalues are
  . It is easy to know that system (2) is stable at E1 because
  when system (2) is stable. For E2,
  always holds because ak
> 0, bk
> 0 is true for
always holds because ak
> 0, bk
> 0 is true for  . Namely, the diffusive network could not induce outbreak of infectious diseases, which is not consistent with the actual situation. Therefore, A is considered in this paper, which can be treated as the perturbation of the Laplacian matrix.
From the above analysis, we know that the eigenvalues of the network matrix play an important role in the stability of the network-organized system (2), especially the maximum eigenvalue. So the stability of system (2) depends on
Namely Turing instability occurs when  or
or  holds. And the stability of system (3) with i = 1 can be determined by the following system:
where  is the maximum of
  , and it is the reduced system for a network-organized system.
Although the network matrix is generated randomly with p, the range of its eigenvalues can be estimated. Based on the Gershgorin circle theorem [35], the eigenvalue  and
and  . So system (4) is approximate to the following system:

where g is uncertain and related to A. And the system is unstable when  , otherwise, it is stable.
According to the above analysis, we have the following. Theorem 1. In the network-organized system (2), the Turing instability occurs for the equilibrium E1 when  or
or  holds. The turing instability occurs for the equilibrium E2 when
  holds. Meanwhile, the stability of system (2) is determined by system (5).
Proof. Please refer to the stability analysis of system (2) and system (5).
It is well known that the social network and trans-regional diffusion of infectious diseases can induce the increase of the infected, even global outbreak. In contrast, the infectious diseases will approach to zero when the social network and trans-regional diffusion is small (figs. 2–8). In our simulation, system (2) is stable when all Ii
tend to zero, and system (2) is unstable (Turing instability) when Ii
does not approach zero [ ]. Here
  are set. For example, we can make the infected of infectious diseases gradually disappear by decreasing the susceptible rate
  and the social contacts
  when the social contacts exist in the system (fig. 2(a) shows that the pattern formation is stable). The excessive contacts
  of the infected lead to more infected (fig. 2(b)) and show the occurrence of Turing instability. Although the higher death rate of the infected could cut off the resource of the infection
  , and make the infected approach to zero (fig. 2(c)). Surprisingly, even if the death rate
  is high, but through human exposures
  the infectious diseases spread rapidly, which lead to more deaths eventually (fig. 2(d)). Meanwhile, so is the death rate of the susceptible (fig. 3(a), (b)). In ancient times, maybe increasing the death rate was a way to prevent the spread of infection diseases because of medical constraints and poor transportation. However, human civilisation is now advanced with better technological innovations. Isolation can effectively prevent the spread of the disease (fig. 3(c)). However, just a few infected cause an infection in the whole community through social contact (fig. 3(d)). Therefore, isolation and the decrease of social contacts are necessary to stop the spread of infectious diseases. Moreover, increasing the recovery (self-cure) rate is the best way to prevent the spread of infectious diseases (fig. 4(a)). This is not easy to achieve due to the development of a vaccine. The other option is to live with infectious diseases. If no symptoms or mild symptoms for most of the infected exist, or most of the infected can recover quickly by the treatment, eventually almost all the people live with infectious diseases (fig. 4(b)). So the herd immunity also depends on a strong health care system. In addition, fig. 4(c), (d) and fig. 5 show the variation of the equilibrium about p. The equilibrium gradually becomes non-zero with the variation of p (fig. 4(c), (d)) when we stabilize system (1) through the isolation
  and the susceptible rate α. Figure 5 shows that the strategy of increasing the recovery has a better resistance for the spread of infectious diseases. By comparing (fig. 4(c), (d)) and (fig. 5), we know the strategy of increasing the recovery of the infected is better than the isolation and the decrease of the susceptible rate. Because the increase of p means the isolation is not enough, and the susceptible rate increases. Now we consider the infection rate q of the network under the stable circumstances about p. As we all know, the system is stable when the infection rate q = 0.02 of the network is small (fig. 2(a), (c), fig. 3(a), (c), fig. 4(a)). Figures 6 and 7(a) show the Turing instability induced by q, namely the Turing instability occurs when the infection rate of the network becomes larger (fig. 6 and fig. 7(a)). But the condition that the strategy of increasing the death rate stabilizes system (2) (fig. 6(b), (c)) is worse than other ways (fig. 6(a), (d), fig. 7(a)). Namely, the infection rate q of the network also plays an important role in system (2). Also, although the same initial conditions are set, the dynamical behavior (fig. 6(d)) is different because the topology varies. Then we obtain the bifurcation of Ii
about p, q (fig. 7(b)–(d) show the distribution of Ii
about q). From the numerical results, we know the isolation strategy (fig. 7(c)) is better at preventing the network diffusion of infection diseases. Although increasing the recovery rate (fig. 7(b)) and reducing the susceptible rate (fig. 7(d)) is efficient at the beginning, the infected will increase rapidly when the infection rate of the network becomes large (fig. 7(b), (d)). In addition, it is found that p, q are proportional to
and the susceptible rate α. Figure 5 shows that the strategy of increasing the recovery has a better resistance for the spread of infectious diseases. By comparing (fig. 4(c), (d)) and (fig. 5), we know the strategy of increasing the recovery of the infected is better than the isolation and the decrease of the susceptible rate. Because the increase of p means the isolation is not enough, and the susceptible rate increases. Now we consider the infection rate q of the network under the stable circumstances about p. As we all know, the system is stable when the infection rate q = 0.02 of the network is small (fig. 2(a), (c), fig. 3(a), (c), fig. 4(a)). Figures 6 and 7(a) show the Turing instability induced by q, namely the Turing instability occurs when the infection rate of the network becomes larger (fig. 6 and fig. 7(a)). But the condition that the strategy of increasing the death rate stabilizes system (2) (fig. 6(b), (c)) is worse than other ways (fig. 6(a), (d), fig. 7(a)). Namely, the infection rate q of the network also plays an important role in system (2). Also, although the same initial conditions are set, the dynamical behavior (fig. 6(d)) is different because the topology varies. Then we obtain the bifurcation of Ii
about p, q (fig. 7(b)–(d) show the distribution of Ii
about q). From the numerical results, we know the isolation strategy (fig. 7(c)) is better at preventing the network diffusion of infection diseases. Although increasing the recovery rate (fig. 7(b)) and reducing the susceptible rate (fig. 7(d)) is efficient at the beginning, the infected will increase rapidly when the infection rate of the network becomes large (fig. 7(b), (d)). In addition, it is found that p, q are proportional to  (fig. 8). And it approaches the linearity relationship between
  and p, q (fig. 8(a), (b)). In other words, the magnitude of p, q affects the stability of system (4). Meanwhile, the similar distribution (fig. 8(c), (d)) of
  and Npq shows
  holds.
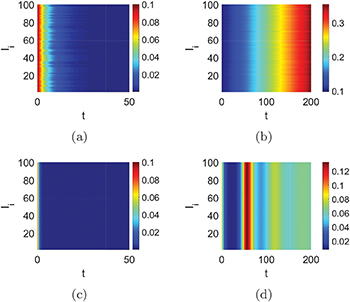
Fig. 2: The stability of system (2) about p when q = 0.02. (a) The system is stable when  . (b) Turing instability occurs when
  . (c) The system is stable when
  . (d) Turing instability occurs when
  .
.
Download figure:
Standard image
Fig. 3: The stability of system (2) about p when q = 0.02. (a) The system is stable when  . (b) Turing instability occurs when
  . (c) The system is stable when
  . (d) Turing instability occurs when
  .
.
Download figure:
Standard image
Fig. 4: The stability of system (2) about p when q = 0.02. (a) The system is stable when  . (b) Turing instability occurs when
  . (c) The bifurcation about p when
  . (d) The bifurcation about p when
  .
.
Download figure:
Standard image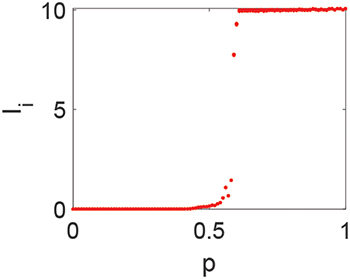
Fig. 5: The bifurcation about p when  and q = 0.02.
Download figure:
Standard image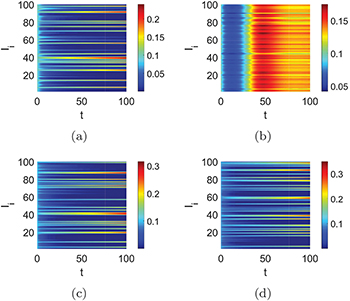
Fig. 6: The stability of system (2) about q. (a) Turing instability occurs when  . (b) Turing instability occurs when
  . (c) Turing instability occurs when
  . (d) Turing instability occurs when
  .
.
Download figure:
Standard image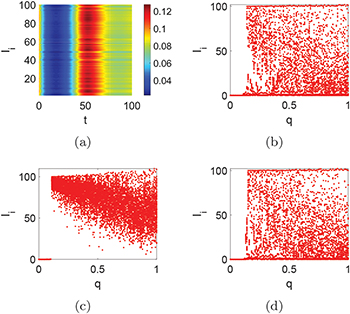
Fig. 7: The stability of system (2) about q. (a) Turing instability occurs when  . (b) The bifurcation about q when
  . (c) The bifurcation about q when
  . (d) The bifurcation about q when
  .
.
Download figure:
Standard image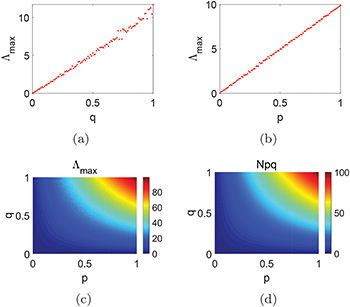
Fig. 8: The relationship of  and p, q. (a) The relationship of
  and q when p = 0.1. (b) The relationship of
  and p when q = 0.1. (c) The distribution of
  about p and q. (d) The distribution of Npq about p and q.
Download figure:
Standard imageThe distribution of  and Npq about p,q also verifies that system (4) and system (5) are approximately equal (fig. 8). Also, the stability of system (4) is consistent with the stability of system (2) (fig. 9). Such as fig. 3(c), (d) and 7(d) correspond to fig. 9(a), (b), (c), respectively, which hare the same stability between system (4) and system (2). Meanwhile the bifurcation about
  agrees with the condition of the Turing instability of system (4) (fig. 9(d)). In summary, although the infected of one city are not isolated, this also could induce a secondary outbreak through the network. Finally, the evolution of the infected cases of the COVID-19 epidemic is analyzed. Because of external factors, the system will not approach an equilibrium point when the infected (freely) exist, and even a secondary outbreak occurs (fig. 10), which is consistent with our theoretical results (fig. 2–7]. From fig. 10, the infected cases increase at the beginning, and decrease when some measures are taken (figs. 2(a), (c), 3(a), (c), 4(a)). However, a secondary outbreak occurs because of the diffusion network (like the imported cases, the effect of other cities) (fig. 2(b), (d), fig. 3(b), (d), 4(b), 7(a)). The above analysis means the theoretical results are in agreement with some experimental results in the qualitative analysis. Different implementation measures have produced different results; namely, the topology is different (fig. 6). Finally, a general SIR model could show the outbreak or the disappearance of COVID-19 [36], but it is difficult to express the interaction between nodes (cities or countries) and the secondary epidemic. Generally speaking, the control of the network diffusion plays a vital role in the prevention of COVID-19. Also, although the same initial conditions are set, the dynamical behavior is different because the topology varies. Meanwhile, the topology is determined by the protection strategy of the nodes. Therefore, we could prevent the spread of COVID-19 through the connection between the nodes.
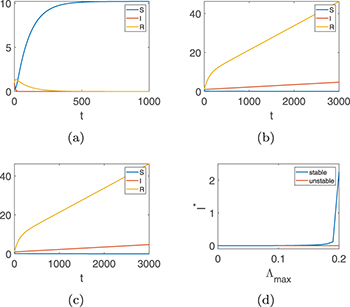
Fig. 9: The stability of system (4). (a) E1 is stable when  and
and  . (b) E1 is unstable when
  and
and  . (c) E1 is unstable when
  and
and  . (d) The bifurcation about
  .
.
Download figure:
Standard image
Fig. 10: The infected cases of the COVID-19 epidemic. (a) Switzerland from 2020.02.27 to 2020.8.20. (b) Austria from 2020.03.29 to 2020.8.20.
Download figure:
Standard imageConclusion
To explain the mechanism of the spread of infectious diseases, and to predict the effective strategy, a qualitative approach was applied to explain the outbreak of infectious diseases due to the characteristics of infectious diseases, and some measures were provided and turned out to be effective for the prevention of infectious diseases. In this paper, we first show the modified SIR model's stability under different conditions and analyze the feasibility of some measures for infectious diseases in the actual situation. It is found that the isolation measure is an important approach to reduce the infection rate: reducing the birth rate of the vulnerable by isolation and improving the rate of recovery by good health care systems could make the system stable (infectious diseases disappears), which shows that these are effective strategies. Then the effect of the random network on the distribution of infectious diseases is shown by the connection probability p and the network infection rate q, which overcomes the disadvantage that the network does not affect the dynamical behavior of infectious diseases in the network-organized SIR model. Meanwhile, social distancing, along with higher recovery rates and higher isolation, are effective measures because of the higher connection probability, which means lower social distancing, leading to the Turing instability. Also, the maximum of the network matrix's eigenvalues, which is proportional to the connection probability and the infection rate of the network, affects the stability of the Turing system directly. Above all, some measures and methods proposed may play a vital role in the outbreak of infectious diseases and Turing instability based on the theoretical analysis. In summary, although the infection of one city is not isolated, it could also induce a secondary outbreak through the network. Finally, the reduced system method for a network-organized system is proposed on the basis of Theorem 1, which is a novel approach to investigate the complex system.
It will be better to carry out the analysis based on the literature or estimates from accurate data. However, the SIR model is considered on the network, making the estimation and collection of accurate data more difficult. We only show the effect of the diffusion network on the epidemic by evolving the infected cases of the COVID-19 epidemic in Austria and Switzerland. And the network-organized system we proposed could describe the dynamical behavior of infectious diseases more accurately. Because the system's theoretical analysis holds for any parameters, the modified SIR model is valid for COVID-19. The validity of the model used in this paper and another data-based model is predicated on having accurate data. Therefore we may do some research about actual data, directed network, multilayer network, etc., in a subsequent study.
Acknowledgments
This work is supported by National Natural Science Foundation of China (11772291, 12002297), Program for Science & Technology Innovation Talents in Universities of Henan Province (22HASTIT018), Youth Talent Support Project of Henan (2020HYTP012), Basic research Project of Universities in Henan Province (21zx009).
Data availability statement: No new data were created or analysed in this study.