


Abstract
We use extensive Molecular Dynamics (MD) simulations to study the osmotically induced translocation of partially filled vesicles through narrow pores. The dependence of the average translocation time,  , on vesicle size M, pore radius Rp, and strength of the driving force,
  , is examined for vesicles in a broad interval of sizes M. The time
  is found to grow with decreasing pore size by an universal scaling law,
  , where
  denotes the critical pore radius when the vesicle gets stuck in the pore. With regard to applied pressure, P, we find a power law relationship,
  , where
  with Pcr being the least pressure that can still drive the vesicle through a pore of size Rp. The exponent ω varies with Rp and tends to unity as the pore size narrows,
  . In addition,
  is found to attain a minimum for an optimal value of the membrane bending rigidity. The variation of vesicle shape, surface area, volume and translocated fraction of the vesicle with time elapsed since the onset of the process is shown to change qualitatively with varying pore size.
Export citation and abstract BibTeX RIS
The passage of vesicles through a small pore induced by pressure difference or chemical reactions is relevant to biological processes, e.g., transendothelial migration in immune systems [1], transdermal applications [2], or drug delivery [3] in pharmacology. Owing to their flexible surface, lipid bilayer vesicles readily undergo shape deformations enabling them to move through confining tissue. The problem has gained ample attention by researchers and has been treated theoretically both analytically [4,5] within a statistical mechanical approach as well as by means of computer simulations of coarse-grained models [6,7]. Earlier studies have shown [7], that a realistic concentration gradient of osmotically active molecules is suffient to overcome the free energy barrier for liposome translocation. Under the approximations of constant volume and/or surface area of the vesicle as well as assuming sufficiently slow dynamics of the translocation process so that the existence of thermodynamic free energy barrier in equilibrium can be considered [4–9], these studies have provided important insights on the effectiveness of the translocation process for various governing parameters as the driving forces, initial size and elastic moduli of the vesicle as well as geometry and size of the pore. While Shoaei and Muthukumar [4] have considered the effect of various parameters on the translocation time by using the Fokker-Planck formalism to derive the free energy profile for vesicle translocation, the work of Khunpetch et al. [5] employed the Onsager variational principle which relies on the existence of slow variables during the translocation kinetics to study the free energy variation along the actual kinetic path. Yet a number of questions concerning the general dependence of the total translocation time  on the pore radius Rp
, the pressure difference
on the pore radius Rp
, the pressure difference  , or the elasticity of the membrane shell, in particular, in the absence of the volume and area conservation assumption, remain still open. In the present work we report on results based on comprehensive molecular dynamics (MD) computer experiments varying vesicles and pore sizes as well as the bending rigidity of the membrane surface in broad intervals.
We consider polymerized ("tethered") membranes of fixed connectivity comprised of cross-linked vertices as in the case of spectrin network of erythrocyte plasma membranes and of the lamina network of eukariotic nuclear envelopes [10]. The vesicle is modeled by a triangular network of M spherical vertices of diameter σ, fig. 1, and contains a dense gas of athermal beads with diameter σ at volume density  . Both vertices and fillers repel one another with a short-range repulsive Weeks-Chandler-Andersen (WCA) (i.e., truncated and shifted Lennard-Jones) type potential [11] between any pair of vertices at distance r,

choosing the potential strength  and putting the thermal energy kB
T to unity as well. The vertices are connected by flexible bonds, each being represented by the finitely extensible nonlinear elastic (FENE) potential [12]:
and putting the thermal energy kB
T to unity as well. The vertices are connected by flexible bonds, each being represented by the finitely extensible nonlinear elastic (FENE) potential [12]:

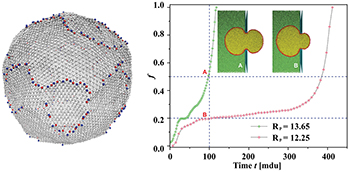
Fig. 1: Left: a snapshot of a free vesicle with M = 9800 vertices, bending rigidity ![$\kappa_{imp}=5\;[k_BT]$](https://content.cld.iop.org/journals/0295-5075/138/4/42001/revision3/epl22100128ieqn14.gif) , showing lines of typical Stone-Wales topological defects. Right: the variation of the translocated fraction f of membrane vertices with time t reveals a typical plateau and a swift exit at the end of the process for a narrow pore with
, showing lines of typical Stone-Wales topological defects. Right: the variation of the translocated fraction f of membrane vertices with time t reveals a typical plateau and a swift exit at the end of the process for a narrow pore with  . In contrast, for the larger pore with
  the passage is much faster. In both cases
 ![$\Delta P = 10\;[k_BT/\sigma^3]$](https://content.cld.iop.org/journals/0295-5075/138/4/42001/revision3/epl22100128ieqn17.gif) .
.
Download figure:
Standard imageThe constants are chosen as  . Note that eqs. (1), (2) together create a potential for the bond length
  with a sharp minimum at
  . The chosen interactions, eqs. (1), (2), and the values of the parameters
  and
and  ensure no leakage of fillers through holes in the membrane shell during the translocation process.
The membrane bending energy may be cast in the convenient form [13],

where  is the improper dihedral angle between the normals
  and
and  of each pair of adjacent triangles (i, j) sharing a common edge and the hat denotes a unit vector. Spontaneous spherical curvature of the vesicle is induced by the offset
  . As shown in fig. 2, there exists an optimal value of bending rigidity,
  , which ensures the fastest translocation process almost regardless of the pore diameter. Interestingly, for an optimally fast passage through the pore vesicle rigidity becomes less essential with growing membrane size M since for fixed
  larger shells deform more easily just like semiflexible polymer chains with contour length exceeding significantly their persistence length. The ruggedness of the stiff pore rim, on the other hand, leads to increased friction for too soft smaller membranes which need time to unhook from local bumps in the rim.
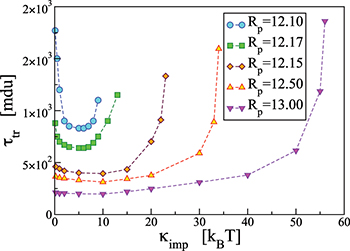
Fig. 2: Variation of the translocation time,  , measured from the moment the vesicle touches the pore entrance until it exits the orifice into the receiver compartment, with membrane bending rigidity,
  , for a membrane with M = 9800 vertices and several sizes of the pore, Rp
, as indicated. Apparently, for a given driving force protrusion through the pore is hampered for both too soft or too rigid vesicle shells whereby the optimal bending modulus increases slightly as the pores get wider.
, for a membrane with M = 9800 vertices and several sizes of the pore, Rp
, as indicated. Apparently, for a given driving force protrusion through the pore is hampered for both too soft or too rigid vesicle shells whereby the optimal bending modulus increases slightly as the pores get wider.
Download figure:
Standard imageThe parameter  may be related to the Young elastic modulus
  [13] and the bending rigidity
  [14] of the 2D surface material. Recently, Tortora and Jost [15] have demonstrated that these relationships hold remarkably well for triangulated membrane shells even in the presence of topological Stone-Wales 5/7-disclination defects, inevitable on curved surfaces.
We employ the Matlab S2-Sampling Toolbox [16] to generate a nearly uniform triangular tessellation of spheres with  vertices and mean gyration radii,
  , 17.58, 25.75, 36.82, 51.73, respectively.
The number of 5/7-defects, nSW
, is found to scale as  with the membrane size M so that, e.g., for M = 9800 one has
  cf. fig. 1. Each vesicle with M vertices is comprised of
  bonds,
  dihedrals, and
  angles within the triangles.
In all studies the translocating membrane goes through a cylindrical pore of radius Rp
and length  in a closely packed solid wall made of discrete beads of diameter σ. The wall separates the donor compartment, where the vesicle is exposed to pressure P due to highly concentrated solution of beads, from the receiver compartment which is initially empty so that the initial pressure gradient is
  , see fig. 1. The translocation time
  is measured from the moment the vesicle touches the pore entrance until it exits the orifice into the received compartment. Our integration step was chosen as
  where the MD time unit, or "mdu" in the following,
  when we choose the vertex mass m = 1 as well. The MD simulations are carried out at constant temperature T with a Nosé-Hoover thermostat using the HOOMD - Blue software on graphics processing units (GPUs) [17].
How do the units chosen in our coarse-grained model relate to those used in typical experiments? Taking our unit length  , the vesicle size for M = 19600 would be of the order of
  which is the typical diameter of a DOPC [C44H84NO8P] liposome GUV, cf. [18]. If we ascribe a mass of 62000 Da to each of our 19600 vertices so as to match that of the DOPC GUV with an energy unit
  at
at  , then our unit of time (mdu) would be of the order of
  which yields typical translocation times
  at pressures
  , cf. [19].
Figure 3 illustrates the changes which the vesicle shape undergoes during the translocation in terms of the eigenvalues e1, e2, e3 of the mean squared gyration radius tensor,  , with elapsed time since the onset of the process. Due to the circular shape of the pore, the vesicle retains spindle-like axial symmetry,
  , in the direction of motion perpendicular to the confining wall while the largest eigenvalue, e1(t), undergoes strong variations that differ qualitatively for a narrow, fig. 3(a), and a wider, fig. 3(b), pore.
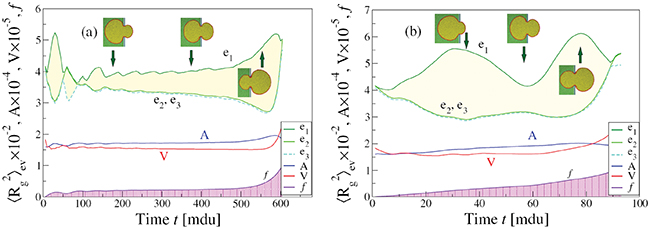
Fig. 3: Time evolution of the eigenvalues e1, e2, e3 of the mean squared gyration radius  , the surface area A, volume V, and the translocated fraction f of a vesicle with
  and
and  through pores with radius (a)
  and (b)
  , at
, at ![$\Delta P=10.0\, [k_BT/\sigma^3]$](https://content.cld.iop.org/journals/0295-5075/138/4/42001/revision3/epl22100128ieqn59.gif) . See supplementary videos Supplementary_19600_R16-25_fig3_timefactor10.mpg and Supplementary_19600_R18_fig3_timefactor1.mpg.
. See supplementary videos Supplementary_19600_R16-25_fig3_timefactor10.mpg and Supplementary_19600_R18_fig3_timefactor1.mpg.
Download figure:
Standard imageThe initial impact of the vesicle on the narrow pore leads to an immediate strong flattening at minimal translocated fraction,  , followed by a series of jerks reflected by shape oscillations while the membrane remains partially stuck in the hole and gradually protrudes forward. During this process the translocated fraction changes negligibly,
  , indicated by a long plateau until the very end of the process when an almost abrupt transition into the free compartment occurs. In contrast, for the wider pore, fig. 3(b), the initially equal eigenvalues
  split gradually upon entering the pore whereby e1 goes through two successive maxima at
  and
and  , separated by a minimum at
  , before all three eigenvalues join again upon exiting the pore. In both cases one observes some relatively weak variation of the surface area, A, and the volume, V, in the course of the translocation process. Thus, the width of the yellow-shaded regions in fig. 3, spanning the difference of e1 and e2, e3, displays the asphericity of the protruding membrane at different stages of the passage through the pore, as reflected by the translocated fraction f. We interpret the oscillations of the overall shape of the vesicle as soon as it gets partially stuck in the narrow pore as being caused by a "to and fro" motion of the embedded fillers which, owing to their initial momentum, suffer several collisions with the front and rear part of the membrane shell, pushing thereby the whole vesicle forward. Figure 3(a) indicates that the translocation process takes nearly an order of magnitude longer as compared to the case of wider pore, fig. 3(b), where the vesicle gets briefly arrested when already about half of it has crossed the pore. Then the enclosed fillers overtake and hit the front part of the shell, reflect subsequently from the rear part and hit again, pushing thus the whole vesicle ultimately into the receiver compartment. Concomitantly, one observes some changes in the membrane area A and volume V, and most notably, a slight decline in A and an increase in V at the very end of the process when the vesicle exits the pore and attains again its spherical (i.e., maximal volume, minimal area) shape yet with somewhat larger radius Rg
due to the negligible pressure in the receiver compartment.
, before all three eigenvalues join again upon exiting the pore. In both cases one observes some relatively weak variation of the surface area, A, and the volume, V, in the course of the translocation process. Thus, the width of the yellow-shaded regions in fig. 3, spanning the difference of e1 and e2, e3, displays the asphericity of the protruding membrane at different stages of the passage through the pore, as reflected by the translocated fraction f. We interpret the oscillations of the overall shape of the vesicle as soon as it gets partially stuck in the narrow pore as being caused by a "to and fro" motion of the embedded fillers which, owing to their initial momentum, suffer several collisions with the front and rear part of the membrane shell, pushing thereby the whole vesicle forward. Figure 3(a) indicates that the translocation process takes nearly an order of magnitude longer as compared to the case of wider pore, fig. 3(b), where the vesicle gets briefly arrested when already about half of it has crossed the pore. Then the enclosed fillers overtake and hit the front part of the shell, reflect subsequently from the rear part and hit again, pushing thus the whole vesicle ultimately into the receiver compartment. Concomitantly, one observes some changes in the membrane area A and volume V, and most notably, a slight decline in A and an increase in V at the very end of the process when the vesicle exits the pore and attains again its spherical (i.e., maximal volume, minimal area) shape yet with somewhat larger radius Rg
due to the negligible pressure in the receiver compartment.
One might assume that all the aforementioned transient changes are also accompanied by an ongoing variation of the energy of the vesicle whereby an activation barrier is built up from the different energy contribution mentioned in the description of the model. In fig. 4 we demonstrate for the case, shown in fig. 3(b), that this barrier is mainly formed by the elastic energy of the membrane bonds,  , cf. eq. (2), and by the short-range repulsion of the fillers inside the membrane, eq. (1), while the inputs from vertices repulsion, Umem
, and from surface bending, Uimp
, remain negligible during the entire translocation process. The maximum of Utot
is attained at
, cf. eq. (2), and by the short-range repulsion of the fillers inside the membrane, eq. (1), while the inputs from vertices repulsion, Umem
, and from surface bending, Uimp
, remain negligible during the entire translocation process. The maximum of Utot
is attained at  which occurs shortly before the second largest deformation of the vesicle membrane takes place, see fig. 3(b). It should be noted that the shape of this energetic barrier resembles strongly that of the analytically predicted Helfrich free barrier [4], or the one derived from Monte Carlo simulations [7] albeit we do not assume here the conservation of area and volume during translocation or a semi-spherical shape of the caps on both sides of the pore, as in the theory.
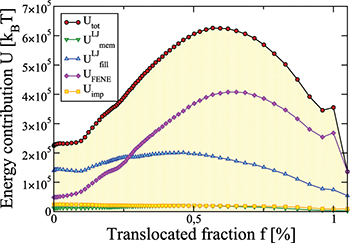
Fig. 4: Different energy contributions to total energy Utot
vs. translocated fraction f for a vesicle with  , crossing a pore with
  at
at ![$\Delta P=10.0\; [k_BT/\sigma^2]$](https://content.cld.iop.org/journals/0295-5075/138/4/42001/revision3/epl22100128ieqn70.gif) (cf. fig. 3(b)).
(cf. fig. 3(b)).
Download figure:
Standard imageThe main focus in this investigation of translocation kinetics is on the dependence of mean translocation time,  , on pore size Rp
, and in fig. 5(a) this is shown in log-normal coordinates for a number of vesicles of different size, M, and for two values of the applied pressure,
, on pore size Rp
, and in fig. 5(a) this is shown in log-normal coordinates for a number of vesicles of different size, M, and for two values of the applied pressure,  and
and  . Evidently, in all cases
  is found to diverge as the pore radius Rp
approaches some critical value, Rcr
(P, M), for which the vesicle gets stuck in the hole. The critical size Rcr
(P, M) naturally increases with growing vesicle size M, and decreases with increasing applied pressure P. As shown in the inset to fig. 5(a), however, with growing size M the vesicles manage to penetrate more and more narrow pores in comparison to their own radius Rg
. We attribute this behavior to the observed easier formation of wrinkles on the gradually softening surface and to a decrease of the effective roughness of the pore rim as the membrane size increases.
is found to diverge as the pore radius Rp
approaches some critical value, Rcr
(P, M), for which the vesicle gets stuck in the hole. The critical size Rcr
(P, M) naturally increases with growing vesicle size M, and decreases with increasing applied pressure P. As shown in the inset to fig. 5(a), however, with growing size M the vesicles manage to penetrate more and more narrow pores in comparison to their own radius Rg
. We attribute this behavior to the observed easier formation of wrinkles on the gradually softening surface and to a decrease of the effective roughness of the pore rim as the membrane size increases.

Fig. 5: (a) Membrane translocation time  vs. pore radius Rp
at pressure difference
vs. pore radius Rp
at pressure difference ![$\Delta P=7.01\;[k_BT/\sigma^3]$](https://content.cld.iop.org/journals/0295-5075/138/4/42001/revision3/epl22100128ieqn76.gif) (empty symbols), and
(empty symbols), and ![$\Delta P=10.0\; [k_BT/\sigma^3]$](https://content.cld.iop.org/journals/0295-5075/138/4/42001/revision3/epl22100128ieqn77.gif) (full symbols), for five membrane sizes M and
(full symbols), for five membrane sizes M and ![$\kappa_{imp}=5 [k_BT]$](https://content.cld.iop.org/journals/0295-5075/138/4/42001/revision3/epl22100128ieqn78.gif) , as indicated. The inset shows that larger membranes penetrate through effectively narrower pores,
, as indicated. The inset shows that larger membranes penetrate through effectively narrower pores,  , respectively. (b) A scaling plot of
  against the relative size of the pore,
  , where
  is the critical radius impassable for membranes of size M. Dashed line denotes a slope of exponent
  .
.
Download figure:
Standard imageWe find that all results, shown in fig. 5(a), can be plotted as a universal master curve in log-log coordinates, see fig. 5(b), whereby the following power law holds:  with an exponent
  . Regarding the power law divergence of
  , one should make here the caveat that the value
  emerges as a best fit from our data while the error in determination of
  when
when  (exponentially) rapidly grows due to limited statistics of sampling as manifested by the correspondingly increased scatter in the values in fig. 5(b).
The effect of the driving force on  is displayed on fig. 6(a) where we plot
  as function of the pressure gradient
  for a vesicle with M and several pore sizes Rp
. As critical pressure Pcr
(Rp
) we use the least pressure still capable of pushing the vesicle through a pore with radius Rp
. Apparently, one finds again a power law relationship,
for a vesicle with M and several pore sizes Rp
. As critical pressure Pcr
(Rp
) we use the least pressure still capable of pushing the vesicle through a pore with radius Rp
. Apparently, one finds again a power law relationship,  , however, the scaling exponent ω is found to vary with the pore radius, Rp
. For comparatively wide pores, which are rapidly passed by the vesicle, the value of ω is
, however, the scaling exponent ω is found to vary with the pore radius, Rp
. For comparatively wide pores, which are rapidly passed by the vesicle, the value of ω is  whereas as the pore gets narrower, ω increases, tending to
  . In fig. 6(b) we show the variation of Pcr
(Rp
) with the dimensionless relative size of the pore,
. In fig. 6(b) we show the variation of Pcr
(Rp
) with the dimensionless relative size of the pore,  , where Rf
denotes the smallest pore radius still penetrable by a vesicle of size M. It is seen that Pcr
(Rp
) increases when
, where Rf
denotes the smallest pore radius still penetrable by a vesicle of size M. It is seen that Pcr
(Rp
) increases when  , yet one should note that for relatively wide pores Pcr
may become so small that the vesicle fails to enter the pore. The inset in fig. 6(b) indicates the gradual increase of the exponent ω when
, yet one should note that for relatively wide pores Pcr
may become so small that the vesicle fails to enter the pore. The inset in fig. 6(b) indicates the gradual increase of the exponent ω when  . It should be noted that the observed power law variation of
  with
with  is at variance with the exponential decay, predicted in [4], while it qualitatively agrees with the results of Khunpetch et al. [5], who obtained an exponent
  .
.
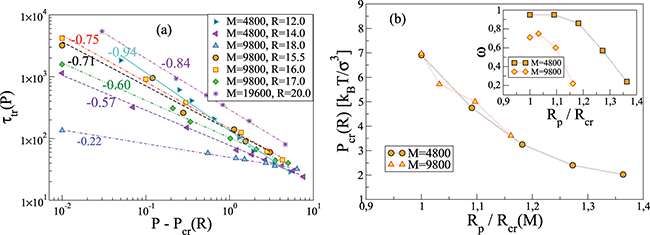
Fig. 6: (a) Translocation time  vs. pressure difference
  for several membrane sizes and
 ![$\kappa_{imp}=5\,[k_BT]$](https://content.cld.iop.org/journals/0295-5075/138/4/42001/revision3/epl22100128ieqn104.gif) , as indicated. (b) Variation of the critical pressure Pcr
(R, M) with reduced pore size
, as indicated. (b) Variation of the critical pressure Pcr
(R, M) with reduced pore size  where Rf
(M) is the least pore radius for given membrane of size M. The inset shows the increase of the exponent ω with narrowing the pore.
where Rf
(M) is the least pore radius for given membrane of size M. The inset shows the increase of the exponent ω with narrowing the pore.
Download figure:
Standard imageDiscussion
We have carried out extensive Molecular Dynamics simulations of partially filled model vesicles driven by pressure difference through narrow pores focusing on the dependence of translocation time  on different parameters that govern the passage kinetics, most notably, on the dependence of
  on pore radius Rp
and applied pressure, P. No assumptions regarding volume or surface area conservation have been made. Our observations indicate a moderate variation in these quantities during translocation even though the shape of the vesicle membrane changes significantly during the process whereby this change is found to depend essentially on the pore size and the ensuing speed of crossing. The latter turns out to be markedly affected by the bending rigidity of the vesicle shell whereby for an optimal value of this elastic modulus the crossing time attains a minimum.
on pore radius Rp
and applied pressure, P. No assumptions regarding volume or surface area conservation have been made. Our observations indicate a moderate variation in these quantities during translocation even though the shape of the vesicle membrane changes significantly during the process whereby this change is found to depend essentially on the pore size and the ensuing speed of crossing. The latter turns out to be markedly affected by the bending rigidity of the vesicle shell whereby for an optimal value of this elastic modulus the crossing time attains a minimum.
It is demonstrated that the main contributions to the activation energy barrier, which forms during crossing of the pore, are due to the elastic energy of the vesicle shell and to the mutual repulsion among the fillers in the membrane owing to vesicle deformation in the course of the translocation. The shape of the activation barrier resembles closely that predicted analytically before [4,5].
As a main result, we find a universal power law divergence of the translocation time  with decreasing size of the pore, Rp
, given by an exponent
with decreasing size of the pore, Rp
, given by an exponent  , irrespective of vesicle size and applied driving pressure difference. The translocation time is also found to diverge with decreasing driving force by means of a power law,
  , where the exponent ω tends to unity as the pore size approaches the critical one. This power law relationship agrees well with earlier predictions [5]. We hope that the present results will encourage further investigations of the translocation dynamics and shed additional light on this important and hitherto insufficiently explored phenomenon.
Acknowledgments
Support by COST CA17139 (European Cooperation in Science and Technology (see http://www.cost.eu and https://www.fni.bg) and its Bulgarian partner FNI/MON under KOST-11) is gratefully acknowledged. BR acknowledges the financial support from the Centre of Excellence "National center for mechatronics and clean technologies" (Project BG05M2OP001–1.001–0008-C010) supported by the European RD Fund within the Bulgarian OP "Science and Education for Smart Growth 2014–2020".
Data availability statement: All data that support the findings of this study are included within the article (and any supplementary files).