

Abstract
Ion cyclotron emission (ICE) is probably excited by non-thermal ion velocity distribution. Identifying characteristics of the ion velocity distribution that excites the ICE can contribute to understanding its emission mechanism. The characteristics of fast helium-3 (3He) ion velocity distribution that excites 3He ICE [ICE(3He)] on JT-60U are investigated. First, fast deuterium ion distributions, which mainly contribute to deuterium–deuterium fusion reactions, are calculated with a fast ion orbit following Monte-Carlo code (OFMC code) under realistic conditions to evaluate birth spatial and velocity distributions of the 3He ions. Then, the fast 3He ion distributions are evaluated with the OFMC code using the birth distributions and compared between cases when the ICE(3He) is observed and not. The evaluated fast 3He ion distributions at the midplane edge of the plasma on the low field side have strong pitch-angle anisotropy in both cases. In the case with the ICE(3He) excitation, a relatively peaked bump-on tail structure in the energy direction is formed in the distributions. The formation of the relatively peaked bump-on tail structure is localized at the plasma edge on the low field side. On the other hand, the distributions at the plasma edge on the low field side have a broader structure in the energy direction in the case without the excitation. The comparison results show that the formation of the relatively peaked bump-on tail structure in the fast 3He ion distribution makes a key contribution to the excitation of the ICE(3He) on JT-60U.
Export citation and abstract BibTeX RIS
1. Introduction
Excitation of waves in ion cyclotron range of frequency (ICRF) has been observed during neutral beam (NB) injection, high fusion reaction rate, and ion cyclotron resonance heating in several tokamak and helical devices, e.g. JET [1–3], TFTR [4, 5], JT-60U [6–10], ASDEX-U [11], DIII-D [12, 13], NSTX-U [14], KSTAR [15], TUMAN-3M [16], and LHD [17, 18]. These emissions are called ion cyclotron emissions (ICEs). The fast ions originated from the NB injection and the fusion productions, and accelerated by the ICRF waves are possible driving sources for the ICEs. The observed frequencies of the ICEs are often near cyclotron frequencies or harmonics of them (which is the case studied here) for the fast ion at the plasma edge on the low field side. Hence, the ICEs are considered to be excited there. In addition, experimental observations of correlations with edge-localized modes also support that the excitation region of the ICE is located near the plasma edge.
In general, non-thermal ions can excite the ICRF waves. Near the plasma edge on the low field side, where the ICEs are considered to be excited, non-thermal ion velocity distribution that has a bump-on tail structure in the energy direction and anisotropy in the pitch-angle direction can be formed. This is because fast ions can pass through both the plasma core and the plasma edge on the low field side under limited conditions of their energies and pitch angles (see figures 4(b) and (e) as examples). A formation process of the above non-thermal ion velocity distribution near the plasma edge is considered as follows. A fast ion with a pitch angle near the passing-trapped boundary draws a large banana orbit. In addition, its trajectory scale becomes larger as the energy of the fast ion increases. Hence, the fast ions with relatively high energy of hundreds keV ∼a few MeV and the pitch angle near the passing-trapped boundary can reach the plasma edge on the low field side from the plasma core. The fast ions are mainly produced near the plasma center. Thus, the large number of the relatively high-energy fast ions can reach the plasma edge. On the other hand, the fast ions from the plasma core do not reach the plasma edge when the energies are decreased enough by collisions with electrons. Then, the number of the relatively low-energy fast ions decreases near the plasma edge. As a result, the distribution of the fast ions near the plasma edge can have a positive gradient in the energy direction (the bump-on tail structure) and strong pitch-angle anisotropy.
The ICE is probably excited by this kind of non-thermal ion velocity distribution. The magneto-acoustic cyclotron instability (MCI) and the compressional Alfvén eigenmodes (CAEs) cyclotron instability are suggested as possible emission mechanisms for the ICE [2, 3, 10, 15, 19–27]. This is because the MCI and the CAE instability can be driven by the bump-on tail structure and the strong anisotropy in the ion velocity distribution and become unstable in the frequencies near the Doppler-shifted cyclotron frequencies for the fast ion. The simple Doppler-shifted cyclotron resonance condition for the fast ion is given by,

where l is a positive integer, ω is the wave angular frequency, and Ωf is the cyclotron angular frequency for the fast ion. k∣∣ is the parallel wavenumber to the magnetic field line and vf∣∣ is the parallel velocity of the fast ions. k∣∣vf∣∣ indicates the Doppler shift. Identifying characteristics of the ion velocity distribution that excites the ICE can contribute to understanding its emission mechanism. There are few works where the distributions are evaluated under realistic conditions and compared between cases when the ICE is observed and not. This is the main motivation behind this work.
On JT-60U, the ICEs considered to be excited by fast deuterium (D), helium-3 (3He), tritium (T) and hydrogen (H) ions have been observed [6–10]. The fast 3He, T and H ions are produced by deuterium–deuterium (DD) fusion reactions. Disappearances of the ICE(3He) were often observed in spite of relatively high DD fusion neutron emission rate on JT-60U [7]. One of the possible mechanisms for the disappearances of the ICE(3He) is a change of the fast 3He ion velocity distribution.
In this paper, we focused on the ICE(3He) observed in JT-60U. The purpose of this study is to reveal the characteristics of the fast 3He ion velocity distribution that excites the ICE(3He). For the purpose, first, we calculated fast D ion distributions, which mainly contribute to the fusion reaction, with OFMC code [28] under the realistic conditions and evaluated birth spatial and velocity distributions of the fast 3He ions. For the evaluations of the birth velocity distributions, influences of velocity vectors of the D ions and scattering angles of the DD fusion reaction on the birth energy were taken into account. Then, we calculated the fast 3He ion orbits with the OFMC code using the birth distributions and evaluated the fast 3He ion slowing-down distributions since the ICE(3He) often continues to be observed for times that are longer than the slowing-down time of the fast 3He ions on JT-60U (see figure 2(f) as an example). We compared the distributions in the several discharges between the cases when the ICE(3He) is observed and not. The comparison results show that the formation of a relatively peaked bump-on tail structure in the energy direction in the fast 3He ion distribution makes a key contribution to the excitation of the ICE(3He) on JT-60U.
This paper is organized as follows. The procedure for the evaluation of the fast 3He ion birth distribution and its slowing-down distribution is introduced in section 2. The analysis of the fast 3He ion slowing-down distributions is described in section 3. In section 4, we summarize this paper.
2. Procedure for evaluation of velocity distribution of fast 3He ion
In the JT-60U experiments, the beam-thermal component is dominant in the DD fusion reactions. In the most of the conventional studies on the ICE (e.g. [10]), birth energy and pitch-angle distributions of the fusion produced ions are assumed to be constant and isotropic, respectively, even if the ions are produced by the beam-thermal fusion reactions. To more properly assess the characteristics of the fast 3He ion velocity distribution, we evaluated the 3He ion birth velocity distribution by taking into account influences of velocity vectors of the D ions and scattering angles of the DD fusion reaction on the birth energy in this study. The birth energy of the 3He ion produced by the DD fusion reaction in the laboratory system E3He as a function of the scattering angle is given by [29],
where m3He and mn are the mass of 3He ion and neutron, respectively. Vc is the center-of-mass velocity of the D ions, Q is the fusion reaction energy, and K is the relative energy of the D ions. μ is the cosine of the scattering angle between Vc and the 3He ion velocity in the center-of-mass system. This scattering-angle distribution is given by the probability density, which consists of the differential cross section for the DD fusion reaction. In this study, the differential cross section for the D(d, n)3He reaction was taken from the work by Drosg and Otuka (2015) [30].
In this study, we adopted OFMC code [28] to calculate the fast ion orbits and evaluate the fast ion distribution. The OFMC code is a Monte-Carlo simulation code and can trace fast ion guiding-center and/or full-gyro orbits in three-dimensional magnetic field. This code has been validated in terms of heat loads on the wall due to the fast ion loss and beam driven currents in several tokamak experiments, e.g. JFT-2M [31], JT-60U [32–34], and DIII-D [35].
We have evaluated the fast 3He ion velocity distribution by using the OFMC code as in the previous work [10] except for the difference in the calculation method of the 3He ion birth velocity distribution. In addition, we have additionally taken into account the magnetic ripple including influences from ferritic steel tiles on the wall, which were installed to reduce the magnetic ripples on JT-60U [34]. The guiding-center orbits were followed until the fast ions hit the wall or until the energies of the fast ions decrease below 1.25 times the ion temperature of the bulk plasma. Although the orbit calculation is neo-classical, the neo-classical assumption is reasonable since intense MHD activities were not observed in the plasma analyzed in this study.
In order to confirm whether the guiding-center approximation is reasonable under the condition analyzed in this study, we compared collisionless guiding-center orbits of fast 3He ions having 500 keV with collisionless full-gyro orbits on the time scale that corresponds to deceleration of ∼5 keV when the collision is taken into account. This means that the collisions can 'reset' the orbit position many times on this time scale. Namely, the difference of the orbit position between the collisionless full-gyro and guiding-center orbits on this time scale can be considered as the largest difference due to the guiding-center approximation. The difference of the orbit position between the full-gyro and guiding-center orbits is estimated to be a few millimeters at the maximum under a typical plasma condition analyzed here. Hence, the guiding-center approximation is reasonable under the conditions in this study.
The thermal–thermal and beam-thermal DD fusion reactions were taken into account to evaluate the 3He ion birth distribution. First, the orbits of the fast D ions produced by the NB injections were calculated to evaluate the 3He ion birth distribution originating from the beam-thermal DD fusion reactions. The number of the test particles representing the fast D ions is 105. Equation (2) was used for the calculation of the birth velocity distribution of the beam-thermal DD fusion produced 3He ions. The 3He ion birth spatial distribution originating from the thermal–thermal DD fusion reactions was evaluated from the bulk plasma parameters. The birth energy of the thermal–thermal DD fusion produced 3He ions was assumed to be 820 keV. Next, we followed the orbits of the fast 3He ions produced by the DD fusion reactions using the birth spatial and velocity distribution as an initial condition. The number of the test particles representing the fast 3He ions is 5 × 10⁵.
A sampling box was used for the evaluation of the distribution (see figure 4(c) and (f) as examples). The shape of the sampling box is a square on the R–Z plane and its length is 0.02 m in both R and Z directions. Here, R and Z are the major radius and the vertical coordinate, respectively. The distribution is averaged in the toroidal direction. The weight of the test particle is evenly distributed into 64 elements on a one-cycle gyro orbit when the test particle comes near the sampling box. Here, we approximated this gyro orbit as a circle with the Larmor radius on the R–Z plane and its center is located at the position of the guiding center orbit of the test particle. The weight elements located in the sampling box are accumulated to evaluate the distribution.
3. Analysis of the fast 3He ion distribution
3.1. Experimental setup
On JT-60U, the plasma current flows clockwise in the toroidal direction as seen from above the torus. The toroidal magnetic field is also in the clockwise direction. Positive-ion sourced NBs (P-NBs) were installed in both almost perpendicular and tangential directions to the toroidal magnetic field. The tangential P-NBs consisted of both co-current (CO) P-NBs and counter-current (CTR) ones. The beam lines of the perpendicular P-NBs were also slightly tilted in both CO and CTR directions. In addition, negative-ion sourced NBs (N-NBs) were installed in the almost CO-tangential direction. Here, acceleration voltages of the P-NBs and the N-NBs were about 85 kV and 350 kV, respectively.
ICRF antenna straps were installed on the wall on the low field side and used not only for the ICRF heating, but also for the measurement of the ICEs [7–10]. The measured data was recorded by an oscilloscope with the sampling frequency of 500 MSamples s–1 during 100 μs. The sampling was repeated at every 50 ms.
3.2. A typical D discharge where the ICE(3He) disappears in spite of the relatively high neutron emission rate
The disappearance of the ICE(3He) in spite of the relatively high neutron emission rate was observed in a discharge of E48473. Figure 1 shows the time evolution of (a) the plasma current Ip, (b) the safety factor at the 95% toroidal magnetic flux surface q95 and (c) the major radial position of the midplane edge of the plasma on the low field side Redge in E48473. Ip was controlled so as to be constant in the time range of figure 1. q95 and Redge are stationary until t = ∼7.0 s and become almost stationary again from t = ∼9.2 s, indicating that the plasma equilibrium is almost stationary until t = ∼7.0 s and from t = ∼9.2 s.
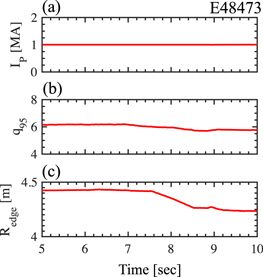
Figure 1. Time evolution of (a) the plasma current Ip, (b) the safety factor q95 and (c) Redge in E48473. Here, Redge is the major radial position of the midplane edge of the plasma on the low field side.
Download figure:
Standard image High-resolution imageFigure 2 shows time evolution of (a) CO-tilted perpendicular (solid line) and CO-tangential (dashed line) P-NB powers, (b) CTR-tilted perpendicular (solid line) and CTR-tangential (dashed line) P-NB powers, (c) a line-averaged density  (d) a stored diamagnetic energy of the plasma Wd, and (e) the neutron emission rate Sn in E48473. Plasma parameters such as
  and Wd, and Sn are also almost stationary until t = ∼7.0 s and from t = ∼9.2 s as well as the plasma equilibrium as shown in figure 1. Figure 2(f) shows time evolution of a frequency spectrum of fluctuations measured with the ICRF antenna strap. Dotted and dashed lines indicate D (fcD) and 3He ion cyclotron frequencies (fc3He) at the midplane edge of the plasma on the low field side, respectively. The temporal changes of these cyclotron frequencies can be explained by the change of the plasma edge position shown in figure 1(c). Observed fluctuations in the frequency near lfcD (l = 2, 3) are interpreted as the ICE(D). The fluctuation observed in the frequencies near 2fc3He is the 2nd harmonic ICE(3He). Only harmonics of the ICE(3He) were often observed in the relatively high density plasma on JT-60U while the fundamental one was not observed [8], although its mechanism is not understood. The 2nd harmonic ICE(3He) becomes weak and disappears as the plasma equilibrium changes in spite of that Sn from t = ∼9.2 s is much higher than that until t = ∼7.0 s. Here, we focused on the 2nd harmonic ICE(3He) before and during its disappearance, and compared the distribution between the cases with and without the ICE(3He) excitation. Figure 2(g) shows the temporal evolution of its toroidal wavenumber kφ measured with the ICRF antenna straps arranged in the toroidal direction.

Figure 2. Time evolution of (a) the CO-tilted perpendicular (solid line) and CO-tangential (dashed line) P-NB powers PNB, (b) the CTR-tilted perpendicular (solid line) and CTR-tangential (dashed line) P-NB powers PNB, (c) a line-averaged density  (d) a stored diamagnetic energy of the plasma Wd, (e) a neutron emission rate Sn, (f) a frequency spectrum of fluctuations and (g) a toroidal wavenumber kφ of the second harmonic ICE(3He). Dotted and dashed lines in the frequency spectrum indicate the cyclotron frequencies for D ion and 3He ion at the midplane edge of the plasma on the low field side, respectively.
Download figure:
Standard image High-resolution imageWe evaluated the fast 3He ion distribution until t = ∼7.0 s and from t = ∼9.2 s as the cases with and without the ICE(3He) excitation, respectively. At t = 5.4 and 9.4 s, radial profiles of the electron density and temperature were measured. Figure 3 shows radial profiles of (a) the electron density ne, (b) the electron temperature Te and (c) the safety factor q at t = 5.4 s and 9.4 s in E48473. The radial profiles of q indicate that the magnetic shears are positive. Using ne and Te in figure 3, we calculated a slowing down time of the fast 3He ions with the energy of 0.82 MeV at the plasma axis τs0. τs0 at t = 5.4 and 9.4 s is respectively about 0.15–0.2 s and 0.2–0.25 s. In general, the fast ion velocity distribution becomes stationary after the time scale of the slowing down time elapses. Even on timescales longer than τs0 after Sn has become almost stationary, the 2nd harmonic ICE(3He) continues to be observed until t = ∼7.0 s and is not detected from t = ∼9.2 s. Thus, we evaluated the fast 3He ion distributions under the stationary conditions (slowing-down distributions). The parameters in figure 3 were used for the orbit calculations to evaluate the distributions.

Figure 3. Radial profiles of (a) the electron density ne, (b) the electron temperature Te and (c) the safety factor q at t = 5.4 s (circles and solid lines) and 9.4 s (squares and dashed lines) in E48473. Here, ρ is a normalized minor radius.
Download figure:
Standard image High-resolution image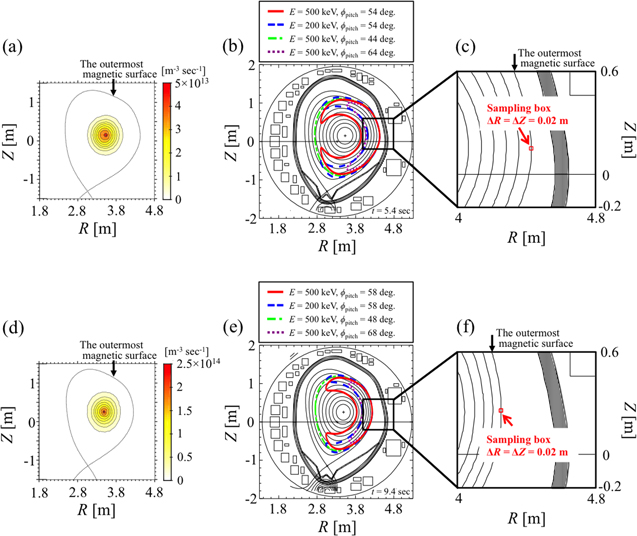
Figure 4. (a), (d) The birth profiles of the 3He ions, (b), (e) schematic drawings of the magnetic surfaces, and (c), (f) schematic drawings of the sampling boxes on the R–Z plane at (a)–(c) t = 5.4 s and (d)–(f) t = 9.4 s in E48473. (b), (e) Examples of fast 3He ion guiding-center orbits that pass through the midplane edge of the plasma on the low field side are also shown. These fast 3He ions have the energy E of 500 keV (solid, dashed–dotted and dotted lines) and 200 keV (dashed line). The pitch angles ϕpitch of the fast 3He ions are set to (b) 44° (dashed–dotted line), 54° (solid and dashed lines) and 64° (dotted line), and (e) 48° (dashed–dotted line), 58° (solid and dashed lines) and 68° (dotted line) at the midplane edge of the plasma on the low field side. (c), (f) These sampling boxes are located at the midplane edge of the plasma on the low field side. The lengths of the sampling box are 0.02 m in both R and Z directions.
Download figure:
Standard image High-resolution image3.3. Evaluation and comparison of the distribution
As mentioned in section 3.2, we calculate the fast ion orbits by using the parameters at t = 5.4 s and 9.4 s to evaluate the fast 3He ion slowing-down distribution in the cases with and without the ICE(3He) excitation in E48473, respectively. Figure 4(a) and (d) show the birth profiles of the 3He ions on the R–Z plane at t = 5.4 and 9.4 s in E48473, respectively. The beam-thermal fusion component of the birth profiles was evaluated by the orbit calculations of the fast D ions, and the thermal–thermal component was evaluated from the bulk plasma parameters as we mentioned in section 2. The beam–beam fusion component was small even near the plasma axis, where the beam–beam fusion reaction rates are the highest, compared with the beam-thermal fusion reaction rates: The beam–beam fusion component was estimated to be about 9% of the beam-thermal fusion component. Here, we did not include the beam–beam DD fusion produced 3He ions since the influence of the beam–beam fusion reactions on the 3He ion birth distribution was estimated to be small but the calculations of the beam–beam components are very complicated. These birth profiles were used for the initial condition of the fast 3He ion orbit calculations. Figure 4(b) and (e) show the magnetic surfaces on the R–Z plane at t = 5.4 s and 9.4 s, respectively. Figure 4(b) and (e) also show examples of guiding center orbits of the fast 3He ions passing through the plasma edge on the low field side. The fast 3He ions drawing large banana orbits can pass through both the region near the plasma center and the plasma edge on the low field side, and its scales strongly depend on the energies E and pitch angles ϕpitch. Figure 4(c) and (f) show the sampling boxes used for the evaluation of the distribution. These sampling boxes are located at the midplane edge of the plasma on the low field side.
First, we evaluated the fast 3He ion slowing-down distributions at the midplane edge of the plasma on the low field side in the cases with and without the ICE(3He) excitation in E48473. Figure 5 shows the evaluated energy E and pitch-angle ϕpitch distributions of the fast 3He ions at the sampling boxes (see figure 4) in the case (a) with and (b) without the ICE(3He) excitation. Here, we calculated the critical energy at the plasma axis Ecr0 at which energy transfer rates from the fast ions to bulk electrons and to bulk ions via collisions are equal. Ecr0 is about 90 keV at t = 5.4 s and about 130 keV at t = 9.4 s. In the region of E > Ecr0, the distributions in both cases have strong pitch-angle anisotropy, peaking at ϕpitch ∼ 54° for the case (a) and at ϕpitch ∼ 58° for the case (b). These pitch-angle distributions become broader when E < Ecr0. This is because pitch-angle scatterings begin to frequently occur due to the ion–ion collisions when E becomes lower than Ecr0. In the case with the excitation, the bump-on tail structure in the energy direction is formed and its highest distribution density is located around E = 500 keV and ϕpitch = 54°. Using averaged values of the frequency and k∣∣ of the observed 2nd harmonic ICE(3He) and fc3He at the midplane edge of the plasma on the low field side during t = 5–7 s in E48473, we calculated a resonant energy Eres that can satisfy the Doppler-shifted 3He ion cyclotron resonance condition of equation (1). The frequency of the observed 2nd harmonic ICE(3He) and 2fc3He averaged during t = 5–7 s in figure 2(f) are ∼47.3 MHz and ∼49.4 MHz, respectively. Averaged kφ of the 2nd harmonic ICE(3He) in figure 2(g) is about −4.75 m−1. The negative value of kφ indicates that the waves propagate in the CTR direction. Here, we assumed k∣∣ ∼ kφ. vf∣∣ of the fast 3He ions is in the CO direction as shown in figure 5(a). Hence, the Doppler shift of k∣∣vf∣∣ is consistent with a downshift in the 2nd harmonic ICE(3He) frequency from 2fc3He since k∣∣vf∣∣ is negative. Eres as a function of ϕpitch is shown in figure 5(a). Eres passes near the location of the highest distribution density in the bump-on tail structure, indicating that the evaluated fast 3He ion distribution is almost consistent with the experimental observations of the frequency and kφ of the 2nd harmonic ICE(3He) in terms of the cyclotron resonance condition of equation (1). On the other hand, in the case without the excitation, the distribution has a broader structure in the energy direction around ϕpitch = 58°, where the distribution density of the fast 3He ions having E = 500 keV is the highest. When Redge becomes smaller, even relatively low energy 3He ions can reach the plasma edge on the low field side. As a result, the number of the relatively low energy 3He ions at the plasma edge can increase and they would make the bump-on tail structure broader in the energy direction.

Figure 5. Energy E and pitch-angle ϕpitch distributions of the fast 3He ions at the sampling box (see figures 4(c) and (f)) in the cases (a) with and (b) without the ICE(3He) excitation in E48473. Here, Ecr0 is the critical energy at the plasma axis, at which the energy transfer rates from the fast ions to bulk electrons and to bulk ions via collisions are equal. Ecr0 is ∼90 keV in the case with the excitation and ∼130 keV in the case without the excitation. A dashed line in the case with the excitation indicates E = Eres where Eres is the resonant energy satisfying the Doppler-shifted 3He ion cyclotron resonance condition of equation (1). Here, Eres is calculated by using the averaged values of the observed 2nd harmonic ICE(3He) frequency and its toroidal wavenumber, and the 3He ion cyclotron frequency at the midplane edge of the plasma on the low field side during t = 5–7 s in E48473.
Download figure:
Standard image High-resolution imageFigure 6 shows normalized (a) pitch-angle and (b) energy distributions f3He on the distributions shown in figure 5 in the cases with (circles) and without (squares) the ICE(3He) excitation. The pitch-angle distributions are averaged from E = 480 to 520 keV. The energy distributions are averaged in ϕpitch = 54° ± 3° in the case with the excitation and in ϕpitch = 58° ± 3° in the case without the excitation. These distributions are normalized by their maximum distribution densities fmax. The pitch-angle distributions in both cases have an almost same sharply peaked structure. The energy distribution has the bump-on tail structure with a peak at E ∼500 keV in the case with the excitation. On the other hand, the energy distribution has a relatively flat structure from E = ∼Ecr0 to ∼500 keV in the case without the excitation.

Figure 6. Normalized fast 3He ion (a) pitch-angle and (b) energy distributions at the plasma edge f3He in the cases with (circles) and without (squares) the ICE(3He) excitation in E48473. The distributions are averaged (a) in E = 500 ± 20 keV and (b) in ϕpitch = 54° ± 3° in the case with the excitation and in ϕpitch = 58° ± 3° in the case without the excitation, and normalized with their maximum values of the distribution densities fmax.
Download figure:
Standard image High-resolution imageNext, we evaluated the fast 3He ion slowing-down distributions at several R positions on the low field side as well as the evaluation at the plasma edge. Figure 7 shows R position dependences of normalized gradients of the energy distribution (Δf/ΔE)/f0 in the cases with (circles) and without (squares) the ICE(3He) excitation in E48473. Here, Raxis is R at the plasma axis. Δf/ΔE is a gradient of the energy distribution f(E) from E = 200 to 500 keV and f0 is the distribution density at E = 500 keV in f(E). f(E) is the energy distribution averaged around the pitch angle where the population in the fast 3He ion distribution is the largest. Large positive (Δf/ΔE)/f0 indicates that the bump-on tail structure is peaked in the energy direction. (Δf/ΔE)/f0 near the plasma edge on the low field side in the case with the excitation is much larger than that in the case without the excitation. As we mentioned in section 1, the plasma edge on the low field side is a possible emission region for the ICE(3He) because the observed frequencies of the ICE(3He) were always near the 3He ion cyclotron frequencies there. The large value of (Δf/ΔE)/f0 is localized at the plasma edge in the case with the excitation. Hence, it is suggested that the formation of the peaked bump-on tail structure is necessary for the excitation of the ICE(3He).
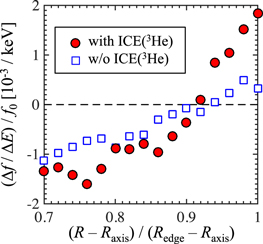
Figure 7. Major radial position dependences of normalized gradients of the energy distribution (Δf/ΔE)/f0 in the cases with (circles) and without (squares) the ICE(3He) excitation in E48473. Here, Δf/ΔE is a gradient of the energy distribution from E = 200 to 500 keV and f0 is the distribution density at E = 500 keV in the energy distribution. Raxis is R at the plasma axis.
Download figure:
Standard image High-resolution imageFinally, we applied this evaluation method to several discharges where at least one of the NBs is injected and Sn is more than 2 × 10¹⁴ n s–1. Figure 8 shows a relation between the amplitudes of the 2nd harmonic ICE(3He) and (Δf/ΔE)/f0 at the midplane edge of the plasma on the low field side. Circles and squares indicate data points when the ICE(3He) is observed and not, respectively. When the ICE(3He) is not observed, the amplitudes are set to be on the horizontal axis. The ICE(3He) is observed in the region of the relatively large (Δf/ΔE)/f0. Hence, the analysis results of the fast 3He ion distribution show that the formation of the relatively peaked bump-on tail structure is necessary to excite the ICE(3He).

Figure 8. A relation between amplitudes of the second harmonic ICEs(3He) and (Δf/ΔE)/f0. Circles indicate the observed amplitudes. Squares are data points when the ICE(3He) is not observed. Here, the squares are set to be on the horizontal axis.
Download figure:
Standard image High-resolution image
In the previous theoretical studies for the MCI [2, 22] and for the CAE instability [20, 21], the necessity of the sharply peaked fast ion velocity distribution for the excitation of the ICE has been suggested. In both models, the linear growth rate drastically increases as the spread of the distribution becomes smaller. The analysis results of the characteristics of the fast 3He ion distribution with the OFMC code are qualitatively consistent with the dependence of the growth rate on the spread of the velocity distribution in the previous theoretical studies. It is found that the excitation condition of the ICE(3He) strongly depends on the characteristics of the fast 3He ion distribution on JT-60U.
Using Monte-Carlo simulations for evaluation of the alpha-particles distribution and calculating anti-Hermitian parts of susceptibility tensor of its distribution under similar parameter conditions to those of TFTR, Hellsten et al concluded that the thermonuclear alpha particles even in the steady-state condition can destabilize edge localized magnetosonic eigenmodes on the low field side due to the strong inversion of the distribution function along the characteristics of cyclotron interaction by neo-classical effects [36]. Our result is consistent with their result. Quantitative evaluations of the growth rates based on realistic wave and velocity distribution models are future works. The calculation of the anti-Hermitian parts of the susceptibility tensor of the evaluated distribution as in the work by Hellsten et al [36] would be the first step toward the quantitative evaluations of the growth rates based on the realistic models.
4. Summary
The identification of the characteristics of the ion velocity distribution that excites the ICE can contribute to understanding its emission mechanism. In this paper, the characteristics of the fast 3He ion velocity distribution exciting the ICE(3He) on JT-60U were investigated. First, we calculated the fast D ion distributions, which mainly contribute to the fusion reaction, with the OFMC code under the realistic conditions and evaluated the birth spatial and velocity distributions of the fast 3He ions. For the evaluation of the 3He ion birth velocity distribution, the influences of the velocity vectors of the D ions and the scattering angles of the DD fusion reaction on the birth energy were taken into account. Then, we evaluated the fast 3He ion slowing-down distributions with the OFMC code using the birth distributions and compared the distributions between the cases when the ICE(3He) is observed and not. The fast 3He ion slowing-down distributions at the midplane edge of the plasma on the low field side have the strong pitch-angle anisotropy in both cases. In the case with the ICE(3He) excitation, the relatively peaked bump-on tail structure in the energy direction is formed in the distributions. The formation of the relatively peaked bump-on tail structure is localized at the plasma edge on the low field side. On the other hand, the fast 3He ion distributions at the plasma edge on the low field side have the broader structure in the energy direction in the case without the excitation. The comparison results show that the formation of the relatively peaked bump-on tail structure makes a key contribution to the excitation of the ICE(3He) on JT-60U.
In this study, we have evaluated the fast 3He ion distribution only under the stationary condition. We are planning on an improvement of the method used for the evaluation of the fast 3He ion distribution to evaluate the distribution in the time period when the bulk plasma parameters and/or conditions of the NB injections are temporally changing. In addition, quantitative evaluations of the growth rates based on realistic wave and velocity distribution models are also future works.
Acknowledgments
The authors are grateful to the JT-60 team of the National Institutes for Quantum and Radiological Science and Technology for their collaborations. This research was conducted using the supercomputer SGI ICE X in the Japan Atomic Energy Agency.