


Abstract
Cone-beam CT (CBCT) scans utilised for image guided radiation therapy (IGRT) procedures have become an essential part of radiotherapy. The aim of this study was to assess organ and effective doses resulting from new CBCT scan protocols (head, thorax, and pelvis) released with a software upgrade of the kV on-board-imager (OBI) system. Organ and effective doses for protocols of the new software (V2.5) and a previous version (V1.6) were assessed using Monte Carlo (MC) simulations for the International Commission on Radiological Protection (ICRP) adult male and female reference computational phantoms. The number of projections and the mAs values were increased and the size of the scan field was extended in the new protocols. Influence of these changes on organ and effective doses of the scans was investigated. The OBI system was modelled in EGSnrc/BEAMnrc, and organ doses were estimated using EGSnrc/DOSXYZnrc. The MC model was benchmarked against experimental measurements. Organ doses resulting from the V2.5 protocols were higher than those of V1.6 for organs that were partially or fully inside the scans fields, and increased by (3–13)%, (10–77)%, and (13–21)% for the head, thorax, and pelvis protocols for both phantoms, respectively. As a result, effective doses rose by 14%, 17%, and 16% for the male phantom, and 13%, 18%, and 17% for the female phantom for the three scan protocols, respectively. The scan field extension for the V2.5 protocols contributed significantly in the dose increases, especially for organs that were partially irradiated such as the thyroid in head and thorax scans and colon in the pelvic scan. The contribution of the mAs values and projection numbers was minimal in the dose increases, up to 2.5%. The field size extension plays a major role in improving the treatment output by including more markers in the field of view to match between CBCT and CT images and hence setting up the patient precisely. Therefore, a trade-off between the risk and benefits of CBCT scans should be considered, and the dose increases should be monitored. Several recommendations have been made for optimisation of the patient dose involved for IGRT procedures.
Export citation and abstract BibTeX RIS
1. Introduction
Cone beam CT (CBCT) using a wide x-ray beam with a digital image plate is employed for image guided radiation therapy (IGRT) to improve positioning of the target (tumour) for radiotherapy. However, imaging procedures give an additional radiation dose to surrounding tissues so procedures need to be optimised (AAPM 2007, Alaei and Spezi 2015). CBCT scans used for IGRT can be acquired with megavoltage (MV) or kilovoltage (kV) energies, but kV images are preferred because of the superior contrast. The kV systems are commonly integrated into modern linear accelerators (linac). The kV systems used extensively in radiotherapy are the on-board-imager (OBI) (Varian Medical systems, Palo Alto, CA) and x-ray volume imaging (XVI) (Elekta, Crawley, UK), and this investigation is based on the Varian OBI system.
Since its introduction, the OBI has been developed, through improvements in system software and hardware to enhance performance. Default scan protocols are released in parallel with new software, which can be used by practitioners directly or modified to suit particular applications. Recently, a new software version (V2.5) and protocols have been released. Organ and effective doses resulting from a wide range of XVI scan protocols were assessed recently (Marchant and Joshi 2017). The aim of this study is to use Monte Carlo simulations to evaluate organ and effective doses resulting from the recent OBI upgrade, and to compare the doses to a previous version (V1.6). It also aimed to investigate the influence of the changes in different scan parameters on the dose levels.
2. Materials and methods
2.1. Scan protocols
The OBI system employed in this study was integrated into a TrueBeam linac. The technical and dosimetric properties of the system have been described in detail in previous studies (Abuhaimed et al 2014, Abuhaimed et al 2015). The OBI software of the TrueBeam linac installed initially was V1.5, and this has been followed by upgrades to V1.6, V2.0, and recently V2.5. The main purpose of the upgrades was to give better performance of the system in matching the patient position with the CT images used for the treatment plan by, for example, improving the image quality using an enhanced image reconstruction technique, or extending the scan field size to include more tissues and organs as markers for use in matching images. This study compares organ and effective doses given by V2.5 with those of V1.6 for the scan protocols utilised commonly in the clinic for head, thorax, and pelvis scans. Parameters for these protocols are listed in tables 1 and 2.
Table 1. Scan parameters of the default protocols implemented in V1.6.
| Scan parameter | Head | Thorax | Pelvis |
|---|---|---|---|
| X-ray voltage (kV) | 100 | 125 | 125 |
| mA | 20 | 20 | 80 |
| ms | 20 | 20 | 20 |
| Projection numbers | 367 | 660 | 660 |
| mAs | 146.8 | 264 | 1056 |
| Scan rotation | 200° | 360° | 360° |
| Scan modea | Full-fan | Half-fan | Half-fan |
| Bowtie filter typea | Full | Half | Half |
| Trajectory | Half | Full | Full |
| X1 and X2 (mm)b | –132, +132 | –26, +239 | –26, +239 |
| Y1 and Y2 (mm)c | –99, +99 | –99, +99 | –99, +99 |
| Scan diameter (mm) | 264 | 478 | 478 |
| Beam width (W) (mm) | 198 | 198 | 198 |
aExplained in figure 1 of (Abuhaimed et al 2014). bX blades control the extent of the beam in the lateral direction (scan diameter) at the isocentre. cY blades control the extent of the beam in the axial direction (beam width) at the isocentre.
Table 2. Scan parameters of the default protocols implemented in V2.5.
| Scan parameter | Head | Thorax | Pelvis |
|---|---|---|---|
| X-ray voltage (kV) | 100 | 125 | 125 |
| mA | 15 | 15 | 60 |
| ms | 20 | 20 | 20 |
| Projection numbers | 500 | 900 | 900 |
| mAs | 150 | 270 | 1080 |
| Scan rotation | 200° | 360° | 360° |
| Scan mode | Full-fan | Half-fan | Half-fan |
| Bowtie filter type | Full | Half | Half |
| Trajectory | Half | Full | Full |
| X1 and X2 (mm) | –140, +140 | –34, +247 | –34, +247 |
| Y1 and Y2 (mm) | –107, +107 | –107, +107 | –107, +107 |
| Scan diameter (mm) | 280 | 494 | 494 |
| Beam width (W) (mm) | 214 | 214 | 214 |
The main differences between protocols of V1.6 and V2.5 are:
- 1-Values of mAs per projection were reduced from 0.8 and 1.6 to 0.3 and 1.2 for the V2.5 protocols. However, the numbers of projection were increased by 133 and 240 projections for the head and body protocols, respectively, which led to an increase in mAs values by ∼2.3%.
- 2-The dimensions of the scan fields were extended by 16 mm in both axial (along the patient) and lateral directions.
2.2. Assessment of organ and effective doses
Monte Carlo (MC) simulations were employed to assess organ doses resulting from V1.6 and V2.5 CBCT scans for the International Commission on Radiological Protection (ICRP) adult male and female reference computational phantoms (ICRP 2009). The MC simulations were run using BEAMnrc/EGSnrc and DOSXYZnrc/EGSnrc user codes (V2016) (Rogers et al 1995, Kawrakow et al 2000, Walters et al 2017). The MC calculations required to assess the doses were carried out in two main stages described in the following sub-sections.
2.2.1. Simulation of the kV source
BEAMnrc user code was utilised to model the kV beam generated based on components of the OBI system, using elemental properties and dimensions of the components obtained from Varian. The MC model was validated against experimental measurements and this has been reported in detail in previous studies (Abuhaimed et al 2014, Abuhaimed et al 2015).
The MC model was used to simulate kV beams for the scan protocols V1.6 (table 1) and V2.5 (table 2). The parameter ISOURCE = 10 (parallel circular beam incident from side) was employed to run 1.0 × 10¹⁰ histories for each beam. Simulation of the kV beam in BEAMnrc requires only the field size and the bowtie type for each protocol, while running the simulations in DOSXYZnrc requires all the other parameters such as mAs and projection numbers. Figure 1 shows the difference between the scan fields for the V1.6 and V2.5 head and body (thorax and pelvis) protocols. Since dimension of the scan field for the thorax and pelvis protocols is identical, but different from that of the head (tables 1 and 2), two kV beams for each version can be used, i.e. one for the head protocol and the other for the body protocols. Therefore, the two electron energies of 100 and 125 keV were applied to generate two beams for V1.6 (figures 1(a) and (b)) and two for V2.5 (figures 1(c) and (d)).

Figure 1. Dimension of the scan fields at an isocentre of 100 cm (a) and (b) for the V1.6 head and body (thorax and pelvis) protocols, respectively, and (c) and (d) for V2.5 (tables 1 and 2). (a) and (c) represent the full fan used for the head scans, while (b) and (d) show the half-fan applied for the body scans.
Download figure:
Standard image High-resolution imageThe cut off energy for photon transport (PCUT) and the low energy thresholds for creation of secondary photons (AE) were set to 1 keV. However, values for the corresponding parameters (ECUT) and (PE) for electrons were set to 516 keV, which is just above the electron rest mass energy. As the range of secondary electrons with energies of 100 and 125 keV inside the phantoms is small, e.g. the range of an electron in an adipose tissue, which has the lowest density in the body (0.92 g cm−3) is 0.15 mm for 100 keV and 0.22 mm for 125 keV (NIST 2017), the proportion of secondary electrons crossing a voxel boundary is extremely small, as the voxel sizes are 2.1 × 2.1 × 8.0 mm3 for the male phantom and 1.8 × 1.8 × 4.8 mm3 for the female phantom. As a result, (ECUT) and (PE) can be set to any energy higher than the x-ray peak voltage. This modification results in deposition of the doses resulting from secondary electrons at the interaction sites (i.e. original places), which minimises the simulation time required to track trajectories and interactions of each secondary electron.
The directional bremsstrahlung splitting technique, which improves the efficiency of MC simulations (Kawrakow et al 2004, Mainegra-Hing and Kawrakow 2006), was applied with a splitting number (NBRSP) set to 2 × 10⁴. Spin effects, photoelectron angular sampling, Rayleigh scattering, atomic relaxations, and electron impact ionisation were turned on. The algorithms EXACT and PRESTA-II were employed for the boundary crossing and electron-step, respectively. Data of Koch and Motz (KM) and the National Institute of Standards and Technology (NIST) were used for bremsstrahlung angular sampling and cross sections, respectively. The XCOM-NIST data were used for photon cross sections, and simple and Bethe–Heitler data were selected to pair angular sampling and pair cross sections, respectively. The four kV beams generated by BEAMnrc were stored in files known as phase space (PHSP) files at a source-surface-distance of 50 cm.
2.2.2. Assessment of absorbed dose
The MC model developed and validated in the first step (section 2.2.1) was also calibrated to calculate absolute absorbed dose for 100 and 125 kV x-ray beams. The method used to calibrate the model was reported in detail in (Martin et al 2016), and was used to develop two energy-based calibration factors (FMC) for 100 and 125 kV, which are used for the head and body protocols, respectively.
The PHSP files obtained in the first step were moved to the user code (DOSXZYnrc) to assess organ doses resulting from each scan protocol listed in tables 1 and 2. First, the ICRP male and female phantoms were converted to DOSXZYnrc format using a MATLAB code developed in house. Over 140 organs and tissues were defined in DOSXZYnrc, made up of 53 media of different elemental compositions and densities. The method used to covert and define the phantoms was reported in detail in (Martin et al 2016). Second, the PHSP files were used as kV sources in DOSXZYnrc using ISOURCE = 8 (phase-space source incident from multiple directions). The centre of each phantom was placed at a source-isocentre-distance of 100 cm, so a distance of 50 cm along the beam axis was set between the positions of phantoms and the PHSP files. The centre of the head scan was set at mid-point of the head, while centres of the thorax and pelvis scans were at the mid-points of the lung and the pelvis of each phantom.
Twelve simulations (six per phantom) using V1.6 and V2.5 protocols were run, each with different projection numbers and scan rotation as listed in tables 1 and 2. In order to obtain statistical uncertainties <1% for organs and tissues that were irradiated fully by the primary beam, some 10 × 1010 and 1.5 × 10¹⁰ histories were run for the male and female phantoms, respectively. Outputs of these simulations given in (3ddose) format were analysed using a MATLAB code developed in house to extract the mean absorbed dose in 3D for each organ and tissue as described in (Martin et al 2016). Subsequently, the organ and tissue doses (DO,T) were assessed as:

where DMC is the mean absorbed dose obtained from the MC simulations, FMC is the calibration factor, and mAs depends on the protocol of interest. Effective doses (E) for each protocol were then estimated using tissue weighting factors recommended by ICRP 103 (ICRP 2007). For simplicity, 'organ doses', which refers to organ and tissues doses in the phantoms, will be used in subsequent sections in order to allow overall comparisons in dose levels to be made.
2.2.3. Assessment of the influence of changes in different scan parameters
Six additional simulations were run (three per each phantom) using the head, thorax, and pelvic V2.5 protocols to investigate the influence of the projection numbers and the associated increase in mAs values, on organ and effective doses. The scan parameters listed in table 2 were used, except that the projection numbers and mAs values were set to those used for the V1.6 protocols (table 1). The influence of the scan field extension by 16 mm in the axial and lateral directions was also investigated. This was achieved by using the V2.5 scan protocols to run six further simulations (three per each phantom), with the beam width and scan diameter set to the values used for the V1.6 protocols.
3. Results and discussion
3.1. Organ and effective doses
Organ doses resulting from CBCT scans using V1.6 and V2.5 scan protocols are given in tables 3–5. The effective doses for the V2.5 protocol for the male phantom were 14%, 17%, and 16% higher for the head, thorax, and pelvis protocols, respectively, and for the female phantom were 13%, 18%, and 17% higher, respectively. The dose variations between the male and female phantoms for all protocols were mainly due to the differences in shape, size, and length of the phantoms and differences in the proportions of the organs irradiated. As a result, the dose variations can clearly be seen in the dose volume histograms (DVHs) resulting from the two versions for some organs (figures 2–4). These show the proportion of the maximum dose received by different parts of the organ or tissue. The influence of these differences has been reported in various studies (Zhang et al 2012, Morant et al 2013, Zhang et al 2013) and discussed in Martin et al (2016).
Table 3. Organ and effective doses for the adult male and female ICRP phantoms resulting from the V1.6 and V2.5 head protocol (tables 1 and 2).
| Head | Male (mGy) | Female (mGy) | ||
|---|---|---|---|---|
| Organ/tissue | V1.6 | V2.5 | V1.6 | V2.5 |
| Lymph nodes in fielda | 5.45 | 5.75 | 7.02 | 7.26 |
| Salivary glands | 4.67 | 4.83 | 5.46 | 5.64 |
| Bone marrow in fielda | 4.13 | 4.52 | 6.15 | 6.64 |
| Lymph nodes in ET region | 3.96 | 4.23 | 5.11 | 5.29 |
| Skin in fielda | 3.43 | 3.71 | 3.65 | 3.92 |
| Brain | 3.14 | 3.55 | 3.43 | 3.87 |
| Extrathoracic (ET) region | 2.37 | 2.5 | 3.69 | 3.81 |
| Oral mucosa | 2.31 | 2.39 | 3.41 | 3.52 |
| Spinal cord | 1.7 | 1.83 | 2.22 | 2.34 |
| Eye | 1.15 | 1.2 | 1.1 | 1.15 |
| Eye lenses | 0.97 | 1.02 | 1.02 | 1.06 |
| Thyroid | 0.89 | 1.24 | 2.2 | 2.63 |
| Bone marrow (red) whole body | 0.75 | 0.82 | 1.39 | 1.55 |
| Oesophagus | 0.56 | 0.67 | 0.85 | 0.95 |
| Bone surface | 0.45 | 0.49 | 0.85 | 0.94 |
| Lymph nodes | 0.39 | 0.43 | 0.5 | 0.54 |
| Lymph nodes in TR region | 0.34 | 0.47 | 0.9 | 1.04 |
| Skin whole body | 0.29 | 0.32 | 0.33 | 0.36 |
| Muscle | 0.26 | 0.28 | 0.29 | 0.32 |
| Remainder tissues | 0.25 | 0.27 | 0.28 | 0.31 |
| Thymus | 0.22 | 0.27 | 0.35 | 0.41 |
| Lung | 0.09 | 0.1 | 0.17 | 0.2 |
| Heart | 0.05 | 0.06 | 0.1 | 0.11 |
| Breast | 0.02 | 0.02 | 0.07 | 0.07 |
| Spleen | 0.02 | 0.01 | 0.03 | 0.02 |
| Liver | 0.02 | 0.01 | 0.03 | 0.02 |
| Stomach | 0.01 | 0.01 | 0.02 | 0.01 |
| Adrenals | 0.01 | 0.01 | 0.02 | 0.01 |
| Effective dose (mSv) | 0.28 | 0.32 | 0.45 | 0.51 |
Note. Organ doses to the gall bladder, kidneys, pancreas, prostate/uterus, small intestine, gonads (testes/ovaries), and urinary bladder were each ≤0.01 mGy.
aSkin, bone marrow and lymph nodes inside the head region.Table 4. Organ and effective doses for the adult male and female ICRP phantoms resulting from the V1.6 and V2.5 thorax protocol (tables 1 and 2).
| Thorax | Male (mGy) | Female (mGy) | ||
|---|---|---|---|---|
| Organ/tissue | V1.6 | V2.5 | V1.6 | V2.5 |
| Thymus | 11.56 | 13.79 | 13.48 | 14.79 |
| Heart | 10.36 | 11.59 | 12.86 | 14.32 |
| Lung | 7.89 | 8.99 | 9.9 | 11.29 |
| Lymph nodes in TR region | 7.65 | 9.05 | 8.82 | 10.68 |
| Breast | 7.55 | 8.32 | 10.15 | 11.19 |
| Bone marrow in fielda | 6.8 | 8.17 | 8.33 | 9.97 |
| Oesophagus | 6.44 | 7.54 | 8.12 | 9.65 |
| Stomach | 3.57 | 4.5 | 2.8 | 3.64 |
| Spleen | 3.53 | 4.53 | 3.41 | 4.61 |
| Liver | 3.3 | 4.27 | 4.07 | 5.33 |
| Lymph nodes in fielda | 3.16 | 3.74 | 3.71 | 4.44 |
| Spinal cord | 3.16 | 3.81 | 3.74 | 4.5 |
| Lymph nodes | 2.76 | 3.27 | 3.11 | 3.71 |
| Bone marrow (red) whole body | 2.61 | 3.14 | 3.02 | 3.62 |
| Thyroid | 2.61 | 3.89 | 3.37 | 5.96 |
| Skin in fielda | 2.12 | 2.47 | 2.72 | 3.17 |
| Bone surface | 1.61 | 1.94 | 1.9 | 2.27 |
| Adrenals | 1.58 | 2.02 | 1.71 | 2.22 |
| Remainder tissues | 1.38 | 1.61 | 1.58 | 1.86 |
| Gall bladder | 1.29 | 1.67 | 1.56 | 2.05 |
| Muscle | 1.28 | 1.5 | 1.46 | 1.72 |
| Pancreas | 1.22 | 1.55 | 0.92 | 1.18 |
| Skin whole body | 1.22 | 1.43 | 1.49 | 1.74 |
| Lymph nodes in ET region | 0.89 | 1.1 | 1.08 | 1.34 |
| Kidneys | 0.84 | 1.06 | 0.85 | 1.09 |
| Colon | 0.42 | 0.54 | 0.1 | 0.13 |
| Salivary glands | 0.42 | 0.51 | 0.63 | 0.77 |
| Extrathoracic (ET) region | 0.34 | 0.41 | 0.55 | 0.68 |
| Small intestine | 0.34 | 0.43 | 0.28 | 0.35 |
| Oral mucosa | 0.32 | 0.38 | 0.67 | 0.81 |
| Eye lenses | 0.08 | 0.05 | 0.31 | 0.36 |
| Eye | 0.08 | 0.1 | 0.27 | 0.32 |
| Brain | 0.06 | 0.08 | 0.11 | 0.14 |
| Effective dose (mSv) | 3.34 | 3.92 | 3.97 | 4.70 |
Note. Organ doses to the gonads (testes/ovaries), prostate/uterus and bladder were each ≤0.01 mGy.
aSkin, bone marrow and lymph nodes inside the thorax region.Table 5. Organ and effective doses for the adult male and female ICRP phantoms resulting from the V1.6 and V2.5 pelvis protocol (tables 1 and 2).
| Pelvis | Male (mGy) | Female (mGy) | ||
|---|---|---|---|---|
| Organ/tissue | V1.6 | V2.5 | V1.6 | V2.5 |
| Urinary bladder | 44.75 | 51.38 | 48.35 | 54.75 |
| Prostate/uterus | 34.55 | 39.28 | 37.5 | 42.4 |
| Bone marrow in fielda | 27.98 | 32.26 | 32.1 | 37.03 |
| Small intestine | 15.01 | 18.21 | 24.85 | 28.74 |
| Bone marrow (red) whole body | 13.08 | 15.09 | 14.76 | 17.04 |
| Lymph nodes in fielda | 12.21 | 14.25 | 12.41 | 14.81 |
| Colon | 11.2 | 12.96 | 27.49 | 32.97 |
| Lymph nodes | 10.29 | 12.01 | 10.64 | 12.69 |
| Bone surface | 8.33 | 9.64 | 9.88 | 11.39 |
| Muscle | 6.81 | 8.07 | 7.87 | 9.29 |
| Remainder tissues | 6.8 | 8.08 | 8.24 | 9.72 |
| Skin in fielda | 5.4 | 6.35 | 6.06 | 7.14 |
| Skin whole body | 4.93 | 5.8 | 5.72 | 6.73 |
| Gonads (testes/ovaries) | 3.62 | 4.74 | 36.74 | 42.38 |
| Kidneys | 1.46 | 1.84 | 2.41 | 3.04 |
| Pancreas | 1.16 | 1.49 | 2.09 | 2.64 |
| Gall bladder | 0.83 | 1.07 | 1.14 | 1.44 |
| Adrenals | 0.62 | 0.74 | 0.96 | 1.19 |
| Stomach | 0.6 | 0.75 | 1.29 | 1.61 |
| Liver | 0.49 | 0.61 | 0.84 | 1.04 |
| Spleen | 0.35 | 0.41 | 0.73 | 0.89 |
| Spinal cord | 0.14 | 0.18 | 0.21 | 0.26 |
| Heart | 0.08 | 0.11 | 0.11 | 0.14 |
| Oesophagus | 0.07 | 0.08 | 0.08 | 0.1 |
| Lung | 0.05 | 0.07 | 0.09 | 0.12 |
| Breast | 0.03 | 0.04 | 0.04 | 0.05 |
| Lymph nodes in TR region | 0.02 | 0.03 | 0.03 | 0.04 |
| Thymus | 0.01 | 0.02 | 0.02 | 0.03 |
| Thyroid | 0.01 | 0.01 | 0.01 | 0.02 |
| Effective dose (mSv) | 6.05 | 7.05 | 11.30 | 13.19 |
Note. Organ doses to the extrathoracic (ET) region, oral mucosa, lymph nodes in et region, brain,salivary glands, eye lenses, and eye were each ≤0.01 mGy.
aSkin, bone marrow and lymph nodes inside the pelvic region.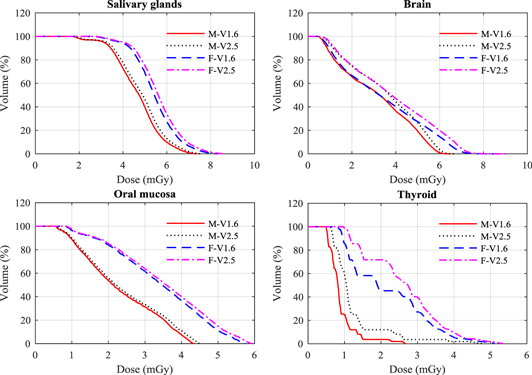
Figure 2. Dose volume histogram (DVH) for a selection of organs resulting from the V1.6 and V2.5 head protocol (tables 1 and 2) for the male (M) and female (F) ICRP phantoms.
Download figure:
Standard image High-resolution image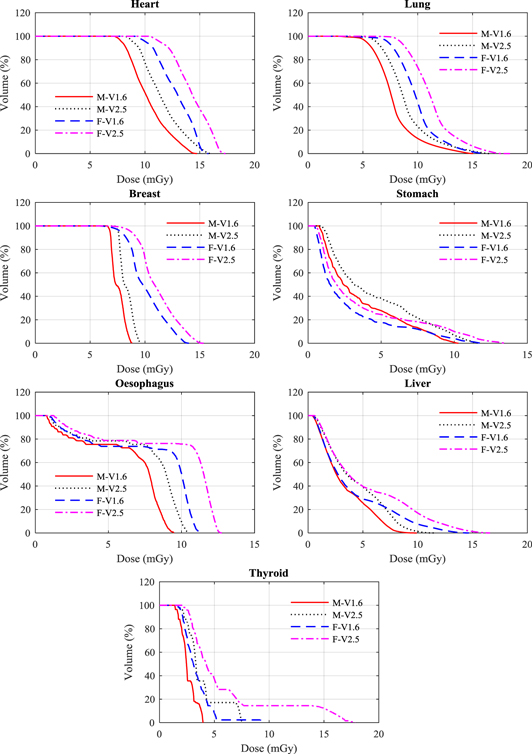
Figure 3. Dose volume histogram (DVH) for a selection of organs resulting from the V1.6 and V2.5 thorax protocol (tables 1 and 2) for the adult male (M) and female (F) ICRP phantoms.
Download figure:
Standard image High-resolution image
Figure 4. Dose volume histogram (DVH) for a selection of organs resulting from the V1.6 and V2.5 pelvis protocol (tables 1 and 2) for the adult male (M) and female (F) ICRP phantoms.
Download figure:
Standard image High-resolution image3.1.1. Head protocols
The organ with the largest difference in dose between the two software versions was the thyroid as the new field size includes more of both the male and female thyroids. The dose to the female thyroid is substantially greater, because the standard field size used covers a greater proportion of the thyroid (figure 2). The dose to the brain was 13% higher for both phantoms (table 3), resulting from the broadening of the field size to include a greater proportion of the brain tissue, while doses to the oral mucosa and salivary glands were only increased by 3%, primarily due to the increase in mAs.
3.1.2. Thorax protocols
Doses for the majority of organs in the female phantom were (2–53)% greater than for the male, because of the larger proportion in the smaller body that were included in the field (table 4, figure 3). The increases in organ doses for the new thorax protocols were higher than for other protocols. The thyroid dose increased by 49% for the male and 77% for the female phantom. The large increase for the female occurred because part of the phantom came within the primary beam, receiving a dose of >15 mGy (figure 3). The dose variations for organs that were fully inside the scan field of both versions such as lung, breast, heart, thymus, and oesophagus were between 10% and 19% for both phantoms. These variations were due largely to an extension of the field, which exposed a greater proportion of the organs (figure 3). Moreover, the use of larger scan fields with higher projection numbers and mAs values led to an increase in scattered radiation from the organs and tissues that were covered by the primary beam and those at the edge of the scan field. The impact of this is more obvious for the body scans than for those of the head due to the size of the trunk.
3.1.3. Pelvis protocols
The doses for the female colon and small intestine were substantially larger than for the male phantom with 40% of these organs in the female phantom receiving a dose of about 40 mGy (figure 4), but differences in other organs were less significant. Doses to the majority of organs rose with the increase in the field size of the new protocol (figure 4). Doses to the ovaries, prostate, uterus, and urinary bladder, which lay within the scan fields, increased by 15% or less.
The scan protocols implemented in V2.0 are identical to those of V2.5, except that the X1 position used for the body scan protocols was set to 33 mm compared to 34 mm in V2.5. Therefore, organ and effective doses estimated in this study with the V2.5 protocols are expected to be similar to those for V2.0 with insignificant differences for the body protocols.
3.2. Factors responsible for dose increases in the V2.5 protocols
Using the new protocols, exposure factors and field sizes have all been increased. The differences between V1.6 and V2.5 scan protocols are the numbers of projections, the mAs values, and the sizes of the scan fields used for each version.
3.2.1. Projection numbers and mAs
Although values of mAs per projection were reduced for the V2.5 protocols, the increase of projection numbers led to a rise in patient dose. The dose increases for organs that were within scan fields of all the protocols were within 2.5%, and this was commensurate with the overall increase in mAs. Figure 5 shows DVH comparisons for some organs using the V2.5 projection numbers and mAs values and the V1.6 values. The DVHs were obtained for the organs using the V2.5 field size, i.e. the field size was constant. This allows the influence of the increased number of projections and mAs on organ doses to be observed. Thus, the use of higher projection numbers led to an increased in organ doses because of the increase in mAs. More projections help directly to improve the image quality and provide better reconstruction of the volumetric images, but the choice of total mAs is a decision based on the balance between the level of image quality required and the dose to the patient. The image quality plays a crucial role for soft tissue image matching at some sites such as the abdominal region, and it reduces the time required for the treatment verification.
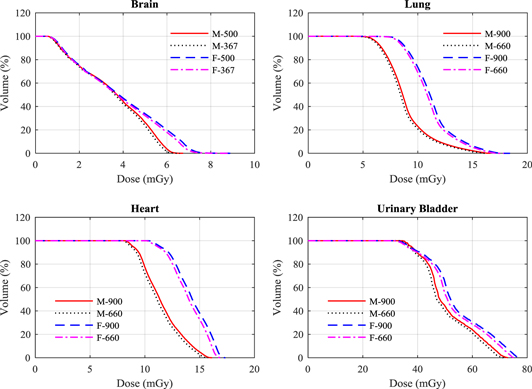
Figure 5. A comparison between DVH of some organs resulting from the head (brain), thorax (lung and heart), and pelvis (urinary baldder) scan protocols using the V2.5 projection numbers of 500 and 900 and the mAs values (table 2), and those used in V1.6 (367 and 660) (table 1) for the adult male (M) and female (F) ICRP phantoms.
Download figure:
Standard image High-resolution image3.2.2. Sizes of the scan fields
The scan field plays a major role in influencing the doses to some organs. Doses of organs that were irradiated fully or partially by the primary beam were increased by (1–10)%, (7–73)% and (11–19)% for the head, thorax, and pelvis protocols, respectively, for both phantoms because of the extension in the scan field. The doses within parts of several organs were raised and examples are shown in figure 6. This resulted in increases in effective dose for the head, thorax, and pelvis protocols by 0.04 mSv, 0.58 mSv, and 1.0 mSV for the male phantom, and by 0.06 mSv, 0.73 mSv, and 1.89 mSv for the female phantom, respectively for the three protocols.
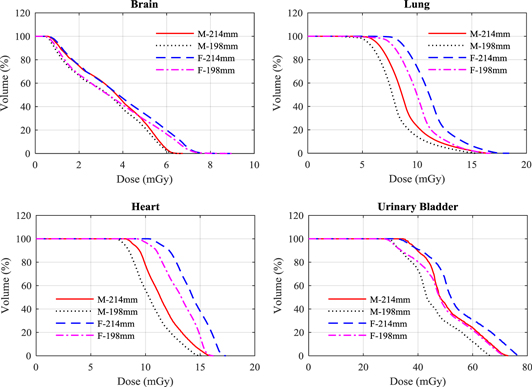
Figure 6. A comparison between DVH of some organs resulting from the head (brain), thorax (lung and heart), and pelvis (urinary baldder) scan protocols using the V2.5 scan field (table 2) and scan fields similar to those used in V1.6 protocols (table 1) for the adult male (M) and female (F) ICRP phantoms.
Download figure:
Standard image High-resolution image3.3. Influence of the scan parameters
The main aim of developing a new software version is to improve performance of the OBI system in terms of obtaining better image quality to aid the precision in setting up the patient on the treatment couch. The influence of new scan protocols that were released with new software versions (i.e. upgraded versions) on image quality and patient doses have been investigated in several studies (Ding et al 2010, Palm et al 2010, Dufek et al 2011, Ding and Munro 2013). These studies showed that the default scan protocols implemented in new versions usually played a role in improving the image quality and minimising organ and effective doses. The decrease in the patient dose resulted from using an improved image reconstruction algorithm and/or different scans parameters such as lower mAs and kV values. Cheng et al (2011), for example, found that the V1.4.13 scan protocols reduced the effective dose significantly compared to V1.4.11, where effective dose of head and pelvic scans were 9.4 mSv and 16 mSv for V1.4.11 compared to 1.6 mSv and 8.2 mSv for V1.4.13, respectively. These large reductions arose from the use of lower exposure parameters. The head scan of V1.4.11 was acquired with 125 kV and 1300 mAs over a full 360° rotation, whereas 100 kV and 720 mAs with a partial scan (200°) were used for that of V1.4.13. The value of the mAs was also decreased for the pelvic scan from 1300 to 680 mAs.
In the present case, however, the new scan protocols deliver a higher dose to the patient. The dose resulting from CBCT scans to adjacent organs and tissues is generally smaller than the dose delivered by the treatment beam (Siiskonen et al 2017), but the dose from imaging can be significant. For example, the equivalent dose to the colon resulting from treatment of a prostate cancer patient by 80 Gy using 18 MV photon 4-field 3D-conformal radiotherapy technique was 1.2 Gy for colon (Bezak et al 2017). While guidance of the treatment beam by CBCT scans from this study performed on a daily basis, i.e. a worst case scenario, during a treatment of 32 fractions could deliver an additional colon dose of 0.41 Gy to a male patient. The trade-off between risk and benefit from the CBCT scans should therefore be considered. Several recommendations can be suggested to optimise the dose involved in IGRT procedures, while keeping the image quality at an acceptable level that assists the practitioners in setting up the patient precisely and deliver the treatment beam.
3.3.1. Collimation
From investigation of the scan parameters presented in section (3.2), the main reason for the dose increase in the V2.5 protocols was found to be the extension of the scan field. This results in greater doses from primary and scattered radiation to nearby organs, some of which are radio-sensitive and so have higher weighting factors for effective dose. For example, extension of the scan field for the pelvis scan raised colon dose from 11.20 to 12.96 mGy for the male, and from 27.49 to 32.97 mGy for the female, which made a large contribution to increasing the effective dose by ∼17% for both phantoms (table 5). Similarly, lung, stomach, and breast are all radio-sensitive, and have an influence on the effective dose from the thorax scan (table 4).
Extension of the scan field is necessary for cases where there is a large tumour in the abdominal region in order to cover all therapy-relevant structures. By extending the scan field towards the patient's head, the spinal cord (bony structure) is included, which provides better markers for matching compared to soft tissues. On the other hand, for cases treated with the stereotactic ablative radiotherapy technique targeting a small tumour on the lung or prostate, fiducial markers can be inserted into the tumour and used for matching with a small field size. A patient-specific field size can be used with the OBI system based on using four dynamic blades and tube current modulation (Parsons and Robar 2016). The dynamic blades adjust the size of the scan field during CBCT scans acquisition based on a volume of interest specified by the planner. The use of this system enhanced contrast-to-noise ratio by a factor of ∼2.2 and reduced the scan dose by up to 80% as compared to the static blades.
In contrast to the OBI system, the XVI system is provided with a series of lead collimators of different sizes known as collimator cassettes identified by letters (S, M, or L) and numbers (10, 15, or 20), where the letters and numbers are used to identify extension of the field in the lateral and axial directions, respectively (Spezi et al 2009). The choice of collimator is based on the clinical case and size of the patient, and can reduce the imaging dose for small patients or patients with smaller tumours. Effective doses from XVI scans have been reported to vary over the ranges (0.03–0.09) mSv, (0.64–7.88) mSv, and (0.16–7.60) mSv for head and neck, thorax, and pelvic scans, respectively (Marchant and Joshi 2017). The scan parameters, including mAs and size of the scan field used for XVI protocols, differ from those used for the OBI. The OBI system allows the development of new scan protocols, so establishing small, medium, and large fields, for each site taking into account the clinical needs for the treatment as well as the patient size should be considered.
3.3.2. Reduction of mAs value
Default scan protocols implemented in the OBI system were provided for scans of the head, thorax and pelvic regions. The abdominal region is usually scanned with the pelvis protocol (tables 1 and 2) as the thorax protocol does not provide images of good quality for matching. Therefore, a specific protocol has been created for the abdominal region, based on the pelvic protocol (table 2), in which the mAs has been reduced from 1080 to 810 mAs, but the projection numbers maintained at 900 that delivered 0.9 mAs per projection. This still provides the level of good image quality required in the lower attenuation abdominal organs and tissues, but reduces doses to the colon and stomach. Table 6 lists organ doses resulting from abdominal scans performed with the abdomen protocol (810 mAs) and the default pelvis protocol (1080 mAs). For both scans, the centre of the scan was set up at the mid-point of the pancreas, the position commonly used for setting up pancreatic cancer cases. Effective doses from the abdomen protocol are 10.9 mSv and 11.2 mSv for male and female phantoms, respectively, compared to 14.4 mSv and 14.9 mSv with the pelvic protocol. In addition a reduction in the mAs values used for scans routinely, particularly for scans that are repeated at regular intervals on individual patients, could be achieved through application of patient specific protocols.
Table 6. Organ and effective doses for the ICRP adult male and female phantoms resulting from using the abdomen protocol with (810 mAs) and the default pelvis protocol with (1080 mAs) (table 2). Centre of both scans was set up at mid of pancreas of both phantoms.
| Abdomen | Male (mGy) | Female (mGy) | ||
|---|---|---|---|---|
| Organ/tissue | Abdomen | Pelvis | Abdomen | Pelvis |
| Stomach | 31.68 | 42.24 | 39.24 | 52.31 |
| Pancreas | 31.19 | 41.58 | 41.75 | 55.67 |
| Kidneys | 28.18 | 37.57 | 34.8 | 46.4 |
| Gall bladder | 27.54 | 36.72 | 37.09 | 49.45 |
| Adrenals | 26.82 | 35.76 | 33.05 | 44.07 |
| Liver | 26.07 | 34.76 | 32.64 | 43.52 |
| Colon | 22.03 | 29.38 | 15 | 20 |
| Spleen | 21.69 | 28.92 | 27.87 | 37.17 |
| Bone marrow in fielda | 19.24 | 25.66 | 29.79 | 39.72 |
| Small intestine | 17.38 | 23.18 | 21.38 | 28.5 |
| Lymph nodes in fielda | 13.12 | 17.5 | 14.57 | 19.43 |
| Heart | 10.84 | 14.45 | 7.6 | 10.14 |
| Lymph nodes | 10.79 | 14.39 | 11.44 | 15.25 |
| Spinal cord | 8.04 | 10.71 | 8.59 | 11.45 |
| Bone marrow (red) whole body | 7.63 | 10.17 | 9.62 | 12.82 |
| Skin in fielda | 7.63 | 10.17 | 9.1 | 12.13 |
| Oesophagus | 7.07 | 9.43 | 5.81 | 7.75 |
| Lung | 6.29 | 8.38 | 5.34 | 7.12 |
| Bone surface | 5.38 | 7.17 | 6.79 | 9.05 |
| Remainder tissues | 5.27 | 7.03 | 6.53 | 8.7 |
| Breast | 4.68 | 6.25 | 2.64 | 3.52 |
| Muscle | 4.45 | 5.93 | 5.14 | 6.85 |
| Skin whole body | 4.31 | 5.75 | 4.93 | 6.58 |
| Lymph nodes in TR region | 2.24 | 2.98 | 1.85 | 2.47 |
| Thymus | 1.46 | 1.94 | 1.35 | 1.81 |
| Thyroid | 0.84 | 1.12 | 0.66 | 0.88 |
| Urinary bladder | 0.75 | 1 | 0.97 | 1.3 |
| Lymph nodes in ET region | 0.27 | 0.36 | 0.17 | 0.22 |
| Prostate/Uterus | 0.26 | 0.35 | 0.86 | 1.15 |
| Extrathoracic (ET) region | 0.09 | 0.12 | 0.09 | 0.12 |
| Oral mucosa | 0.08 | 0.11 | 0.12 | 0.17 |
| Salivary glands | 0.08 | 0.11 | 0.09 | 0.12 |
| Eye lenses | 0.03 | 0.04 | 0.04 | 0.06 |
| Eye | 0.03 | 0.04 | 0.06 | 0.08 |
| Gonads (testes/ovaries) | 0.02 | 0.03 | 0.92 | 1.23 |
| Brain | 0.01 | 0.02 | 0.02 | 0.02 |
| Effective dose (mSv) | 10.80 | 14.40 | 11.20 | 14.93 |
aSkin, bone marrow and lymph nodes inside the abdomen region.
3.3.3. Partial rotation technique
Use of the posterior partial rotation (200°) technique provides images that are sufficient for matching for head and neck patients and reduces the doses to eyes. Figure 7 shows a comparison between DVH for the eye and eye lens using the partial and full (360°) rotations. The DVHs show that the dose distribution across the eyes is relatively uniform in both cases, but the doses to the eye lenses are less than 30% of those that would be delivered from the full rotation. Figure 8 shows the change in dose distribution over the organs and tissues in a selected slice of the head resulting from partial figure 8(a) and full figure 8(b) head scans. In order to compare between the different techniques, doses of all voxels for both scans were normalised with respect to the maximum voxel dose of the partial scan in the selected slice. Although the maximum voxel dose of the full scan is lower by a factor of 0.67, the partial technique reduced eye dose to about one third. Eye lens doses from the full rotation scan were 3.68 mGy for male and 3.62 mGy for female, compared to 0.97 mGy, and 1.02 mGy, respectively, from the partial rotation (table 3).
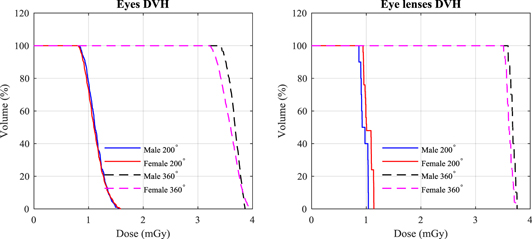
Figure 7. Dose volume histogram (DVH) of eye and eye lens using head and neck scan for the adult male (M) and female (F) ICRP phantoms using the partial (200°) and full (360°) rotation scans.
Download figure:
Standard image High-resolution image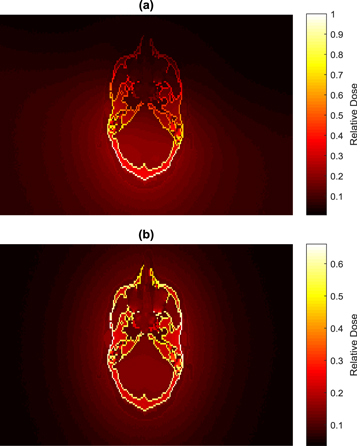
Figure 8. A comparsion between dose disbributions resulting from the head scan over a selected slice of the male head using (a) a partial rotation (200°) and (b) a full rotation (360°). Doses of all voxels were noramlized with respected to the maxium value in (a).
Download figure:
Standard image High-resolution image
3.3.4. Inclusion of the imaging dose with the total treatment dose
The additional dose from imaging through regular scans could be included in the treatment dose. This would require calculation of organ doses by the treatment planning systems and inclusion of the values as a part of the daily treatment fraction. Although this approach is possible for MV CBCT scans, the capability of most treatment planning systems in calculating doses in the kV range is limited, except for the Philips Pinnacle system (Alaei and Spezi 2012, Dzierma et al 2014). The results presented in this study and other studies published in the literature and summarised in (Alaei and Spezi 2015) can be utilised in giving a better understanding of the additional dose from imaging received by patients during their course of treatment. The results should aid in drawing up appropriate treatment protocols with multiple CBCT scans, and allow the practitioners to compare the dose consequences of different imaging modalities and protocols used for IGRT procedures.
4. Conclusion
Monte Carlo simulations were used to assess organ and effective doses resulting from default scan protocols (head, thorax, and pelvis) implemented in V1.6 and V2.5 of the Varian OBI system used in conjunction with IGRT. The scan doses resulting from V2.5 protocols were higher than those of the previous version. The effective doses for the V2.5 head, thorax, and pelvis protocols were higher than those of the previous versions by 14%, 17%, and 16%, respectively, for the male phantom, and by 13%, 18%, and 17%, for the female phantom. The extension of the scan field was the main factor responsible for these increases. If such changes in protocols are not reviewed and optimised, there is a risk that dose levels will gradually creep upwards to obtain better images, without considering optimisation. Although the field size extension increases the imaging dose, it does play a vital role in determining the precision with which practitioners can set up patient treatments. However, use of field sizes tailored to specific patients, reduction of the mAs for scans of the abdominal region, use of the posterior partial rotation, and inclusion of the imaging dose into the treatment dose should be considered for optimisation of the patient dose when using CBCT scans for IGRT procedures.
Acknowledgments
The authors wish to acknowledge SANAM team at KACST for their support in installing and running MC codes in the system. The authors wish also to acknowledge Blake Walters of the National Research Council (NRC) in Canada for his support in editing the DOSXYZnrc code to define all the ICRP phantoms media, and Mr Ahmad Nobah of the King Faisal Specialist Hospital & Research Center (KFSHRC) in Saudi Arabia for providing parameters of the V2.0 scan protocols and for the discussion.