

Abstract
In this study, a new superconducting quantum interference device (SQUID) biomagnetic measurement system known as magnetospinogram (MSG) is developed. The MSG system is used for observation of a weak magnetic field distribution induced by the neural activity of the spinal cord over the body surface. The current source reconstruction for the observed magnetic field distribution provides noninvasive functional imaging of the spinal cord, which enables medical personnel to diagnose spinal cord diseases more accurately. The MSG system is equipped with a uniquely shaped cryostat and a sensor array of vector-type SQUID gradiometers that are designed to detect the magnetic field from deep sources across a narrow observation area over the body surface of supine subjects. The latest prototype of the MSG system is already applied in clinical studies to develop a diagnosis protocol for spinal cord diseases. Advancements in hardware and software for MSG signal processing and cryogenic components aid in effectively suppressing external magnetic field noise and reducing the cost of liquid helium that act as barriers with respect to the introduction of the MSG system to hospitals. The application of the MSG system is extended to various biomagnetic applications in addition to spinal cord functional imaging given the advantages of the MSG system for investigating deep sources. The study also includes a report on the recent advancements of the SQUID MSG system including its peripheral technologies and wide-spread applications.
Export citation and abstract BibTeX RIS
1. Introduction
In this study, a superconducting quantum interference device (SQUID) biomagnetic measurement system termed the magnetospinogram (MSG) system is developed to observe spinal cord neural activity. The MSG system is used to noninvasively observe the weak magnetic field distribution induced by intra-cellular and extra-cellular currents of the spinal cord neurons over the body surface. The current source reconstruction for the observed magnetic field distribution provides functional imaging of the spinal cord, which enables medical personnel to diagnose spinal cord diseases more accurately and increases the effectiveness of surgical operations related to the spinal cord.
Physicians, especially in the fields of neurology and orthopedic surgery and specifically those examining spinal cord degenerative diseases such as myelopathy, have emphasized the need for noninvasive diagnosis methods for spinal cords. Morphological clinical information is readily obtained by magnetic resonance imaging (MRI). However, a case can be clinically asymptomatic even if spinal cord compression is found in the MRI [1]. Therefore, functional information in conjunction with morphological imaging is significant effective treatment. Recent advancements of the MR techniques, such as functional MRI and diffusion tensor imaging, provide functional information as well as the morphological imaging [2]. However, the temporal resolution of these imaging methods corresponds to the order of seconds. It is insufficient for the diagnosis of spinal cord diseases because a sub-millisecond-order temporal resolution is required for precise observation of neural signal conduction along a spinal cord. Functional information based on electrophysiological measurement is essential for temporal resolution.
Generally, electric potential measurement is often applied to obtain electrophysiological information. However, it is not possible to apply conventional electric potential measurements using surface electrodes to spinal cord diagnosis since sufficient spatial resolution cannot be obtained. Surface potentials are affected by the conductivities of the tissues surrounding the spinal cord, and thus the distribution of the surface potentials is distorted and becomes vague. Conduction velocity is a very important piece of information that should be obtained by functional testing. However, the measurement of conduction velocity by the surface potential measurement is not accurate [3]. Spinal cord evoked potential (SCEP) measurement using epidural catheter electrodes is an existing established functional diagnosis of the spinal cord that provides accurate conduction velocity [4]. The catheter electrodes inserted into the spinal canal directly detect the electric potential evoked by the neural activity immediately adjacent to the spinal cord. The signal intensity is relatively large, and an accurate conduction velocity is obtained in contrast with the measurement of the surface potential. However, the insertion of the epidural catheter electrodes is highly invasive, and it is important for medical personnel to possess considerable skills. Hence, SCEP measurement is not a commonly used diagnostic method in hospitals.
Biomagnetic measurement is a promising method for the functional imaging of the spinal cord with respect to noninvasiveness and high temporal/spatial resolution [5, 6]. Highly sensitive flux sensors to detect the signals induced by neural activity are arranged outside the body such that they are noninvasive. Furthermore, the magnetic permeability of tissues is almost identical to the vacuum or water permeability. Consequently, the magnetic distribution of the body surface is not distorted by internal anatomical structures as opposed to that in the case of surface electric potential measurement. Additionally, they possess a sufficient temporal resolution to observe the velocity of the neural signals conducted along the spinal cord.
Magnetoneurograms (MNGs), including MSG, magnetically observe neural signal propagation along the axon. The development of MNG has a long history spanning a few decades that originated in 1980 by using a toroidal transformer coupled with a SQUID to record the nerve activity of a frog [7]. In conjunction with the development of SQUID technologies, several reports focused on biomagnetic measurements from the cervical spinal cord [8–10]. However, a limited number of efforts focused on applying spinal cord magnetic field measurement for clinical use in practice. The intensity of the MSG signals observed at the body surface is considerably small because the source of the signals is located relatively deep inside the body. Therefore, it is difficult for conventional SQUID biomagnetometer systems to acquire reproducible signals with sufficient signal-to-noise (S/N) ratios.
The authors of the present study have focused on the development of SQUID systems for MSG and MNG of peripheral nerves since 1999. A previous study involved animal testing using a single channel SQUID system [6]. Scanning was performed at multiple points over the cervix to clearly observe the transition of the magnetic field distribution that exhibited a quadrupole-like pattern, and the possibility of using MSG for clinical use was indicated. This was followed by other studies that focused on the development of the SQUID system for the MSG, and consequently the measurement system became increasingly sophisticated. The liquid helium (LHe) cryostat was redesigned to optimize the detection of the spinal cord signals from the back of the neck, and the SQUID sensor array was improved for step-wise broadening of the observation area. Additionally, MSG systems applicable to human subjects in a reclining position were developed in the mid 2000s [11, 12]. This was followed by expanding the scale of the sensor array to more than one hundred channels, and the system was optimized for subjects lying in a supine position within the scope of medical use in hospitals [13–15]. The development of the measurement system was accompanied with the evolution of algorithms to analyze the obtained MSG data. The spatial resolution of source reconstruction is rapidly improving. The MSG system is applicable to clinical studies and more than one hundred MSG data sets were collected to-date from actual patients suffering from the spinal cord degenerative diseases and normal controls due to the advancement of both hardware and software.
There is also a recent focus on reducing the cost for the MSG measurement. LHe consumption is necessary to keep SQUIDs in the superconducting state, and it increases the running cost of the system. A massive magnetically shielded room (MSR) is necessary for the reduction of external magnetic field noise; it increases the initial cost of the system. These costs prevent the widespread use of MSG in hospitals for cases involving conventional biomagnetic measurements such as magnetoencephalograms (MEGs) or magnetocardiograms (MCGs).
Recent research on the MSG system focused on solving these cost problems. The closed cycle helium re-condensation system was integrated to the MSG system to reduce the LHe cost [16]. The SQUID electronics were improved to reduce the effect of circumstance magnetic noise in real time by using the signals from reference channels [15].
In this study, recent advancements in the development of MSG systems are reviewed, and their widely spread applications are discussed.
2. Instrumentation
In this section, the latest prototype of the MSG system is described in detail. Figure 1 shows the system configuration. The configuration is similar to a conventional SQUID biomagnetic measurement system such as MEG or MCG. However, it is optimized to detect magnetic field signals over the body surface from the backs of subjects in a supine position. It is characterized by the uniquely shaped cryostat and the array of vector-type SQUID gradiometric flux sensors. The x-ray irradiator in the MSR is effective in obtaining the anatomical image around the spinal cord on site.

Figure 1. System configuration of the MSG system.
Download figure:
Standard image High-resolution image2.1. SQUID sensor array
The system was equipped with an array of 44 vector-type SQUID gradiometers arranged in an area of 160 mm × 110 mm. The sensors were positioned along the cylindrical surface with a radius of 200 mm. The sensor interval in the x-direction was in the range of 20–25 mm and it increased towards the side. The interval in the y-direction corresponded to 22 mm. The structure and appearance of the sensor array is shown in figure 2. The position, orientation, and sensitivity of the each SQUID gradiometer were calibrated following cooling using a multiple coil array in the same manner as that described in a previous study [17].
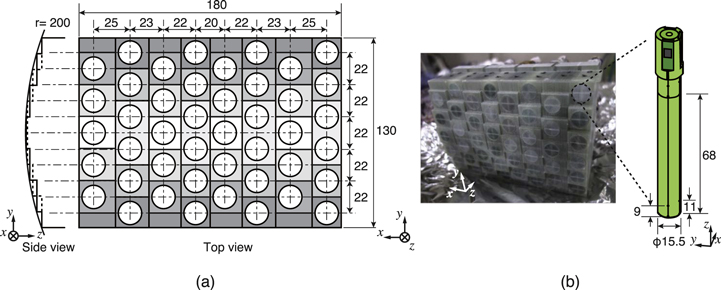
Figure 2. (a) Structure and dimension of the sensor array, (b) appearance of the sensor array and the dimension of a vector-type SQUID gradiometer. Reproduced with permission from [16]. Copyright © 2017, IEEE.
Download figure:
Standard image High-resolution imageThe vector-type SQUID gradiometer was equipped with an axial-type and two planar-type 1st order gradiometric pickup coils. The coils were oriented perpendicular to each another and combined into a single cylindrical bobbin. Each pickup coil was coupled with an input coil of an individual LTS-SQUID termed Ketchen type [18]. Three SQUIDs immediately detect three orthogonal components of the magnetic field including both radial and tangential components to the body surface. This is effective in expanding the magnetic field information obtained from a narrow observation area such as the neck. The baseline length of the gradiometric pickup coils corresponds to 68 mm in consideration of the distance between the sensor array and the deep sources of the spinal cord measurement. The diameter of the axial-type gradiometric pickup coil corresponds to 15.5 mm, and the effective area of the planar-type gradiometric pickup coil corresponds to 9 mm × 15 mm or 11 mm × 15 mm. The typical noise level of the SQUID gradiometers was less than 4 fT/Hz1/2 in the white region.
Each SQUID sensor was driven by a triple feedback flux-locked loop (FLL) circuit [14]. Two additional feedback loops were appended to the conventional FLL with the direct offset integration technique (DOIT) [19]. In the triple feedback FLL, the entire frequency band of interest was essentially divided into three sub-bands, namely Y1: 10 Hz–12 kHz, Y2: 0.16 Hz–10 Hz, and Y3: DC–0.16 Hz. The MSG measurement was conducted to observe the axonal conduction along the spinal cord. The frequency band of the MSG signals usually exceeds 100 Hz. Therefore, the output of the first FLL, with a frequency band that corresponds to Y1, was adopted, and the lower frequency band was discarded. When the signals resulting from synaptic activity or other types of biomagnetic signals with lower frequency band were targeted, the output of the second FLL was added to the first output, and the FLL output was extended to obtain the combined band Y1 + Y2: 0.16 Hz–12 kHz. The variable frequency band characteristics were effective in expanding the applications of the MSG system.
2.2. Cryostat
The cryostat of the MSG system is a vessel with a double-layered structure composed of glass fiber reinforced plastic to avoid the influence of thermal noise from the metal material. It possesses a unique shape to obtain the magnetic field over the body surface from the back of the subject in the supine position. Figure 3 shows the appearance and inner structure of the cryostat. It was composed of a cylindrical main body to reserve LHe and a horizontal radial protrusion on its side surface. As shown in figure 3(c), the sensor array in a vertically upward direction was implemented in the protrusion along its upper surface, which was cylindrically curved in addition to the sensor array itself. The curvature of the upper surface was effective as it fit the sensor array tightly to the back of the subject's neck and prevented deformity of the protrusion by vacuum evacuation of the thermal insulation layer. In the case of the cervical MSG measurement, subjects lay on a measurement table with their heads running off the edge and necks on the upper surface of the protrusion as shown in figure 1.
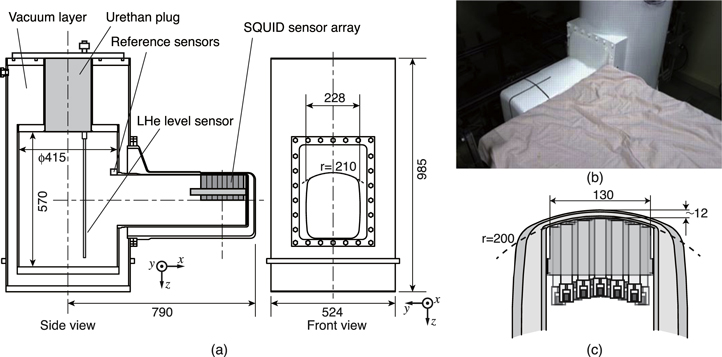
Figure 3. (a) Inner structure and dimension of the cryostat, (b) appearance of the cryostat, (c) cross sectional image of the protrusion including the sensor array. Reproduced with permission from [16]. Copyright © 2017, IEEE.
Download figure:
Standard image High-resolution imageThe capacity of the LHe corresponds to 92 l. The consumption rate of the LHe corresponded to approximately 11 liters per day. The SQUID could retain their superconducting state even if the LHe level decreased below the position of the sensors due to the internal thermal homogeneity of the cryostat. The interval for LHe refilling exceeded seven days.
2.3. Integration with LHe re-condensing
In spite of several attempts to reduce the LHe consumption by improving the cryostat itself, the system continued to consume a large amount of LHe. The high cost of LHe prevents the widespread use of the MSG system in hospitals.
In a recent study, a closed-cycle LHe re-condensation unit was combined with the MSG system [16] to address the LHe cost problem. Similar attempts to reduce the running cost of the MEG systems using LHe re-condensation have been recently reported [20–22]. One such system is already commercially available [22]. Our approach is characterized by two main features. The first feature is that nonstop operation is possible even during signal acquisition, owing to low operation noise. The second feature is that the re-condensation system can be integrated without modifying the existing SQUID system.
A single pulse-tube cryocooler was applied to provide more power efficiency and a simple structure. Figure 4 shows the system configuration integrated with the He re-condensing unit. A helium closed-cycle was placed between the MSG cryostat and the re-condensing unit. The gaseous helium evaporating from the MSG cryostat was forced to flow and transferred to the cryocooling chamber using a diaphragm circulation pump. Two buffer tanks were inserted to the gas line to suppress pressure pulsation of the gas in the tubes. Gaseous helium at room temperature was re-condensed in the cryocooling chamber. This was followed by re-supplying the condensed LHe back to the MSG cryostat through a low-loss transfer tube.

Figure 4. The helium re-condensation unit introduced to the MSG system. Reproduced with permission from [16]. Copyright © 2017, IEEE.
Download figure:
Standard image High-resolution imageThe helium was re-condensed in the cryocooling chamber using a pulse-tube cryocooler with a cooling power of 1.0 W at 4.2 K (SRP-082B2-F70LP; SHI, Japan). The power consumption of the compressor that drove the cryocooler was less than 8 kW. The pressure of the gaseous helium was monitored at the outlet of the MSG cryostat and inlet to the cryocooling chamber. A heater placed in the cryocooling chamber was operated for a short period when the pressure in the MSG cryostat reduced below 3 kPa. The pressure in the cryocooling chamber was increased to prevent it from becoming negative. The pressure at the inlet of the cryocooling chamber was maintained between 3 and 5 kPa when the system was stably operated. The resulting maximum re-condensation capacity was estimated as 14.4 l d−1. The LHe level in the cryostat became stable and maintained at a constant level following the balancing of the LHe evaporation and re-condensation were balanced. The MSG system could be maintained in operation for more than nine months without refilling LHe. Almost all the helium could be recycled.
The cryocooling chamber was immediately adjacent to the MSR. The distance between the MSG cryostat and the cryocooling chamber as determined by the length of the low-loss transfer tube corresponded to approximately 1.5 m across the wall of the MSR. The transfer tube and the stainless-steel exhaust tube connected from the MSG cryostat were electrically isolated from the cryocooler system using a plastic insulation flange and plastic joint parts and were grounded to the radio frequency shielding layer of the MSR to prevent the intrusion of the electric noise from the cryocooler system. The compressor driving the cryocooler, a chiller providing coolant water to the compressor, and the circulation pump that caused the gaseous helium to flow were the sources of the acoustic, vibration and magnetic noises. Therefore, they were positioned outside the building at a distance of 4–5 m from the MSR wall. This distance was effective in reducing those noises.
As shown in figure 5, the intensity of the power line noise and white noise level when the cryocooling system was operated did not indicate significant differences from those recorded when the cryocooling system was not operated. However, in the frequency band less than 50 Hz, the noise originating from the cryocooling system operation was detected as indicated by arrows. The origin of these peaks is considered as the mechanical vibration of the gantry that is necessary to support the cryocooling chamber and the microseism of gaseous helium generated by the diaphragm circulation pump.
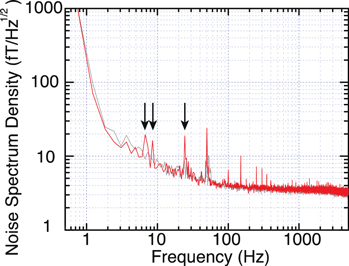
Figure 5. Noise spectrum density recorded during the re-condensing system operation (red) and during the re-condensing system suspension (gray). The peaks considered as the noise from the re-condensation system were indicated by arrows.
Download figure:
Standard image High-resolution imageIn the case of the MSG measurement, the lower end of the frequency band of the target signals typically exceeds 100 Hz. The noise due to the cryocooling operation described above does not overlap with the band of target signals and is removed using simple high pass filters (HPFs). Therefore, the signal quality of the MSG measurement does not deteriorate even if the cryocooling system causes an increase in the noise.
2.4. Noise reduction using reference magnetic sensors
The intensities of the MSG signals are considerably small, and the measurement is usually performed in a MSR similar to that used in typical biomagnetic measurements such as MEG or MCG [5, 23]. The gradiometric pickup coil is also effective in reducing the disturbance from the circumstance magnetic noise. However, residual noise, especially in the ultra-low frequency band zone less than 1 Hz, often continues to be high when the site is located near transportation systems, such as railways, and especially in urban area.
With respect to the detection of signals accompanied with action potential propagating along the spinal cord, the lower end of the frequency band exceeds 100 Hz, and HPFs can remove this type of ultra-low frequency noise. The high frequency band characteristic (Y1) of the FLL circuit described in the section 2.1 helps in also reducing the effect of the low frequency noise as well.
However, with respect to the signals resulting from synaptic activity or the other kind of biomagnetic signals with lower frequency band, it is not possible to apply HPFs because their frequency bands overlap with the circumstance noise. In such cases, noise reduction using reference sensors to monitor the circumstance magnetic noise is effective.
Generally, the residual sensitivity of a gradiometer to circumstance noise is caused by an imperfect coil balance of the pickup coil. This can be compensated by a linear combination of in-phase magnetic field components that is detected by a 3-axis magnetometers [24]. The MSG system is equipped with a set of reference sensors composed of three SQUID magnetometers oriented perpendicularly to each other combined to form a cubic structure. They are located away from the observation surface of the sensor array such that the biomagnetic signals are not detected.
Noise reduction by off-line signal processing, such as continuously adjusted least-squares method [25], is effective when the outputs from both the gradiometers for biomagnetic signals as well as the reference sensors to detect circumstance noise are recorded simultaneously. However, the fluctuation of the signals often exceeds the dynamic range of the digital data recording when the low frequency noise is extremely large, and the signals become saturated. In this case, off-line signal processing is not helpful. It is necessary to reduce the gain of the amplifiers to avoid signal saturation, and subsequently the resolution for the target signals is spoiled.
In the study, another noise reduction method using reference sensors was proposed to reduce the circumstance noise to avoid signal saturation prior to digital data recording. The in-phase component of the ultra-low frequency noise included in the output of each SQUID gradiometer was synthesized as a linear combination of the outputs from the reference sensors. It was provided directly to the feedback coil of individual SQUID gradiometer to compensate for the noise. This was termed as a 'direct open loop in-phase component input' (DOLPHIN) [15]. The block diagram of DOLPHIN for a gradiometer is shown in figure 6. The dashed line square represents the reference sensor system. The output of each reference sensor was multiplied by a weight coefficient with programmable gain amplifiers. The sum of the three weighted components was directly input to the feedback coil of the SQUID gradiometer in conjunction with the outputs of the FLL integrators. The weight coefficients were obtained using a least-squares method as well as the off-line signal processing [25]. To effectively reduce the ultra-low frequency noise, the frequency characteristic of the FLL for the reference sensors was limited to DC–10 Hz such that the white noise and the other noise components were not increased by injection of the reference sensor signals.
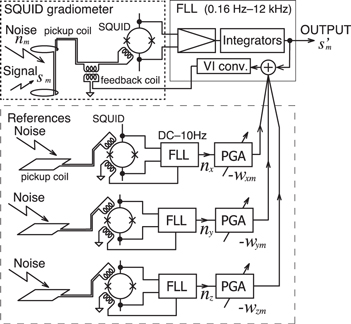
Figure 6. Block diagram of the direct open loop in-phase input method (DOLPHIN). Reproduced with permission from [15]. Copyright © 2015, IEEE.
Download figure:
Standard image High-resolution imageThe background noise were recorded under two conditions with and without DOLPHIN to examine the performance of DOLPHIN. Each recording was performed for 30 s without a subject in the MSR with a shielding factor of 40 dB@1 Hz at the Tokyo Medical and Dental University hospital. The circumstance noise was mainly attributed to a busy railway system approximately 180 m away from the MSR, and the maximum fluctuation without DOLPHIN corresponded to approximately 200 pTpp. Figure 7 shows FFT plots depicting the effect of DOLPHIN to reduce ultra-low frequency noise. As indicated by these plots, DOLPHIN reduced the noise at 1 Hz by more than 17 dB.
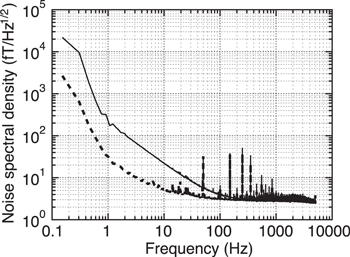
Figure 7. Effect of the DOLPHIN. The solid line and dotted line correspond to the plots without and with DOLPHIN, respectively. Reproduced with permission from [15]. Copyright © 2015, IEEE.
Download figure:
Standard image High-resolution image3. Analysis of the MSG data
3.1. Artifact removal
The intensity of the MSG signals was relatively smaller than that of the typical biomagnetic signals such that it was necessary to average thousands of neural responses evoked by repetitive same electric stimulation to improve the S/N ratio. Averaging reduces uncorrelated noise to the repetition rate by the square root of the number of samples. However, the artifact originated from the electric stimulation inevitably remains because it coincides with the repetition rate. The stimulation artifact typically corresponds to a sharp spike with an amplitude that exceeds hundred times the MSG signals. The spike is accompanied with a tail because of the characteristics of a HPF. The duration of the tail is based on the cutoff frequency of the HPF and is more than several milliseconds. In the study, the target signals were distorted by the tail of the large stimulation artifacts especially when the stimulus point was close to the observation area. Therefore, it was necessary to separate the stimulus point from the sensor array to shift the peak latency of the response longer. For example, it was necessary for the stimulus point to be located at the wrist and not the elbow when the cervical MSG signals evoked by the median nerve stimulation were measured. This was necessary to avoid the overlap of the artifact tail with the response.
However, it is necessary for the stimulus point to be located close to the observation area to obtain a large intensity of the MSG signals because the signals induced by the electric stimulation dispersed with propagation along the nerve route. In the study, two signal processing algorithms based on spatial filter technique were proposed to suppress the artifact from the recorded MSG data and extract large MSG signals.
The first algorithm is known as the common-mode subspace projection (CSP) [26]. The CSP consists of two steps. In the study, first, the artifact data that contained only the artifacts was obtained. To obtain the artifact data, a stimulus procedure (including the stimulus intensity and repetition rate) that was identical to the actual MSG measurement was applied. However, only the electrode position was set off from the nerve by a distance equal to a few centimeters. In the second step, orthonormal basis of the interference subspace was estimated based on artifact data, and then the obtained MSG data was projected on the subspace orthogonal to the interference subspace.
The second algorithm is known as dual signal subspace projection (DSSP) [27]. The DSSP does not require artifact data to estimate the interference subspace in advance when compared to the CSP. The DSSP is based on two definitions of the signal subspace, namely as the spatial-domain signal subspace and the temporal-domain signal subspace. In the study, the algorithm first projected the columns of the measured data matrix inside and outside the spatial-domain signal subspace. Two 'projected' data matrices were obtained. Next, the intersection of the row spans of the two 'projected' data matrices was considered as an estimate of the temporal-domain interference subspace. The obtained MSG data was projected on the subspace orthogonal to the interference subspace as well as the CSP. The DSSP was used to shorten the total time for each MSG measurement when compared to that of the CSP because the time for recording the artifact data was not required. However, the CSP continued to be more powerful than the DSSP to extract the target signals when the distance between the stimulus point and the observation area was too short and consequently the responses completely masked by the artifact.
Detailed explanations of the CSP and DSSP can be found in previous studies [26, 27]. Figure 8 shows the effect of the artifact removal. The artifact tail was effectively suppressed between 0 and 6 ms, and the MSG signals were rectified by using the DSSP.

Figure 8. Effect of the artifact removal for the cervical MSG measurement using the median nerve stimulation at the elbow. (a) The waveforms before application of the DSSP, (b) after application of the DSSP.
Download figure:
Standard image High-resolution image3.2. Co-registration to anatomical image
Magnetic source analysis and further investigation of the lesion localization of the spinal cord diseases necessitated revealing the positions of each sensor relative to the anatomical structure of the subject. In the case of the MEG, the anatomical image of the brain was obtained using a magnetic resonance image (MRI). The coordination system of the MEG sensor array was co-registered to the MRI coordination system, and the estimated magnetic source information was superimposed on the MR image. However, in the case of the MSG, the conventional MRI could not be used to obtain the anatomical information because the spine is flexible, and a similar curving condition of the spine was not preserved between the MR imaging and the MSG signal acquisition when compared to that in the case of the MEG. On-site acquisition of the anatomical data is crucial for the MSG.
On-site x-ray imaging was applied to position the sensors relative to anatomical structures, such as the cervical vertebrae. An x-ray irradiator was mounted at the side opposite to the protrusion, and an imaging plate cassette was set adjacent to the protrusion to receive the x-rays as shown in figure 9(a). Additionally, x-rays were horizontally irradiated, and the images of the sensors and vertebrae posturing for the measurement were projected on the imaging plate as shown in figure 9(b). The obtained lateral x-ray image was effective in determining the relative position between the sensors and spinal cord for further magnetic source analysis.

Figure 9. (a) Photo of the position relationship between the x-ray irradiator and cassette, reproduced with permission from [13]. Copyright © 2009, IEEE. (b) Example of the obtained lateral on-site x-ray image, reproduced with permission from [14]. Copyright © 2011, IEEE. (c) Sensor array arrangement overlaid on the coronal x-ray image. The white circles and squares represent positions of the sensors and the marker coils, respectively.
Download figure:
Standard image High-resolution imageIn addition to the lateral x-ray image, the coronal x-ray image is also useful in positioning the sensors and the vertebrae. A flexible plastic sheet sensitive to x-rays was inserted between the subject and the upper surface of the cryostat protrusion. An x-ray image of the frontal view of the subject with marker coils was projected on the sheet using another x-ray irradiator that was hung from the ceiling of the MSR. In the coronal x-ray image, the sensor array itself was not projected. As shown in figure 9(c), marker coils were used for the co-registration between the MSG measurement and the coronal x-ray image. The procedure for the marker coil localization was the same as the conventionally used procedure for co-registration between the MEG and the MRI [28].
Although x-ray imaging is effective for on-site acquisition of anatomical data, it may limit the application of the MSG measurement owing to the potential health hazards associated with x-rays. The x-ray dosage to the body should be controlled and reduced as much as possible. We evaluated the risks and benefits of x-ray imaging, and consequently selected x-ray imaging for co-registration. However, we also continue to seek alternative techniques for on-site acquisition of anatomical data. The SQUID-based low-field MRI, which is investigated towards the MEG-MRI combined system [22], will be a possible candidate as an alternative technique.
3.3. Current source reconstruction
The origin of the MSG signals corresponds to both intra-cellular and extra-cellular currents around the axon. Intra-cellular current consists of a set of two directional local electric currents that flow in opposite directions due to the depolarization of the cell membrane. Extra-cellular current flows out of the cell to compensate for the intra-cellular current and is called volume current. The distribution of the magnetic field observed on the body surface indicates a quadrupole-like pattern [6].
Current source analysis for the obtained magnetic field distribution was performed to estimate the distribution of the intra-cellular and volume current along the spinal cord. An anomaly of the volume current distribution has a large significance for the diagnosis of the spinal cord diseases such as the detection of the conduction block along the nerve route [29, 30]. Current source analysis based on spatial filter techniques was applied to reconstruct both intra-cellular and volume current distributions in the concerned region including the spinal cord.
It was assumed that the sensor array had M SQUID sensors, and magnetic signals detected by each sensor at the latency t, b(t) = [b1(t), b2(t), ..., bM(t)]T, are described as the follows:

Current density vector at the point r = [x, y, z] in the concerned region is represented as j(r, t). Specifically, n(t) is a vector comprised of the noise in each sensor output, and L(r) is an M × 3 matrix referred to as a lead field matrix and represents the sensor sensitivity for the current density at r. Each element of L is determined by the relative position between each sensor and each current density vector based on the Biot–Savart law.
If an appropriate weight matrix W(r) is found, then a reconstructed current density vector at r, Jr(r, t), could be obtained as follows:

Several algorithms are based on spatial filter techniques that are applied to the magnetic source analysis of the MSG. An algorithm includes the unit gain constrained minimum norm (UGMN) [31]. With respect to the UGMN spatial filter, the weight matrix is determined as follows:

where G denotes a Gram matrix. The Gram matrix is defined as follows:

and represents the similarity of the lead fields between one sensor and another. The UGMN spatial filter provides a stable estimation of the reconstructed current density even if the distance between the magnetic current source and magnetic sensor is not constant. This is a significant advantage for the analysis of the MSG data because the spinal cord is typically curved and the distance from the SQUID sensor array to the source of the MSG signals passing along the spinal cord is not constant.
The recursively updated null-steering (RENS) beamformer is another powerful algorithm for the source reconstruction of the MSG data that was proposed in recent studies [32, 33]. When respect to the RENS beamformer, the calculation of the weight matrix includes instantaneous source power, j(r, t)2, which is another unknown parameter. Therefore, a temporarily estimated source magnitude is used alternatively, and the practical weight is derived by a recursive process. The RENS beamformer necessitates high computational costs owing to the recursive process but provides a higher spatial resolution for source reconstruction when compared to that of nonadaptive methods such as the UGMN spatial filter. A detailed explanation of the RENS beamformer is given in previous studies [32, 33].
4. Applications of the MSG system
This section describes several biomagnetic applications of the MSG systems. Each measurement was performed at the Tokyo Medical and Dental University hospital. Both informed consent from the subjects and approval by the institutional review board were obtained prior to performing all experiments described in the study.
4.1. Magnetospinogram
The first prototype of the MSG system optimized for supine subjects was developed in 2007. This system focused on the cervical spinal cord evoked magnetic field induced by direct stimulation to the thoracic spinal cord, and the dimension of the observation area corresponded to 120 mm × 90 mm [34]. The MSG systems were upgraded stepwise and were continuously operated at the Tokyo Medical and Dental University hospital for more than nine years for verification of clinical advantages. Recent achievements including some clinical data were reported in [35]. Currently, the target of the MSG system involves the lumbar area and the other peripheral nerves as well as the cervical spinal cord [36]. The scale of the system increased as the range of the application expanded. The latest prototype involved an observation area of 160 mm × 110 mm.
This section focuses on a demonstration of a typical example of the magnetic field distribution over the cervical area evoked by the median nerve stimulation obtained using the latest prototype of the MSG system. A male subject in his 20s without spinal cord diseases on the neck region was examined. The subject lay on a bed in a supine mode. The subject's neck was placed on the upper surface of the protrusion of the cryostat, and the back of the neck was in close contact with the observation area immediately above the sensor array, as shown in figures 1 and 4. Repetitive electric stimuli were given to the median nerve at the left elbow of the subject with a repetition rate of 5 Hz using surface electrodes. The electric stimulation involved square current with 0.3 ms in duration and 3.2 mA in intensity. The signals from all SQUID sensors were digitally recorded at a sampling rate of 40 kHz after a band pass filter of 100 Hz–5 kHz was applied. Following the digitization, 2000 epochs were averaged, and a digital low pass filter of 3636.4 Hz was applied. The higher end of the frequency band of the MSG signal itself was less than several kHz but a high sampling rate exceeding 10 kHz was still necessary because it was necessary to detect the peak shifts among sensors with an accuracy of approximately 0.1 ms with respect to the conduction velocity of nerve signals. After averaging, the DSSP algorithm was applied to reduce the artifact of the electric stimulation.
Figures 10 and 11 shows the transition of the magnetic field distribution pattern and the waveforms of the MSG signals, respectively. The array of the vector-type SQUID gradiometers could detect components that were tangential as well as radial to the body surface. The contour map and the overlaid arrow map indicated the distribution of radial and tangential components, respectively. The transition pattern was in good agreement with the cervical MSG measurement using the stimulation at the wrist median nerve as reported in extant studies [12, 13]. Signal propagation along the spinal cord was also observed as indicated by the arrows in figure 11. The artifact reduction by the DSSP made it possible to set the position of the stimulus at the elbow that was closer to the observation area and then to obtain larger cervical MSG signals although the latency of the peaks was observed earlier and the response overlapped with the stimulus artifact tail.
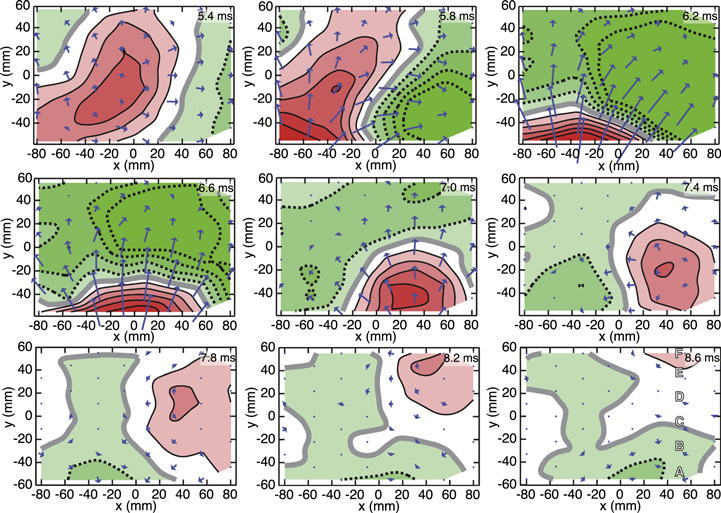
Figure 10. Transition of evoked magnetic field distribution between 5.4 ms and 8.6 ms in latency. Each map is a back view of the subject. The upper side of the maps is the side closer to the head. Plain, dotted and bold lines in the contour maps represent outward, inward and zero magnetic field, respectively. The interval between contour lines is 10 fT. The labels A–F in the contour map at 8.6 ms indicate the position of the sensors giving the waveforms shown in figure 11.
Download figure:
Standard image High-resolution image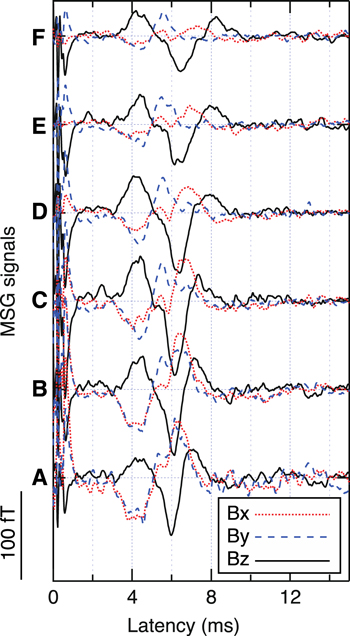
Figure 11. Example of the MSG signal waveforms. The labels A–E correspond to those shown in the contour map at 8.6 ms in figure 10.
Download figure:
Standard image High-resolution imageThe RENS spatial filter was applied to analyze the obtained MSG data. Figure 12 shows the distribution of the reconstructed current in the range between 6.6 ms and 7.4 ms in latency overlaid on the coronal x-ray image. It was observed that the high concentration of the reconstructed volume current flowing into the spinal cord that corresponded to a depolarization phase was propagated along the spinal cord as indicated by the white arrows. In the previous studies, it was difficult to analyze the MSG data induced by stimulus at the peripheral nerve stimulus, such as the median nerve, when the sLORETA spatial filter was applied to the MSG source reconstruction [30] because the transition pattern was complicated, and the spatial resolution of the sLORETA algorithm was not sufficient. Therefore, thoracic spinal cord stimulation was considered as inevitable in obtaining the diagnostic information of the spinal cord lesion because the MSG patterns corresponded to a simple quadrupole-like pattern that was propagated straightforward along the spinal cord. However, the thoracic spinal cord stimulation required the insertion of catheter electrodes for the stimulation. Recently developed spatial filters, such as the RENS, made it possible to obtain significant functional information for the diagnosis of the spinal cord diseases at a high resolution even from the MSG measurements by the noninvasive peripheral nerve stimulation.
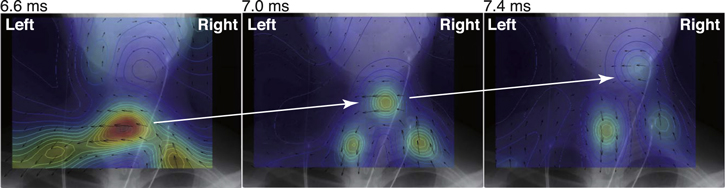
Figure 12. Distribution of reconstructed current overlaid on the coronal x-ray image of the skull, cervical spine, and clavicles.
Download figure:
Standard image High-resolution imageThe MSG measurement as described above was performed when the helium re-condensation system was in operation [16]. From the viewpoint of noise, the quality of the data was not affected by the re-condensation system immediately adjacent to the MSR.
4.2. Other applications of the MSG system
In this section, applications of the MSG system other than the spinal cord functional imaging including MCG, MEG, and magnetomyogram (MMG) are demonstrated.
4.2.1. MCG using the MSG system
The MSG system is designed to collect the biomagnetic signals on the dorsal surface of subjects lying in a supine position. The sensor array of the vector-type SQUID gradiometers with a baseline of 68 mm is useful in observing deeper current sources. These features were also effective in detecting MCG signals from the posterior wall of the heart. Therefore, various approaches focused on applying the MSG system in novel MCG studies.
Specifically, a noninvasive detection of pulmonary venous (PV) activity is a promising application [37]. As widely known, PV activities play a triggering role in atrial fibrillation [38]. However, to date, the PV activities were detected only by an intracardiac catheter electrogram that is highly invasive and is not applicable in regular health checks. The MSG system could be used to investigate the fine structure of the P-wave, and the results suggested that the specific components considered to originate from PV activities were included in the magnetic fields tangential to the body surface. It was also revealed that the atrial fibrillation substrate was noninvasively assessed by the dominant frequency analysis of the cardiac magnetic field obtained from below posterior wall of the left atrium [39]. It is expected that such noninvasive observations of the PV activities using the MSG system can be applied for the risk evaluation of atrial fibrillation.
4.2.2. Auditory brainstem response (ABR)
The MEG signals from deep sources, such as the brainstem, are quite weak due to the intensity decay by distance. When the conventional MEG system is used to detect deep sources, it is necessary to average a large number of responses to improve the S/N ratio and the measurement inevitably involves a long time period. In this study, the MSG system was applied to detect the magnetic field generated by these types of deep sources in the brain [40]. The small cool-to-warm separation of the cryostat and the long baseline length of the gradiometric pickup coils are also advantageous in targeting the deep brain sources.
Figure 13 shows an example of the results of the ABR using the MSG system with an array of 40 SQUID vector gradiometers [13]. A subject without a hearing problem was examined. The auditory stimulus corresponded to the click sounds repeatedly provided to the left ear of the subject through a 1.75 m plastic tube. The repetition rate and the sound intensity corresponded to 9.52 Hz and 70 dBSL, respectively. The observation area was positioned over the right lateral–occipital area, 8000 responses were averaged, and a noise reduction based on synthesized spatial filters [41] was applied to improve the S/N ratio. Figure 13(a) shows the waveforms of the radial components detected at the positions labeled A–H in (b). The latency included a delay between the stimulus trigger and the onset of the actual stimulus because of the length of the plastic tube but it was not compensated. Therefore, it was necessary to shift the actual latency of the peaks in figure 13(a) earlier by approximately 5 ms. With respect to this shift, the component marked by the vertical dotted line was considered as the wave V of an ABR, and the earlier ABR waves were also observed. The distribution corresponding to the wave V was widely spread over the observation area corresponding to 90 mm × 140 mm as shown in figure 13(b). Figure 13(c) shows a single equivalent current dipole (ECD) for this data that is estimated from the magnetic field distribution. Co-registration between the head shape obtained by a 3D digitizer (FASTRAK, Polhemus, USA) and the MSG sensor array was executed based on marker coil localization. The position of the obtained ECD corresponded to the brain stem, and the goodness of fit was 93.26%. The result of the ECD localization was fairly reasonable although the observation area was narrow. This could be because the short cool-to-warm separation of the cryostat and the vector-type SQUID gradiometers with a long baseline length were significant advantages for the detection of the MEG signals from deep sources.

Figure 13. An example of the ABR recording using the MSG system. (a) Waveforms of the signals detected at the position of A–H indicated in (b). The red and gray lines represent the signal with and without applying the noise reduction, respectively. (b) Distribution of the MEG signals at the latency of 10.2 ms, The interval between contour lines is 1 fT. (c) The positions of the sensor array (blue dotted circles) and the estimated equivalent current dipole (a red filled circle) relative to the head shape obtained by the 3D digitizer.
Download figure:
Standard image High-resolution image4.2.3. Magnetomyogram
The MMG observes a magnetic field induced by the activity of skeletal muscles. The first MMG measurement using a SQUID was reported in 1972 [42]. The intensity of the MMG signals exceeded several tens of pT. The number of reports for the MMG was considerably less than those for the MCG and MEG although the MMG signals were sufficiently large, and they could be easily detected by SQUIDs. However, MMG has a large potential to noninvasively quantify skeletal muscles activity noninvasively from a physiological viewpoint and to act as an alternative to a conventional needle electromyogram (EMG) recording. Furthermore, it is also expected that the MMG can be applied to evaluate the effect of rehabilitation and sports medicine because the MMG signals are sufficiently large to be detected by recently advanced low-cost room-temperature (RT) magnetic flux sensors. A recent study reported a preliminary MMG recording using a multichannel magnetoresistive (MR)-sensor-based biomagnetic measurement system [43].
The MMG measurement using SQUIDs continues to play an important role in providing good model data for the MMG study although the MMG signals can be detected by the low-cost RT sensors because a precise and reliable MMG distribution can be obtained only by SQUIDs owing to their magnetic field resolution much more than that of the RT sensors. The MSG system was effective in obtaining good model data due to the structure of the cryostat and sensor array. The sensors were arranged vertically along the upper surface of the protrusion of the cryostat such that it was only necessary for the subjects in the MMG measurement to place their extremities on the protrusion including the sensor array. The co-registration of the MMG data to the anatomical information is also easy when the on-site x-ray imaging is used.
Figure 14 shows an example of the MMG results using the latest MSG system. The palm of the right-hand of a normal healthy subject was placed on the sensor array, and the median nerve at the subject's wrist was electrically stimulated. The induced MMG signals were detected at the positions as indicated in figure 14(a). The electric stimulation involved a repetitive square pulse current with an intensity of 6.0 mA and duration of 0.3 ms. The repetition rate corresponded to 5 Hz and 500 epochs were digitally recorded at the sampling rate of 10 kHz after applying a band pass filter of 15 Hz–5 kHz, and the recordings were then averaged. The artifact caused by the electric stimulation was removed using the CSP [25]. The EMG using surface electrodes over the short abductor muscle of the thumb was also simultaneously recorded. Figures 14(b) and (c) show the overlapped waveforms of the signals from all sensors along with simultaneous EMG signals and the magnetic field distribution at the latencies indicated by arrows in figure 14(b). Triphasic MMG signals were clearly observed. It was obvious that the MMG measurement provided a significant amount of physiological information related to the skeletal muscles activity noninvasively when comparing with that of the conventional EMG.

Figure 14. (a) Sensor positions overlaid on the x-ray image, (b) waveforms of the MMG signals along with the EMG waveforms, and (c) distribution of MMG signals at the latencies of 6.7, 10.1, and 13.6 ms. The interval between contour lines is 5 pT.
Download figure:
Standard image High-resolution image
5. Conclusion
In this study, the recent development status of the SQUID MSG system was reviewed, and several applications were demonstrated. The development of the MSG system was investigated by extant studies since 1999. The authors of the present study focused on MSG study beginning with animal experiment using a small-scale SQUID system and established noninvasive functional imaging of human spinal cords as a milestone. Recently, extant research has explored the commercialization of the MSG system as a medical device. SQUID technology is evidently the most important factor of the MSG system. However, as described in this study, the advancement of peripheral technologies including helium re-condensation, noise reduction, co-registration with the anatomical information, and source reconstruction were also critical in making the MSG system a medical device that could be used in hospitals. Generally, medical devices that can be used for multiple purposes, such as MRI, are readily introduced in hospitals. Therefore, it is important to expand the application range of the MSG system, not limiting it to the diagnosis of the spinal cord diseases. The development of the MSG system is ongoing in terms of the improvements in the SQUID sensor array as well as the source reconstruction algorithm. One of such improvement efforts in the sensor array is currently focusing on the optimization of the pickup coil radius of the sensors. When the radius of the pickup coil is increased, for example, by 21/2 times, it is expected that the sensitivity of the sensor will improve by a factor of two at the maximum. The average count to achieve the equivalent S/N ratio is reduced by a factor of 4 and the measurement time is also reduced. However, when the radius of the pickup coils is increased, the sensor interval is also increased and the spatial resolution of the sensor array will deteriorate. Therefore, there is a trade-off between the sensitivity and the spatial resolution. We consider that increasing the pickup coil radius is effective for detecting the magnetic field, especially from deep sources in the body because its intensity is lower compared with the intensity in less deep sources; however, its distribution indicates a milder spatial change over the body surface and a higher spatial resolution of the sensor array is not required. These improvements target not only the investigation of the spinal cord function, but also further expansion of the application scope beyond spinal cord assessment. Future studies will involve operating the MSG system as a multi-purpose biomagnetic measurement system, and it may be called no longer an 'MSG system' but another way, so to say an 'MXG system' [44].
Acknowledgments
The authors thank Ms Miki Kawabata with Eagle Technology, Inc. for manufacturing the vector-type SQUID gradiometers, and Ricoh Co., Ltd for supporting the development of a multichannel analog and digital signal processor of the latest prototype of the MSG system. The authors also thank Dr Hisanao Ogata and Dr Jun-ichi Fujihira for their contribution to the development of the closed-cycle helium re-condensing system. This work was partly supported by the Japan Society for the Promotion of Science through the Grants-in-Aid from Science Research (KAKENHI) under Grant 26282149.