Abstract
A precise, real-time, single-shot carrier–envelope phase (CEP) tagging technique for few-cycle pulses was developed and combined with cold-target recoil-ion momentum spectroscopy and velocity-map imaging to investigate and control CEP-dependent processes with attosecond resolution. The stability and precision of these new techniques have allowed for the study of intense, few-cycle, laser-matter dynamics with unprecedented detail. Moreover, the same stereo above-threshold ionization (ATI) measurement was expanded to multi-cycle pulses and allows for CEP locking and pulse-length determination. Here we review these techniques and their first applications to waveform characterization and control, non-sequential double ionization of argon, ATI of xenon and electron emission from SiO2 nanospheres.
Export citation and abstract BibTeX RIS
1. Introduction
Many of the laser–matter interactions being probed and controlled on the attosecond time scale rely upon the knowledge and control of few-cycle laser pulses, e.g. high-harmonic attosecond pulse generation (HHG) [1], above-threshold ionization (ATI) of Xe [2–7], non-sequential double ionization (NSDI) of Ar [8] and electron emission from SiO2 nanospheres [7] along with a multitude of others [9]. The generation of intense few-cycle laser pulses is regularly achieved with commercially available tabletop Ti:sapphire systems in modern laboratories. Additionally, the time-dependent electric field of a laser pulse dictates the dynamics of strong-field laser–matter interactions. Therefore, control and/or characterization of the waveform is paramount for the understanding and control of these interactions.
Assuming a Fourier-transform limited, Gaussian pulse with the waveform E(t) = E0exp ( − t2/τ2)cos (ωt + ϕ), where ω is the frequency, ϕ is the carrier–envelope phase (CEP), E0 is the peak electric field, and the full-width at half of the maximum (FWHM) pulse duration in intensity is defined as  ; the waveform is characterized by the pulse duration (Δt) and CEP (ϕ) for a given wavelength and peak intensity. These quantities are typically measured by separate devices. The CEP is most often measured and/or controlled by f–2f interferometers [10–12], but alternative methods, such as analysis of HHG [13] and quantum interference [14], have also been developed. The pulse duration is typically measured using autocorrelation, frequency-resolved optical gating (FROG) [15, 16], or spectral phase interferometry for direct electric-field reconstruction (SPIDER) [17, 18]. Until now, the exceptions, which measure both pulse duration and the CEP, have been attosecond streaking [19–24] and the analysis of velocity-map images (VMIs) of ATI from nobel gases [25, 26], which require lengthy measurement times and relatively complex experimental setups.
Recently an alternative technique using the ATI of Xe for the real time, every single-shot CEP and pulse length measurement of ultrashort laser pulses has been proposed and implemented [4–6, 8, 7, 27–30]. Moreover, this technique facilitates CEP data tagging, i.e. measuring the CEP for each laser shot in parallel to another event-mode measurement and tagging the resulting data from each laser shot separately with the corresponding CEP. This allows one to probe CEP-dependent processes without CEP locking, which is typically temperamental and unsuitable for lengthy (hours long) measurements [12], thereby allowing one to study low-probability CEP-dependent processes and better utilize single-shot, event-mode measurement techniques, e.g. cold-target recoil-ion momentum spectroscopy (COLTRIMS). Although the stereo-ATI measurement of Xe only allows for CEP retrieval for linearly polarized ultrashort pulse, utilizing polarization gating [31, 32] allows this to be extended to the multi-cycle regime.
One can also take advantage of the favourable properties of this measurement technique to improve CEP locking for instances when data tagging is not applicable [27]. This is an alternative to the typical f–2f slow-loop CEP locking scheme, which improves mid-term (a few seconds) and long-term (hours) CEP stability. Moreover, when operating the stereo-ATI measurement as a carrier–envelope phase meter (CEPM), one gains a powerful, real-time diagnostic tool with attosecond sensitivity, which is crucial for easy and reliable tuning and monitoring of intense, ultrashort, Ti:sapphire sources, especially when pushing for the shortest possible pulses.
Here recent reports of the implementation and functionality of the CEPM are reviewed along with its first CEP tagging applications to NSDI of Ar, ATI of Xe, and electron emission from SiO2 nanospheres.
2. Experimental setup
2.1. Stereo ATI
2.1.1. Introduction
Two distinctively different mechanisms lead to a typical ATI electron spectrum [33, 34]: (i) direct electrons are ionized and then driven by the laser field up to energies of ∼2 times the ponderomotive energy (Up) without revisiting the parent ion. (ii) Rescattered electrons, which comprise just a fraction of 1% of the total yield, are driven back to the parent ion and collide gaining additional energy (up to ∼10 Up) from the laser field [35]; see figure 2(a); these rescattered electrons generate a plateau in the high-energy region of the photoelectron spectrum [34]. For few-cycle laser pulses, the rescattered electron yield is strongly CEP dependent, because the electron can only revisit the ion under very special conditions of the electric field of the laser pulse [35].
2.1.2. Real-time, single-shot waveform measurement
The CEPM is designed to take advantage of the CEP dependence of ATI photoelectrons [2]. It consists of two back-to-back micro-channel plate (MCP) detectors placed along the polarization axis of the focused laser beam; see figure 1. The time-of-flight (TOF) drift tube is surrounded by μ-metal to provide a magnetic and electric field-free flight for the photoelectrons. The MCP detector area defines the acceptance angle for the photoelectrons as ∼2° (half-angle). Intensity-volume and Gouy-phase effects are limited by slits mounted to either side of the target area in the polarization direction. These slits also serve as differential-pumping apertures, which allow for an increased Xe target pressure and corresponding photoelectron yield while keeping the drift tube vacuum low enough for safe MCP operation. The high photoelectron count rate (∼200 electrons per shot in the high-energy, rescattered electron TOF region) is converted to a time-dependent voltage, i.e. there are enough electrons to produce an ATI spectrum for each individual laser shot. The low-energy, direct electrons are suppressed by applying a static repelling voltage to a mesh located in front of the MCP.

Figure 1. Drawing of the CEPM used to measure ATI spectra for each and every laser shot.
Download figure:
Standard imageTo make it easier to determine the CEP from the ATI spectra, several manipulations are performed on the spectra. As discussed in previous theoretical and experimental work, see e.g. calculations performed by Milošević et al [36] and measurements by Paulus et al [3], the plateau region is focused upon as it is strongly CEP dependent, see figure 2(a). To make this dependence more pronounced, the left–right asymmetry is calculated as

where L and R are the integrated electron yields to the left and right, respectively. Moreover, the CEP dependence of the asymmetry in the ATI spectrum is sinusoidal and the phase of this relationship is energy dependent, see figure 2(b). Thus, one can choose two energy regions (low and high) with different CEP dependences for which the phase of the CEP dependence is offset by α [4], i.e.

where ϕ is the CEP and ϕ0 is an arbitrary offset. By varying the energy regions to optimize the value of α to 90°, one ensures that


(see figure 2(b)) [3, 36, 37]. Finally, the two asymmetry values (x=Alow and y=Ahigh) are plotted against one another in a two-dimensional parametric asymmetry plot (PAP) in which the polar angle (θ) corresponds to the CEP (ϕ) of the laser pulse, i.e.

Figure 2(c) shows a typical set of 150 000 laser shots in which each dot corresponds to a single laser pulse. Although the dependence of ϕ on θ deviates slightly from a purely linear dependence, one can determine ϕ(θ) exactly using a pulse train in which the CEP is randomly and uniformly distributed [5].
The asymmetry parameters are calculated in real time by a homemade electronic circuit [29] within ∼20 μs of the laser interaction and with a 100% duty cycle. The position of each point on the PAP, which corresponds to each single laser shot, is output in real time in both Cartesian (x and y) and polar coordinates (r and θ). These values are output as both voltage levels and time delays so that either amplitude-to-digital converters (ADCs) or time-to-digital converters (TDCs) can be used to record the data.
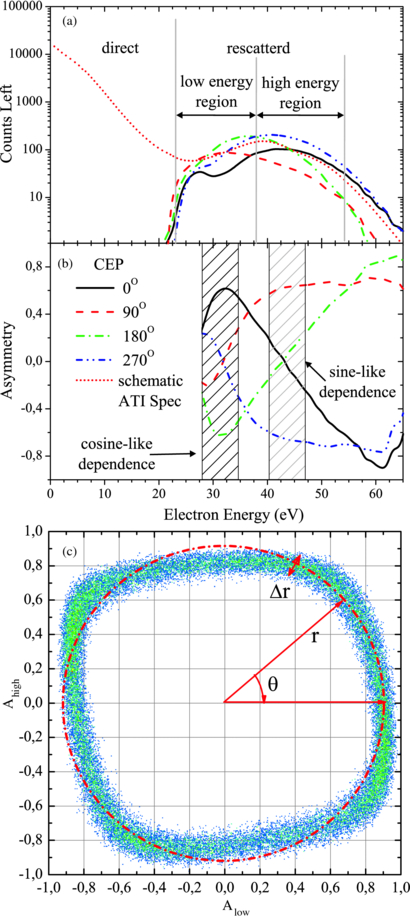
Figure 2. (a) Recorded rescattered photoelectron energy spectrum on one detector for different CEPs with the two integration regions (low and high energy) including a schematic ATI spectrum with direct electrons. (b) Asymmetry calculation showing the 90° offset for different energy regions in the rescattered electron plateau. (c) Typical PAP for 150 000 sub-4 femtosecond laser pulses.
Download figure:
Standard imageWhile the angle θ can be used to determine the CEP, the radius of the PAP is related to the pulse length of the few-cycle laser pulse. Shorter laser pulses result in a stronger left–right asymmetry in the electric field of the laser pulse, which in turn leads to stronger CEP effects, larger calculated asymmetries (A) and finally a bigger radius in the PAP. To determine this relation, the pulse length of a few-cycle laser pulse is measured with a commercial SPIDER (spectral interferometry for direct electric-field reconstruction) system (FC SPIDER by APE GmbH) and recorded in parallel with the CEPM output [6].
The CEPM is optimized for ultra-short few-cycle Ti:sapphire laser systems with a repetition rate up to several tens of kHz. In this configuration, a typical chirp-pulse amplification (CPA) Ti:sapphire laser (a Femtopower Compact Pro HP/HR CEP with 28 fs, 1 mJ pulses at 4 kHz) is combined with a hollow-core fibre to increase the spectral bandwidth and a chirped mirror compressor. To guarantee the shortest laser pulse both in the CEPM and parallel measurement(s), the pulse is negatively chirped by chirped mirrors and the remaining chirp is compensated for in front of each chamber with an independent pair of fused silica wedges. Approximately 30 μJ of laser pulse energy is focused into the CEPM target area with a f=250 mm concave spherical mirror to achieve a peak intensity of I0 ∼ 8 × 10¹³ W cm−2. Astigmatism from this mirror is minimized by restricting the beam diameter, typically <2 mm, and minimizing the angle of incidence, typically <2°. With a linearly polarized beam, this configuration allows for precise, real-time, every-single-shot CEP and pulse length measurements for ∼790 nm pulses up to ∼8.5 fs.
2.1.3. Polarization gating
As the pulse duration increases, the precision for the CEP measurement decreases, which ultimately limits the operating range of the CEPM in the pulse duration. However, polarization gating (PG) [31, 32], which is well known for its application in generating isolated attosecond pulses, allows one to see CEP-dependent effects from multiple-cycle driving lasers. In combination with the CEPM, PG is applied to increase the CEP-dependent asymmetries in left–right ATI spectra from multiple-cycle laser pulses [28].
For this purpose, the incoming linearly polarized laser pulses are modified to exhibit a time-dependent ellipticity that evolves from elliptical to linear to counter rotating elliptical, i.e. to artificially gate the linearly polarized part of the pulse in time (see figure 3(a)). Due to the quick drop in the ellipticity-dependent yield [38], rescattered electrons are generated, almost exclusively, at the time when the polarization is close to linear. As the PG lasts for only half an optical cycle or less, the CEP-dependent asymmetries induced by polarization-gated multi-cycle pulses are much stronger than the asymmetries induced by a linearly polarized pulse of the same initial duration.
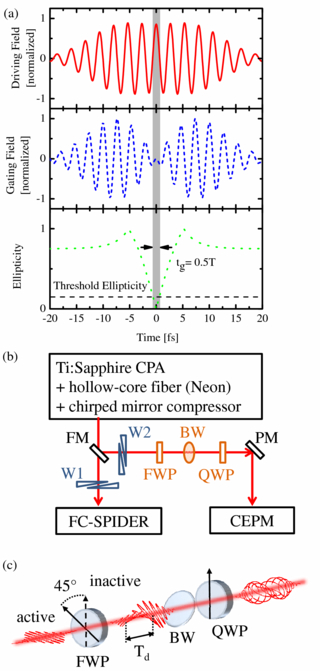
Figure 3. (a) Component-wise illustration of the polarization-gated laser pulse. The driving field component is parallel to the phase meter arms. (b) Experimental setup that was used to study the precision improvements as a function of laser pulse duration with FM (flip mirror), W1 and W2 (fused silica wedges), FWP (quartz multiple-order full wave plate), BW (brewster window) and QWP (zero-order quarter-wave plate) marked. Replacing the fm with a beamsplitter (BS) and the FC-SPIDER with a CEP-dependent experiment. (c) Birefringent optics that were used to form the polarization-gated pulse. Rotating the FWPs optic axis from 45° to 0° to the incoming linear polarization allows switching between active PG and inactive PG, i.e. linear polarization. Note: figure adapted from [28]. Reprinted with permission of the American Institute of Physics.
Download figure:
Standard imageThe PG is formed by transmitting the beam through birefringent quartz optics—(i) a multi-order quartz wave plate (FWP) with its optic axis at 45° with respect to the incoming linear polarization, (ii) a pellicle Brewster window (BW), and (iii) a zero-order quarter-wave plate (QWP) with its optical axis at 0° with respect to the incoming linear polarization. The duration of the PG, δt, is approximated by

where τ is the pulse duration,  = 0.75 is the ellipticity outside the PG and ξth is the threshold ellipticity below which the ellipticity-dependent yield of rescattered electrons is larger than 0.1 [39]. The delay time, Td, is controlled by the thickness of the FWP and can be varied in steps of the cycle time, Td = nT ≈ n · 2.7 fs. Adjusting the angles of the FWPs and QWPs optic axis can be used to fine tune the direction of the linear polarization within the gate and the duration of the gate [40].
The experimental setup, sketched in figure 3(b), was used to study the precision of the CEP measurement as a function of initial pulse duration with various PGs. The pulse duration was adjusted by varying the gas pressure in the hollow core fibre, which changes the spectral bandwidth. Chirped mirrors and wedges, W1 and W2, compensate the spectral phase to ensure the shortest pulse in the SPIDER and in the CEPM.
2.2. CEP tagging
2.2.1. Introduction
Many interesting CEP-dependent processes require long acquisition times with modern kHz repetition rate few-cycle laser systems to gain suitable statistics. This can, in principle, be achieved by employing CEP stabilization and performing measurements for different CEP values by the insertion of dispersive material into the laser beam (see e.g. [41, 42]) or by scanning the CEP via an f–2f interferometer (see e.g. [43–45]). Intense, few-cycle pulse CEP stabilization, however, is, at present, difficult to achieve for more than a few hours continuously. It is thus not surprising that the studies involving CEP locking are typically limited to measurements achievable in a couple of hours or less.
CEP-tagging removes this bottleneck and allows for studies of low-probability processes in a highly differential way with increased signal-to-noise ratio. Furthermore, as CEP-tagging allows one to acquire data with a random and uniform CEP distribution; the data are recorded as a continuous function of the CEP, thus enabling much better comparison of the data to theoretical models. Importantly, no dispersive material is needed to change the CEP, such that the laser parameters can be considered constant throughout the CEP scan. The overall duration of a phase-tagged coincidence measurement is only limited by the stability of the other laser parameters of the laser system (e.g. power, pointing, wavelength and pulse duration), all of which can, in principle, be monitored on a single-shot basis. Note that the CEPM should be placed as close to the primary measurements as possible with equal beam paths since the CEP is very sensitive to temperature and pressure fluctuations. In the implementation discussed in this review, measurements with a very stable 3 kHz few-cycle, amplified Ti:sapphire laser system (based on a Femtolasers Compact Pro, see [46] for details) could be taken for multiple days without noticeable degradation of the laser parameters.
The CEPM also allows one to tag CEP-dependent measurements with the absolute CEP in certain circumstances, i.e. determining ϕ0 in equation (4). First, this can be accomplished by calibrating the relationship between the absolute CEP in the interaction region of the primary measurement, e.g. the COLTRIMS and VMI measurements that are discussed below, with the relative value derived from the CEPM. In other words, by performing a strongly CEP-dependent measurement in the primary experiment chamber, which has a theoretically well described dependence on the absolute CEP, one can then use the calibration to determine the absolute CEP dependence of a subsequent measurement given no alterations in the laser path. Second, one can calibrate the absolute CEP in the CEPM using a theoretical description of ATI in Xe, e.g. quantitative rescattering theory (QRS) [70] or the time-dependent Schödinger equation [71], and calculate the CEP shift between the primary measurement and the CEPM. This requires that one know the optical path difference between the two interaction points with a high precision as the CEP is extremely sensitive to path length differences, e.g. roughly 60 μm of fused silica will change the CEP by 2π. Ideally, one would perform both measurements within the same vacuum chamber to minimize the difference between the two optical pathways. Additionally, precise knowledge of the laser parameters inside the CEPM, i.e. the intensity–volume interaction, along with gate settings, as illustrated in figure 2, is required to facilitate a reliable calculation. In either case, the precision of the absolute CEP is only as good as the theoretical determination of that phase.
2.2.2. Phase-tagged coincidence measurements
Highly differential measurements, where the positively charged fragments from a laser–matter interaction can be recorded in coincidence, are feasible with the COLTRIMS, which is often referred to as a 'reaction microscope' (REMI) if also electrons are detected in coincidence [47]. In order to utilize the coincidence detection scheme, the count rate of ions and electrons must be kept below one per laser shot in order to prevent the signal of interest from being dominated by background from random coincidences. Processes such as the double ionization of an atom make up only a small percentage of the overall generated signals and thus require a lengthy acquisition period. Laser-driven correlated electron dynamics has been the subject of numerous experimental and theoretical studies (see e.g. [48] for a recent review). Moreover, the number of COLTRIMS/REMI studies involving CEP locking are limited [41–44]. Therefore, determining the CEP and energy dependence of double ionization in Ar with an intense few-cycle pulse serves as an excellent test bed for this CEP tagging technique.
The setup and data acquisition scheme that was used to record phase-tagged COLTRIMS/REMI data is shown in figure 4. A small portion of the horizontally polarized laser beam (∼50 μJ per pulse) is split off from the main beam by a broadband BS. This portion is focused into a single-shot CEPM by a concave mirror (f = 25 cm); see section 2.1.2 for technical details. The two analogue voltage values for x = Ahigh and y = Alow are recorded by an ADC card that is part of the VME system recording all the data in the experiment. The ADC card is separately triggered by a delayed trigger that arrives ∼50 μs after the main trigger to allow for the processing time of the CEPM circuitry. The original trigger that serves as a master trigger is derived from an ultrafast photodiode. From the recorded values Ahigh and Alow, the PAP (see figure 4) can be displayed during data acquisition. Post-processing allows us to extract the phase CEP measured within the CEPM from a data point within the PAP.
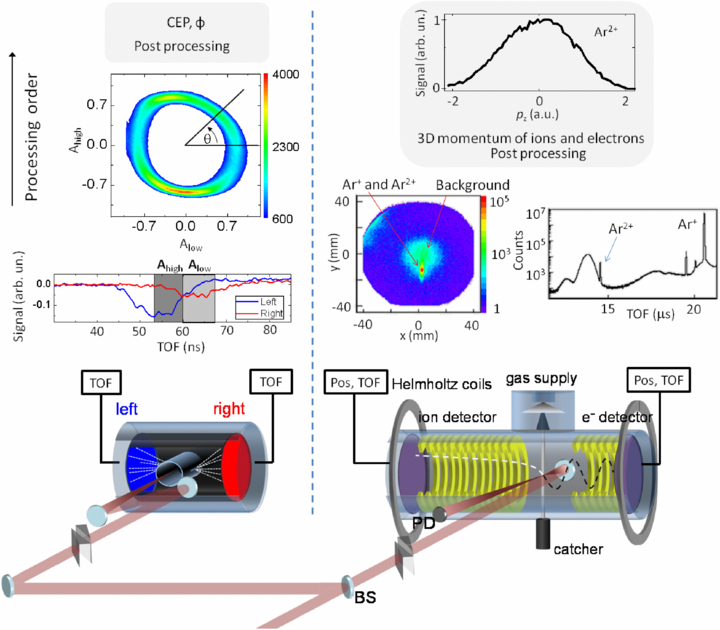
Figure 4. Single-shot phase-tagged COLTRIMS/REMI setup and data acquisition scheme. The horizontally polarized few-cycle pulses are split by a broadband BS. The weaker part of the beam is directed to the CEPM (left chamber) and the stronger part to the COLTRIMS/REMI (right chamber). The CEPM produces two TOF signals from which the asymmetry parameters Ahigh and Alow are derived and a PAP can be plotted. Post-processing of the PAP allows for the determination of the CEP. The coincidence spectrometer (see the text for details) records TOF and impact positions for ions and electrons on the left and right detector, respectively. These data, here only ion data from the strong-field ionization of Ar are shown as an example, are further post-processed to determine the three-dimensional momentum of the fragments. Here, the pz component (momentum along the polarization direction) for Ar2 + is shown as an example. The master trigger for the experiment is derived from an ultrafast photodiode (PD).
Download figure:
Standard imageThe main part of the laser beam is send to a COLTRIMS/REMI, where it is back-focused into a thin cold target (permitting high momentum resolution in the experiments) in the centre of the spectrometer. The target jet is ∼1 mm thick and the Rayleigh range of the laser beam is ∼1 cm, which results in ∼6° of CEP averaging due to the Gouy phase shift. As this is less than or approximately equal to the typical single-shot CEP measurement uncertainty, it does not significantly add to a washing out of the CEP effects. The spectrometer is operated with a static field strength of a few V cm−1 guiding ions to the left and electrons to the right detector. In order to increase the acceptance angle of the spectrometer for electrons, an additional magnetic field is introduced by a pair of Helmholtz coils. Not shown in the figure are sets of additional Helmholtz coils to compensate the effect of the earth's magnetic field. TOF and position signals (in figure 4 shown for the ion signals from the strong-field ionization of Ar as an example) are generated by impact of the particles on MCP chevron stacks with delay-line anodes on both sides of the spectrometer. The signals are acquired by the TDC card, which is initialized by the master trigger, in a VME crate. Post-processing allows us to determine the three-dimensional momentum of all fragments. Figure 4 shows the recoil momentum in the direction of the laser polarization (pz) of doubly charged Ar ions as an example.
It should be noted that the chirp in each path, i.e. in the CEPM path and the COLTRIMS/REMI path, is compensated by a pair of silica wedges. However, these wedges are preadjusted and not changed during the experiments. Due to the fact that the CEPM records the CEP at a different place than the interaction region of the COLTRIMS/REMI spectrometer, the measured phase exhibits a constant phase offset with respect to the phase of interest in the coincidence measurement. The phase offset can, however, be easily determined during the post-processing by an analysis of the CEP dependence of a single ionization process within the COLTRIMS/REMI or by comparison of the measured data to theoretical models.
2.2.3. Single-shot VMI
An experimental approach that allows for the energy and angular resolved observation of ultrafast electron dynamics is velocity map imaging (VMI) [7, 49]. This technique is of particular advantage if coincident detection of multiple charged particles is not required. Compared to a COLTRIMS/REMI, the number of hits onto the detector per laser shot can be many orders of magnitude higher. In VMI, the density of the gas target is mostly limited by the occurrence of space charge effects and potentially by the need to maintain sufficiently low pressures to operate a MCP detector. The high count rates achievable with VMI have motivated its application in experiments on the attosecond control of electron dynamics in atoms [25], molecules [25, 50, 51] and nanostructures [52]. In these experiments, the acquired images are integrated over multiple laser shots, making it necessary to employ CEP stabilization. The application of phase-tagging in conjunction with VMI requires single-shot data acquisition of the VMI images, ideally at the repetition rate of the laser source.
Very recently, Süßmann et al demonstrated single-shot phase-tagged VMI at a repetition rate of 1 kHz [7]. Figure 5 shows the experimental setup. Few-cycle laser pulses are split into two parts by a broadband BS. Both beams pass through pairs of wedges for individual minimization of pulse duration for both the VMI and the CEPM part of the setup. The technical details of the CEPM are described in section 2.1.2 above. In the VMI, the laser beam is focused into the centre between the repeller and extractor of the spectrometer, where it intersects an effusive gas jet.
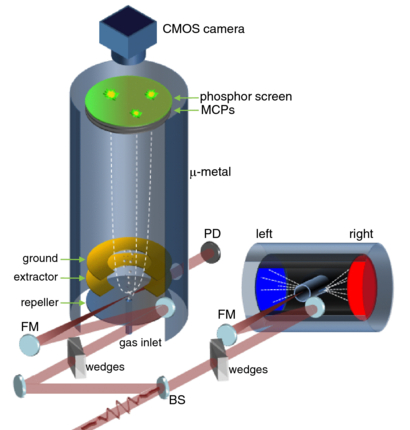
Figure 5. Experimental setup including both a VMI spectrometer (left) and a single-shot CEPM (right). A broadband BS provides two laser beams. One beam is focused by a 50 cm focal length spherical mirror (FM) into the VMI chamber, where the photoemitted electrons are projected by an electrostatic lens onto the MCP/phosphor screen detector and recorded by a complementary metal-oxide semiconductor (CMOS) camera. The second beam is focused by a 25 cm focal length spherical mirror into the CEPM (see section 2.1.2). A common trigger for the setup is derived from a fast photodiode (PD). The pulse duration for the VMI and CEPM instruments can be optimized individually by the insertion of dispersive material using pairs of fused silica wedges. Note: figure published in [7]. Reprinted with permission of the American Institute of Physics.
Download figure:
Standard imageThe jet originates from a 100 μm nozzle and expands to ∼500 μm in the interaction region while the Rayleigh range of the laser beam is ∼1 cm, which results in ∼3° of CEP averaging due to the Gouy phase shift. As this is substantially less than the single-shot CEP measurement uncertainty, it does not smear out CEP effects. Photoemitted electrons or ions are projected by the ion optics of the VMI spectrometer onto a MCP/phosphor screen assembly. Combining the VMI technique with phase tagging at 1 kHz repetition rate requires single-shot imaging of the light flashes from the phosphor screen with a high-speed camera with sufficient sensitivity. Complementary metal-oxide semiconductor (CMOS) cameras have been used for such recordings with kHz repetition rate [7, 53]. At such high repetition rates, however, the stream of raw image data exceeds today's computing power and storage capabilities. Real-time image processing was utilized in [7], which disposes pixels below a given threshold from the images and allows transferring up to 1024 events per laser shot at 1 kHz. This approach not only reduces the amount of data but also permits for an almost complete suppression of background events and camera noise. The CEP is derived from two asymmetry values Ahigh and Alow of a special circuitry [5] processing the Stereo-ATI data for each individual laser shot that are recorded by an ADC card in the computer.
During the data post-processing, the phase-tagged single-shot images are grouped based on the CEP and the images in each group is added together. In addition, a centroiding algorithm and filtering based on single-shot information (e.g. event count, laser intensity) can be employed to further improve the final phase-tagged data. To reconstruct the 3D momentum distributions of the electron emission from the recorded 2D projections, an iterative inversion procedure can be applied [54]. The phase dependence of the electron/ion emission process can be directly accessed by defining an asymmetry parameter a = (n+ − n−)/(n+ + n−). Here, n+ is the number of electron/ion hits with momentum, py > 0, and n− the corresponding number for momentum, py < 0.
2.3. CEP locking
2.3.1. Introduction
For many applications, a pulse train with a locked CEP is required, e.g. the generation of consistent isolated attosecond pulses from every few-cycle pulse in a kHz train. Although CEP tagging is not applicable in this case, improvements in CEP measurement can be utilized to improve CEP locking. Here, the typical slow-loop f–2f feedback mechanism is replaced with a CEPM [27] as shown in figure 6.
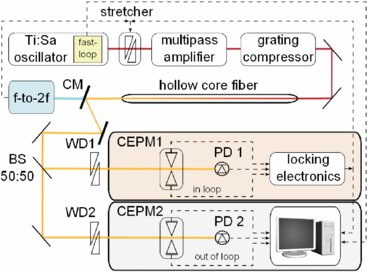
Figure 6. Schematic of CEP locking with a stereo-ATI measurement. Experimental setup: BS, beam splitter; CM, chirped mirrors; CEPM1, in-loop stereo-ATI measurement; CEPM2, out-of-loop stereo-ATI measurement; PD, photodiode; WD, fused silica wedges. Note: figure published in [27]. Reprinted with permission of the Optical Society.
Download figure:
Standard image2.3.2. Stereo ATI as a feedback mechanism
For the comparison of these techniques, the same femtosecond laser system described in section 2.1.2 is used with a few modifications. The CEP is typically stabilized by two feedback loops. The first loop is the oscillator phase stabilization (fast loop), in which the broad spectrum of the Rainbow oscillator together with self-phase modulation (SPM) in a PPLN crystal generates an octave-spanning spectrum as well as a difference frequency generation (DFG) signal to create a f–0f interferometer [55]. The second loop is a Menlo Systems sapphire plate-based collinear f–2f interferometer [11] usually located directly after the amplifier to correct for slow drifts (slow-loop) caused by the amplifier [56]. Here the f–2f interferometer (with the sapphire plate removed) is placed after the hollow-core fibre to take into account the CEP changes generated by energy phase coupling in the hollow-core fibre [57].
To test the viability of the CEPM as a feedback mechanism, two CEPMs are used in parallel as in-loop (CEPM1) and out-of-loop (CEPM2) measurements. CEPM1 is introduced as a replacement for the aforementioned f–2f slow-loop. The output of CEPM1 is averaged over several laser shots to reduce jitter due to uncertainty in the measurement, and fed into a PID (proportional-integral-derivative) controller to generate a feedback signal for the piezocontroller of the stretcher of the CPA system. Additionally, to compare the effectiveness of the stabilization setups, a second independent out-of-loop measurement (CEPM2) is implemented. To monitor the fast-loop CEP locking for all measurements, the oscillator beat signal is also recorded in parallel.
3. Results and discussion
3.1. Stereo ATI
3.1.1. CEP and pulse length measurements with attosecond precision
In a recent work by Sayler et al [5], the possible precision of CEP measurements with the CEPM was simulated and estimated. For a high precision CEP measurement, it is mandatory to achieve a linear dependence between the angle in the PAP θ and the CEP ϕ, by optimizing the energy integration regions.
It is difficult to determine the accuracy of the CEP measurement Δϕ from the distribution of points in the PAP, because the statistical errors are dominating the CEP measurement, due to discrete electron counting and by intensity fluctuations of the laser pulse. Reference spectra were produced by averaging the ATI spectra over a small CEP range and used to estimate the error. Then, small jitters were added associated with statistical noise and/or intensity fluctuations via a Monte Carlo algorithm. With this technique, the following statistical error was found for a circular distribution of a PAP:

Although intensity fluctuations have little influence on r, they create an additional spread in ϕ. For the circular case, the uncertainty due purely to intensity fluctuations is ∼35 mrad per 1% intensity uncertainty, which is around a factor of 3 better than that achieved in f–2f measurements in combination with amplifier systems [12, 58]. These estimations show that it is possible to measure the phase for every single laser shot with a precision of better than 113 mrad (6.5° or 48 as at 800 nm laser wavelength).
The CEPM also has the ability to measure the pulse length of a single few-cycle laser shot (section 2.1.2). The result of the correlated experiment taken by Sayler et al [6] measuring the pulse length with a commercial SPIDER system (FC SPIDER by APE GmbH) and recording the PAP in parallel with the CEPM is shown in figure 7. It shows the dependence of the radial dimension in the PAPs, r, on the pulse duration, Δt, and closely fits a function of the form

In the explored region from 4 to 9 fs, the slope of this curve increases as the pulse length decreases resulting in more precise measurement with shorter pulse lengths. Especially in the region of 4 to 7 fs, the radial dependence is quite strong, so the determination of the pulse length with a difference of a few hundred attoseconds is possible.

Figure 7. Radius of the PAP, r, as a function of pulse length (FWHM in intensity), Δt, where the radius is from the measured PAP and the pulse length is measured with a SPIDER (open circles). The error bars on the data points represent the standard deviation in the single-shot radial measurement and uncertainty in the pulse length measurement of the SPIDER. See the text for details of the data fit. Additionally, the uncertainty in the pulse length measurement using a single laser shot (triangles) and the ensemble of laser shots (diamond) is displayed. Points calculated using quantitative rescattering theory (QRS) [70] for a given pulse length (filled circles) are also shown. Note: figure published in [6]. Reprinted with permission of the Optical Society.
Download figure:
Standard imageThe aforementioned fitting function is based on a simple model. Assuming the peak value of a cosine pulse is E(t=0) = E0, the absolute value at the maximum of the following half-cycle is E(t=π/ω) = E0exp ( − (π/ωτ)2). If the half-cycle yields depend on the maximum values of the electric field to some power, the L–R asymmetry in the ATI yield is expected to fit to the form 1 − exp ( − α/Δt2). An offset, β, is added for a better data fitting and can be explained as the minimum pulse length required to produce rescattered electrons. This quite crude model fits the data extremely well, with α = 9.7317 ± 1.5069, β = 1.6063 ± 0.2593 and R2 = 0.9697.
3.1.2. CEP measurement of multi-cycle pulses
As introduced in the previous section, the precision of the CEP measurement is dominated by statistical error and can be approximated by Δϕ ≃ Δr/r, if the relation between the angular coordinate in the PAP, θ, and the CEP, ϕ, is linear, i.e. when laser shots with randomly distributed CEP generate an approximately circular distribution in the PAP [5]. In the measurement, the spreading in r (Δr) is typically ≈0.1 and independent of the pulse duration. Moreover, as shown in figure 7 and equation (7), the radius, r, decreases for a longer pulse duration. Thus, as shown in figure 8, the precision of the CEP measurement, without PG, increases with pulse length and is no longer practical when the pulse duration approaches 8.5 fs and the CEP uncertainty exceeds the precision benchmark of ∼350 mrad ( ∼ 20°).
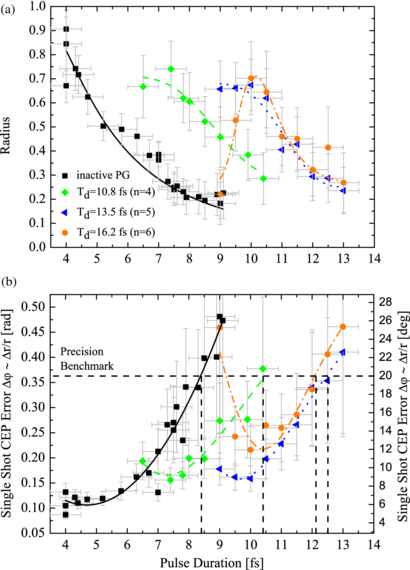
Figure 8. (a) Averaged radius in the PAP as a function of pulse duration with inactive and active PG having delays. Each point was obtained by averaging the radial coordinate of ∼40 000 consecutive laser shots with randomly distributed CEP. The lines are fitted peak functions to guide the eye for visible convenience and the error bars indicate the standard deviation, Δr, in the radius determination respectively the error of the FC-SPIDER measurement. (b) Corresponding single-shot CEP error. The dashed lines mark when the precision benchmark is exceeded. Note: figure published in [28]. Reprinted with permission of the American Institute of Physics
Download figure:
Standard imageAs shown in figure 8(b), with PG the precision of the single-shot CEP measurement is within acceptable limits, i.e. less than the aforementioned benchmark, for an extended range of pulse durations. Namely, with delays of Td = 10.8 fs and Td = 13.5 fs, a precise single-shot CEP measurement can be made for pulse durations of up to ∼10.0 and ∼12.5 fs, respectively [28]. Therefore, a PG with a delay of Td = 10.8 fs can be used to improve the CEP precision at pulse durations from 6.5 to 8.5 fs and the larger delay, Td = 13.5 fs, allows single-shot CEP measurement from 9.0 to 12.5 fs. The larger delay is required at a longer duration to maintain the gate width that is shorter than half an optical cycle (δt > ∼1.3 fs), see equation (5), which in turn ensures sufficient CEP-dependent asymmetries.
Using even larger delay, e.g. 16.2 fs shown in figure 8, yields no further improvement in the CEP precision and the CEP error is even increased for pulses below 10 fs. This behaviour is due an increased signal to noise ratio and occurs if the delay is too large in comparison to the initial pulse duration. In this case, the intensity in the leading and the trailing edge of the pulse is higher than at the gate intensity, which enables the direct electrons generated in the elliptically polarized parts to reach kinetic energies that are comparable to the ones reached by the rescattered electrons generated from the gate. These fast direct electrons act as background noise which in turn increases the CEP error. Additionally, the elliptically polarized leading edge of PG pulse ionizes the target atom almost completely so that there is almost no population in the ground state left from which the phase-sensitive electrons at the time of the gate could be generated [59]. Therefore, it is understandable why it is not possible to use larger delays, i.e. Td > 13.5 fs, to extend the range of pulse lengths for which a precise single shot CEP measurement can be made, beyond 12.5 fs.
In summary, polarization gating in combination with the CEPM can be used to achieve precise, real-time, single-shot CEP measurement over an extended range of pulse durations while all advantages of the CEPM are maintained. The achieved single-shot CEP precision was 175 mrad (∼10°) below 10 fs and 350 mrad (∼20°) up to 12.5 fs. The consumed pulse energy was below 130 μJ and, therefore, it allows data tagging, e.g. in ultra-intense laser–matter interaction with optical parametric chirped-pulse amplification (OPCPA) based terra- and petawatt class lasers, which typically operate at low repetition rates (of a few Hz) and for which standard CEP locking is hardly feasible. Additionally, the technique may serve as feedback mechanisms or as a basis for CEP pulse-picking criterion.
3.1.3. NSDI of Ar
NSDI of atoms in strong laser fields has become a paradigm for the study of correlated electron dynamics. Although NSDI has been the subject of numerous experimental and theoretical studies (see e.g. [48] for a recent review), its mechanisms are not yet fully understood. NSDI has been shown to occur via a recollision mechanism [60, 61]. Several scenarios upon the recollision of the first electron with the ion can occur, including that the recollision electron (i) excites a second electron which can be field-ionized later in the pulse (recollision with subsequent ionization, RESI) [62, 63], (ii) directly ionizes a second electron ((e, 2e) process) [35] and (iii) leads to a doubly excited complex, where both electrons are tunnel-ionized later in the laser pulse [64]. These processes are heavily dependent on the laser pulse parameters, especially the laser intensity, which is directly related to the return energy of the recollision electron.
In multi-cycle laser pulses, several half-cycles can contribute to the initial ionization and the NSDI process may occur after multiple returns of the electron, which complicates interpretation of the data. It is, therefore, desirable to record the NSDI process under conditions, where only a single laser cycle contributes to the dynamics. Although single-cycle dynamics are accessible with near-single-cycle laser pulses, the electric field waveform, which plays an increasingly important role the shorter the pulse, must be known. Therefore, the phase-tagging technique, which allows one to retrieve the waveform for each laser pulse within the experiment, is ideal.
Using 4 fs laser pulses at 750 nm that were focused to a peak intensity of 1.6×10¹⁴ W cm−2, Johnson et al studied the CEP-dependent NSDI process in Ar [8]. In this particular experiment, they measured the ion recoil momentum, pz (along the laser polarization axis), of the Ar2 + ions as a function of the CEP. The results are plotted in figure 9, which shows (a) the asymmetry parameter, defined as (n+-n−)/(n++n−), where n± is the number of ions with positive/negative pz momentum, as a function of the CEP and (b) the asymmetry map as a function of pz and the CEP. Clearly, as the CEP changes, the yield of Ar2 + ions having positive or negative pz momentum changes accordingly, indicating that the sum momentum of the electrons is also changing with the CEP. In a follow-up theoretical study by Chen et al [65], the NSDI mechanism that is largely responsible for the observed CEP dependence was assigned to the RESI mechanism.
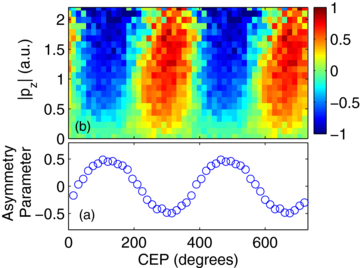
Figure 9. Experimental data from the double ionization of argon by 1.6×10¹⁴ W cm−2, 4 fs pulses showing (a) the asymmetry parameter as a function of the CEP and (b) the asymmetry map which depicts the evolution of the asymmetry parameter (indicated by the colour bar) as a function of CEP and pz.
Download figure:
Standard image3.1.4. ATI of Xe
The single-shot phase-tagged VMI can be applied in a variety of attosecond light waveform control studies, including ATI of atoms in a strong few-cycle laser field. Figure 10(a) shows an inverted, CEP-integrated VMI image of ATI photoelectrons from Xe using the single-shot phase-tagged VMI setup [7]. The laser intensity was 2.5 × 10¹³ W cm−2. The pulses with 4 fs duration at a central wavelength of 720 nm were linearly polarized along the py-axis. The electron angular distribution is similar to what was observed in earlier experiments [25]. The central part of the image consists of the directly emitted electrons, while the higher momentum part results from electrons that are driven back by the laser field to the ion and (re)scatter.

Figure 10. (a) Inverted, CEP-integrated VMI of ATI photoelectrons from Xe at 2.5 × 10¹³ W cm−2. The pulses with 4 fs duration at 720 nm are linearly polarized along the py-axis. (b) Asymmetry map as a function of photoelectron kinetic energy and CEP. (c) The asymmetry amplitude, a0, and (d) the phase shift, Δφ, as a function of the longitudinal and one of the transverse momentum components. Note: figure published in [7]. Reprinted with permission of the American Institute of Physics.
Download figure:
Standard imageFigure 10(b) shows the asymmetry, a, as a function of momentum along the laser polarization axis, py, and CEP. Here the asymmetry value was obtained by integrating over events within an angle of ±15° to the py axis. The CEP dependence for a certain position in momentum space can be expressed as a(φ) = a0cos (φ + Δφ), where a0 is the asymmetry amplitude and Δφ the relative phase shift of the asymmetry oscillation with CEP. Note that the phase measured in the CEPM is offset to the absolute CEP in the VMI by a constant term, which has to be determined, e.g. by comparison of a reference measurement to theoretical predictions, if the absolute CEP dependence is required. Figures 10(c) and (d) show the asymmetry amplitude, a0, and the phase shift, Δφ, respectively. Electrons in the cutoff region show the highest asymmetry amplitude. Slower electrons exhibit a complex structure both in amplitude and phase shift. It is desirable to compare such high-quality low-noise data to theoretical predictions to test our current theoretical models and potentially uncover new details of the underlying physics.
3.1.5. Electron emission from SiO2 nanospheres
The application of phase-tagged VMI is not limited to atomic and molecular systems. A recent study on dielectric nanospheres has demonstrated the CEP-controlled electron emission and acceleration in the enhanced near-fields near these nanoparticles [52]. The results indicated a novel, phase-sensitive acceleration process of photoelectrons based upon backscattering in the presence of a dynamic field. In [52], a jet of SiO2 nanoparticles with sizes between 50 and 150 nm was focused into the interaction region of the VMI using an aerodynamic lens [66]. This method employs the vapourization of a low concentration solution of nanoparticles contained in a solvent by a carrier gas. The vapour is dried and carrier gas is removed by differential pumping after the last aperture of the aerodynamic lens. In the experiment typically 0–1 nanoparticles are hit within a single laser shot. Therefore, some images contain just a background produced by the ATI signal from the residual carrier gas entering the chamber and not the desired nanoparticle signal. In contrast to the studies contained in [52], which employed CEP stabilization and averaging over multiple laser shots, the phase-tagged, single-shot, VMI approach employed here and detailed in [7] allows for efficient suppression of residual carrier gas ATI signals.
3.2. CEP locking via stereo-ATI feedback
Although the preceding data illustrate the power and versatility of CEP tagging, when control of a CEP-dependent process is required, CEP locking must be employed. Furthermore, as these effects are of great interest in many fields, there is ongoing effort to improve and advance CEP locking techniques, e.g. see [12, 57, 67, 68]. Recently, Adolph et al [27] determined the effectiveness of replacing the typical f–2f slow-loop CEP feedback with a CEPM. The quality of the CEP lock is determined by measuring the CEP jitter in the short and long term, i.e. on the minute and hour time scales, as shown in figure 11.

Figure 11. (a)–(c) Short-term CEP stability measurements with the out-of-loop CEPM2 shown in figure 6. Note the significant improvement in CEP stability with the CEPM (c) as compared to the f–2f (b). (d)–(f) Long-term CEP stability measurements. Note: figure adapted from [27]. Reprinted with permission of the Optical Society.
Download figure:
Standard imageA typical short-term phase measurement with the oscillator locked at 188 mrad rms is shown in figure 11 (top). After amplification, frequency broadening and temporal compression, the out-of-loop CEPM measures a CEP jitter of 423 mrad rms without the slow-loop feedback. Implementing the slow-loop f–2f feedback does not improve the short-term stability, which is not surprising as this feedback mechanism is designed to correct only slow drifts, and results in a CEP jitter of 450 mrad rms. In contrast, implementing the CEPM feedback significantly improves the CEP jitter to 294 mrad rms. This improvement is due to three main factors: (i) typically f–2f measurements average multiple laser shots and have a dead time for computation while the CEPM measurement determines the CEP for every laser shot and uses a floating average for feedback. (ii) The CEPM has about a factor of 3 less intensity dependence than the f–2f measurement, thereby reducing CEP-intensity crosstalk [5, 57]. (iii) Unlike the CEPM, which takes into account the entire frequency composition of the pulse, typically f–2f measurements only analyse a small portion of the frequency spectrum, which can result in an erroneous CEP measurement [69].
As shown in figure 11 (bottom), the CEPM also increases long-term stability preventing drifts on the hour time scale. With only the fast-loop oscillator lock of 204 mrad rms, the CEP error was 442 mrad rms with a noticeable drift near the end of the acquisition period. Both the f–2f and CEPM slow-loop feedback mechanisms correct for this CEP drift over a few minutes. However, the increased short-term response of the CEPM is reflected in a significantly better CEP stability of 368 mrad rms as compared to 478 mrad rms with the f–2f feedback loop.
4. Summary and outlook
In summary, the waveform dependence of ATI in Xe, particularly the sinusoidal CEP dependence of the asymmetry for rescattered electrons, can be utilized as a tool to determine the waveform of ultrashort laser pulses [2–6, 29]. Moreover, optimizing experimental conditions and electronics allows for precise, real-time, every-single-shot analysis, which has recently been utilized in several pioneering implementations.
First, by displaying the output information on an oscilloscope, one has a way to optimize and monitor an ultrashort pulse train with instant visual feedback and attosecond sensitivity. Namely, the PAP shown in figure 2(c) responds to changes in laser parameters with changes in shape—(i) radius, r, with pulse length, (ii) angle, θ, with CEP, (iii) angular distribution, Δθ, with quality of a CEP lock, and (iv) radial distribution, Δr, with overall stability of the system.
Second, the aforementioned properties of the CEPM also facilitate data tagging for other studies done in the event mode, e.g. each event in a COLTRIMS measurement can be tagged with the CEP measured for the corresponding laser pulse [8]. In contrast to typically temperamental CEP locking, CEP tagging has the distinct advantages of being less complicated and more robust allowing continuous measurements over hours or days. This allows access to and accuracy in measurements previously unobtainable due to statistical limitations, e.g. the study of NSDI of Ar presented here [8], ATI in molecules [72] and molecular ions [73, 74], and sequential multiple ATI [75, 76]. Moreover, the advantages of data tagging may have begun a paradigm shift away from CEP locking as is reflected in the recent development of high-speed, single-shot VMI [7].
Third, the advantages of this technique can be utilized to improved CEP locking for instances when CEP tagging is not applicable [27]. Replacing the typical f–2f slow-loop CEP lock with a CEPM has the advantages of no dead-time, full spectral response, and decreased CEP-intensity crosstalk. These factors lead to a significantly improved CEP lock.
With ongoing improvements to this technique (e.g. the extension of the CEPM to the multi-cycle regime [28, 30], which enables CEP-dependent studies with a new class of OPCPA based terra- and petawatt lasers operating at low repetition rates), recognition of the advantages of data tagging (e.g. those illustrated in a COLTRIMS measurement of NDSI in Ar [8]) and advancements in existing measurement techniques allowing for data tagging (e.g. high-speed, single-shot VMI [7]), the CEPM or similar devices [77] have the potential to become a mainstay in the ultrashort and attosecond experimental communities. The door is now open to a multitude of previously inaccessible CEP-dependent processes and a new benchmark has been set for the precision of CEP-dependent measurements.
Acknowledgments
We acknowledge significant experimental support from B Bergues, S Zherebtsov, W Müller, K Rühle, D Hoff and G Stibenz. Financial support from LaserLab Europe; the German Research Foundation (DFG) grant PA 730/4; the Emmy-Noether program, SPP 1391; the Cluster of Excellence: Munich Center for Advanced Photonics (MAP); the Chemical Sciences, Geosciences and Biosciences Division, Office of Basic Energy Sciences, Office of Science, US Department of Energy; and the National Science Foundation under CHE-0822646 and EPS-0903806 and matching support from the State of Kansas through the Kansas Technology Enterprize Corporation; and an ERC Starting Grant is gratefully acknowledged.