
Abstract
We present a semi-analytical model for free electron production induced by multiphoton ionization in dielectric materials for short laser pulses at moderate intensities. Within this approach, the laser-induced absorption is described through the Bloch–Volkov formalism, and the electronic structure of materials is evaluated through first-principles calculations. Results obtained for NaCl and KDP (KH2PO4) materials show that significant deviations from the parabolic band approximation may occur. When the laser intensity increases, high multiphotonic orders may become the predominant mechanisms outside the centre of the Brillouin zone.
Export citation and abstract BibTeX RIS
1. Introduction
The irradiation of materials by intense and short pulses leads to various physical phenomena, possibly inducing significant local modification of the material. In the case of large bandgap dielectric materials, the beginning of the interaction mainly consists of the transition of valence electrons to the conduction band, i.e. ionization. First, electrons are generated either through the simultaneous absorption of several photons or through the tunnel effect. Then, electrons can be promoted to the conduction band via collisional ionization. For a high enough laser intensity, this ionization process may lead to the formation of a dense plasma [1] whose heating by the laser may lead to a significant temperature rise [2, 3] and associated pressure variations, with subsequent material modification. An accurate knowledge and modelling of these mechanisms is crucial to consider in applications such as nano-structuration [4], waveguides [5] or laser-induced damage of optical materials such as SiO2, Al2O3, or KDP (KH2PO4).
In particular, an accurate description of the plasma formation stage is required since its properties will provide the characteristics of the subsequent temperature field and pressure wave. This description can be achieved through the modelling of the multiphoton absorption (MPA) in condensed matter, a physical mechanism which is shown to occur for intensities roughly below 100 TW cm−2 according to the Keldysh theory [6]. For higher intensities, tunnel ionization dominates. This field has been intensively studied and various models can be found in the literature. An exact evaluation of the ionization rate due to MPA may be obtained by utilizing ab initio calculations: for instance, the time-dependent density functional theory (TDDFT) [7]. However, this kind of approach is very cumbersome and may lead to a loss of information regarding the involved physical processes, i.e. details of the transitions in the Brillouin zone (BZ) may not be available [8, 9]. On the other hand, analytical developments have been carried out, see for instance [10] for a review. They offer the possibility of providing extensive parametric studies with respect to the laser pulse characteristics, and highlight the transition paths. However, they generally assume very simple electronic structures, such as parabolic bands. It results that their predictions are reliable mainly in the centre of the BZ where the band structure generally exhibits parabolic features [11, 12]. Moreover, based on an analytical description of the band structure, Gruzdev pointed out the influence of the band structure shape on the ionization rate [13]. Furthermore, for real materials, deviations from a simple analytical description of band curvature may be very important [14]. In the case of sufficiently intense pulses, for which contributions to the ionization rate coming from the edge of the BZ may become significant, the previous analytical approaches a priori fail. A compromise between time-dependent ab initio and analytical calculations consists in considering perturbative approaches where matrix elements are evaluated through stationary first-principles calculations [15]. Doing so, the MPA cross section with band structures relevant to real materials can be evaluated. The use of stationary ab initio calculations such as the one based on the density functional theory (DFT) can provide relatively quick calculations. However, calculations are no longer tractable in the case of high order MPA [15]. An approach to evaluate the ionization rate for high order MPA in the case of real materials thus remains to be developed.
Hereafter we propose such an approach based on a coupling between an analytical description of the MPA process through the Bloch–Volkov (BV) formalism [16] and a first-principles approach describing accurately the electronic structure of the material. It relies on the evaluation of the transition amplitude between an initial unperturbed state of the valence band and a final perturbed state of the conduction band. The final state is dressed with the Volkov phase that accounts for the MPA process, as has been shown in previous studies [16–22]. Doing so, a tractable semi-analytical expression is obtained for the transition amplitude, which depends on the laser pulse characteristics and on the material electronic properties. The electronic structure of the material of interest, i.e. the stationary wavefunctions and associated energies, is given by field-free ab initio calculations. Due to the success of the DFT [23, 24], this method has been used in the present study. This model, called BV-DFT, provides an efficient way to evaluate the ionization rate due to MPA of any dielectric material irradiated by laser pulses at moderate intensities, as long as its electronic structure can be evaluated. The present study highlights the influence of the band structure on the ionization rate, and the importance of considering the whole BZ instead of the centre only, since significant transitions may occur outside the BZ centre, as shown hereafter. The laser intensity is also found to play a major role, as it appears to favour some transitions, and thus some particular multiphotonic orders.
The theoretical basis of the model is given in section 2, as well as details of the ab initio formalism utilized to evaluate the electronic structure in the present work. Preliminary studies have been performed within the framework of the well-known parabolic band approximation, where the material is characterized only by its bandgap and its effective masses. Using simple band structures allows one to understand the physical processes responsible for the electron production in the conduction band. Moreover, it is also convenient to investigate the influence of various parameters on the ionization rate. The results obtained from this revisited model are presented in section 3 and provide the basis of a more extensive work focused on more complex band structures, that is on real materials.
Two materials of interest have been studied in section 4. First, NaCl for its simple band structure and because extensive earlier studies of laser-induced damage in this material have provided multiple experimental and modelling results to refer to. Next, potassium dihydrogen phosphate KH2PO4 (KDP) crystal has been studied because it is widely used as a frequency converter in laser facilities, especially for high-power lasers [25]. Several studies have been carried out, including the influence of the laser intensity, the photon energy and the laser wavelength on the ionization rate. To highlight the influence of the band structure on the ionization rate, the same bandgap of 8 eV has been attributed to both materials. It shows that the laser-induced electronic density is not only dependent on the bandgap but also on the band structure shape. Moreover, it is shown that some multiphotonic transitions can be favoured, depending on the irradiation conditions. Conclusions and outlooks of this work are presented in section 5. Analytical details are provided in appendices A and B.
2. Theory
2.1. Model developments
The present study is carried out in the single-particle framework, i.e. a transition involves only one electron. The exact expression for the ionization rate W can be derived from the time-dependent transition amplitude Tcv between an initial unperturbed valence state  and a final conduction state
  accounting for an electron feeling both the crystalline and laser fields:
where atomic units are used throughout this section. In the dipole approximation and within the velocity gauge, the interaction Hamiltonian reads  , where
  is the vector potential associated with the laser radiation which is, for a linearly polarized laser field, defined as:
  , with ϕ the laser pulse phase, ω the laser frequency and τp the pulse duration. Note that another envelope different from the squared-sine shape may be used, but should lead to similar conclusions. The associated electric field is derived from the vector potential as:
  .
.
In order to find a tractable expression for the transition amplitude, the final state is approximated by the Bloch–Volkov wavefunction [16, 17]:
with  the unperturbed final state of the conduction band.
  stands for the electron wavevector in the BZ. Within this framework, it was shown that the phase
  may introduce spurious behaviour in the electron dynamics [26, 27]. Further, note that for large intensities, the ponderomotive energy term may induce a significant energy shift of the conduction states, which may subsequently modify the ionization rate. For this reason, the present approach should not be used for too large intensities. A discussion about the underlying assumptions and the domain of validity of the present approach is provided in section 2.2.
The MPA process is addressed by the Volkov phase  , which can be analytically developed in Bessel functions of integer order Jn(x), allowing one to identify the various multiphoton orders:
with  . Here p corresponds to the number of absorbed or emitted photons. In this development, note that the use of a finite pulse duration leads to three Bessel functions, whereas only one appears when no envelope is present [17, 18], i.e. within stationary conditions with τp → ∞, then corresponding to a pure monochromatic laser pulse.
Due to the periodicity of crystals, the stationary states  and
and  are Bloch wavefunctions. They can be expanded in a plane wave basis set as
  , where
  are vectors of the reciprocal lattice, and
  are weighting coefficients of each plane wave. Ab initio calculations can be performed to evaluate either the weighting coefficients or the matrix elements. We have chosen to focus on the matrix elements, as they are directly provided by the DFT code ABINIT [32] utilized in this study.
Within this framework, equation (1) leads to the following expression for the transition amplitude:
with xi terms accounting for energy conservation. The laser phase ϕ has been set to zero in the present work, which does not have any repercussion on the ionization rate since the laser pulse duration is long enough to include several optical cycles. Details of the derivation are available in appendix A.
Considering the expression for the transition amplitude, note that the arguments of the Bessel functions are zero in the centre of the BZ due to the coordinates of the Γ point kΓ(0,0,0). Since Jn(0) = 0 when n ≥ 2, with n the number of photons, only linear processes occur in the centre of the BZ.
It has been shown that this method is valid as long as a transition between two states does not involve any intermediate state [19, 28]. In order to take into account an ionization process assisted by an intermediate state, this state should be added in the model, as was done in [28].
In what follows, the quantity of interest is the electronic density, given by N = ∑k|Tcv|2. The ionization rate, i.e. the number of electrons generated by unit of volume and time, can also be derived from the model:  . However, it is not studied here.
2.2. Assumptions and domain of validity of the present model
The assumptions and the subsequent domain of validity of the present approach are discussed hereafter. A first influence which is neglected corresponds to possible band structure modification (BSM) due to the intense laser field [29–31, 13]. According to Gruzdev [13], in the case of stationary conditions, where, in particular, adiabatic conditions stand (electronic rearrangements following laser excitation have time to take place in the course of interaction), such modifications become important for a threshold field E0 ≃ 2.4ħω/ed, where d is the characteristic size of a unit cell of the lattice. For d = 0.6 nm and ħω = 4 eV, which is a photon energy often used in the present paper, the threshold intensity is close to 50 TW cm−2, which corresponds to the upper limit of the domain of validity of the present approach. Note that the larger the photon energy, the higher the threshold intensity.
The ponderomotive term appearing in the Volkov phase has been removed, as mentioned previously. This assumption remains further reliable as long as the ponderomotive energy  (where the influence of the pulse envelope is included) remains small compared to the band gap. For the above intensity of 50 TW cm−2, Up is of the order of 0.15 eV for ħω = 4 eV. The influence of the ponderomotive term is thus expected not to be significant in the domain of validity. Furthermore, note that this upper limit corresponds roughly to the condition where the Keldysh parameter [6] becomes smaller than unity—that is, when tunnel ionization becomes predominant compared to MPA.
Other further assumptions have been made in order to develop the present approach:
- Core electrons do not take part in the ionization process, only valence electrons can participate, which is realistic according to the range of intensities considered in this study.
- No transition is allowed between two states belonging to the same band.
- The decrease of the level population of the valence band is not taken into account, which means that, for high intensities, the electronic density reached in the conduction band may be overestimated for densities in excess of roughly 1022 cm−3, which corresponds to a non-negligible part of the valence density which is of the order of 1023 cm−3.
- Transitions assisted by phonons are not considered.
It is worth noting that for ultra-short interactions departing from stationary conditions (with pulses shorter than 10 fs or so at 800 nm, for instance), electronic rearrangements may not have enough time to fully take place (a few fs are required or even longer duration). It follows that BSM following electronic rearrangements may not take place in the course of the interaction. It turns out that the domain of validity with intensity is expected to be more extensive.
In the following, in order to highlight various physical trends, calculations have been performed for various intensities, i.e. 0.1, 1, 10, and 100 TW cm−2. Note that the latter value is slightly outside the domain of validity of the present approach. However, it has been used because it allows one to clearly exhibit contributions of high order multiphoton processes. In this case, only trends are provided. This fact is further stressed in the following each time that such conditions are chosen.
3. The revisited parabolic band approach
The present model has first been validated on a simple 1D electronic structure designed within the parabolic band approach. This preliminary study allows one to analyse finely the physical processes responsible for the laser-induced ionization without making any ab initio calculations. The interaction part of the present model can thus be validated with this simple band structure. Furthermore, results obtained from this revisited model provide trends helpful for the understanding of more complex studies carried out on real materials in section 4.
In this study, the matrix elements have been derived analytically. In a parabolic band configuration, the material is only characterized by its bandgap energy Eg and by the effective masses of its various bands. The energies associated with the parabolic bands depend on the wavevector  , i.e. on the location in the BZ.
The following calculations have been carried out with a pulse duration of 100 fs and a linear polarization along the  direction. First, only two states have been considered: an initial state belonging to the valence band of energy
  (in atomic units), and a final state belonging to the conduction band of energy
  . A hydrogen-like potential has been chosen to model the bound valence electron leading to φv(x) = exp(−α|x|)exp(ikx), and a plane wave represents the free conduction electron leading to φc(x) = exp(ikx), with α a positive parameter related to the spatial expansion of the wavefunction. Under these assumptions, the expression for the matrix elements reads:
with a the lattice parameter. In the following, calculations have been performed with α = 1 a.u., the bandgap has been set to 8 eV, the lattice parameter to 7.95 Å, and different effective masses have been chosen according to those of KDP: mv = 3me and mc = me, where me is the free electron mass.
In order to check the reliability of our model, the behaviour of the produced electronic density with respect to the laser intensity has first been studied. The electronic density has been evaluated within this simplified approach for several wavelengths: λ = 155, λ = 310 and λ = 465 nm. Results are shown in figure 1.

Figure 1. Laser-induced electronic density in the conduction band as a function of the laser intensity for several wavelengths: λ = 155 nm (black solid line), λ = 310 nm (red dashed line) and λ = 465 nm (green dotted line).
Download figure:
Standard image High-resolution imageWithin a log–log scale, results show three straight lines with various slopes. Each corresponds to different multiphotonic orders: one-photon absorption for 155 nm, two-photon absorption for 310 nm and three-photon absorption for 465 nm. As expected, the electronic density scales as IN, with a slope of N in log–log scale related to the N-photon absorption process. This behaviour agrees with the theoretical expectations [6] and with the experimental observations [37]. Note that when the number of photons increases, the generated electronic density falls by several orders of magnitude with the present parameters.
The evolution of the electronic density as a function of the wavevector in the BZ is shown in figure 2 for ħω = 4 eV and various intensities. Along the BZ chosen to lie in the interval ![$[-\frac{5 \pi }{a};\frac{5 \pi }{a}]$](https://content.cld.iop.org/journals/0953-8984/25/23/235501/revision1/cm451413ieqn90.gif) , several transitions take place. They involve from two photons near the centre of the BZ to six photons near the edge. The oscillations occurring between two resonant states exhibit a cardinal sinus-like behaviour due to the finite pulse duration [38]. Each transition takes place in a different location of the BZ, according to the energy conservation principle. Note that two photons are required to get a transition at the centre of the BZ. However, since no multiphotonic transitions can occur in the centre of the BZ, as shown in section 2, the two-photon absorption peak is slightly shifted to a non-zero value of k.
, several transitions take place. They involve from two photons near the centre of the BZ to six photons near the edge. The oscillations occurring between two resonant states exhibit a cardinal sinus-like behaviour due to the finite pulse duration [38]. Each transition takes place in a different location of the BZ, according to the energy conservation principle. Note that two photons are required to get a transition at the centre of the BZ. However, since no multiphotonic transitions can occur in the centre of the BZ, as shown in section 2, the two-photon absorption peak is slightly shifted to a non-zero value of k.
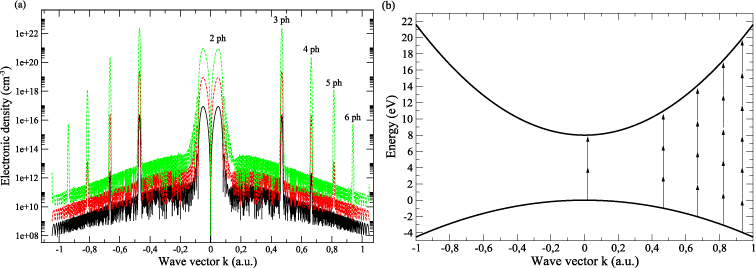
Figure 2. (a) Laser-induced electronic density in the conduction band as a function of the wavevector k for ħω = 4 eV and three laser intensities: 1 TW cm−2 (black solid line), 10 TW cm−2 (red dashed line) and 100 TW cm−2 (green dotted line). (b) Parabolic band structure used for this calculation. The arrows show the ionization paths due to MPA.
Download figure:
Standard image High-resolution imageFor a 1 TW cm−2 laser pulse, the major contribution to the ionization comes from the two-photon absorption occurring near the centre of the BZ. The three-photon absorption is one order of magnitude below, and finally the four-photon absorption is five orders of magnitude below. When the laser intensity increases to 10 TW cm−2, the three-photon absorption reaches the magnitude of the two-photon absorption, and it becomes the predominant process when the laser intensity is set to 100 TW cm−2. Note that modelling calculations for the latter intensity can only provide physical trends due to the domain of validity of the present approach. Under these conditions, significant contributions to the total production of conduction band electrons are due to transitions not occurring in the centre of the BZ.
The previous trend is due to two main reasons. First, the matrix element evolution with respect to the wavevector. Indeed, one can see from equation (5) that the matrix elements are directly proportional to the wavevector k, which makes the ionization rate evolve as the square of the wavevector. As a consequence, the matrix elements are much greater on the edges of the BZ than at the centre. Second, the predominance of the three-photon process over the two-photon process is enhanced by the behaviour of the multiphotonic ionization rate: W ∝ IN, which means that the three-photon process varies faster than the two-photon process.
In order to get closer to complex band structures relevant for real materials, the band structure has been expanded by adding a valence state and a conduction state under the following assumptions: each state of the valence/conduction band has the same effective mass, and the energy difference between two states of the same band corresponds to a tenth of the bandgap energy. The electronic density is shown in figure 3 with the same irradiation condition as in figure 2. Note also that predicted results for 100 TW cm−2 are not expected to be quantitative, but should provide physical trends.

Figure 3. Laser-induced electronic density in the conduction band with respect to the wavevector k for ħω = 4 eV. Transitions occur between two valence levels and two conduction levels, as shown in the inset. (a) Three laser intensities are considered: 1 TW cm−2 (black solid line), 10 TW cm−2 (red dashed line) and 100 TW cm−2 (green dotted line). (b) Zoom on the positive values of the wavevector for I = 100 TW cm−2.
Download figure:
Standard image High-resolution imageAs expected, three new transitions occur for each multiphotonic order, although only two new peaks are visible because two transitions take place for the same wavevector, producing the predominant peak in the middle. For the two-photon absorption process, the four peaks are superimposed. The inset in figure 3 shows the four different transitions for the second order, two of them being merged together. This result shows that the transitions between the valence band and the conduction band are very sensitive, both to the band structure, which determines the place in the BZ where the transitions occur, and to the laser intensity, which favour some transitions contributing most to ionization.
Now, the evolution of the electronic density as a function of the photon energy is investigated. For the purpose of this study, the first four multiphotonic orders have been extracted from the whole formula of equation (4), and each order is considered separately. The study requires integration over the BZ ![$[-\frac{\pi }{a},\frac{\pi }{a}]$](https://content.cld.iop.org/journals/0953-8984/25/23/235501/revision1/cm451413ieqn94.gif) . Only one valence band and one conduction band are considered, with Eg and effective masses as previously chosen. A laser intensity of 0.1 TW cm−2 is used. Results are presented in figure 4 for four multiphotonic orders.
. Only one valence band and one conduction band are considered, with Eg and effective masses as previously chosen. A laser intensity of 0.1 TW cm−2 is used. Results are presented in figure 4 for four multiphotonic orders.

Figure 4. Laser-induced electronic density in the conduction band as a function of the photon energy in the case of: (a) one-photon absorption, (b) two-photon absorption, (c) three-photon absorption and (d) four-photon absorption. The laser intensity is I = 0.1 TW cm−2, and only one valence and one conduction parabolic band are used in this calculation.
Download figure:
Standard image High-resolution imageIn a general way, the electronic density evolves at the threshold as (see appendix B):
with N is the number of photons. In the case of the one-photon absorption process, it leads to the well-known behaviour as  [10], which is consistent with the result found in figure 4. As the number of photons increases, the behaviour of the four calculations evolves in agreement with the above analytical expression. The evolution of the electronic density with respect to the laser frequency is thus a signature of the multiphotonic order.
In order to study the consequences of a more complex band structure, a valence state and a conduction state have been added in two different ways: either by changing the curvature of the duplicated states (mv = 4me and mc = 2me) or by shifting them by the same value of 0.8 eV. Results are presented in figure 5 for I = 0.1 TW cm−2. All multiphotonic orders are now taken into account. The integration over the BZ was extended to a wider zone ![$[-\frac{5 \pi }{2 a},\frac{5 \pi }{2 a}]$](https://content.cld.iop.org/journals/0953-8984/25/23/235501/revision1/cm451413ieqn102.gif) in order to make visible the high order absorption processes. The solid line curve shows a series of absorption processes of different multiphotonic order, depending on the photon energy. The three-photon absorption process takes place when the photon energy is high enough to induce a transition at the centre of the Brillouin zone, namely for ħω = 2.67 eV. Then the two-photon absorption process begins when ħω = 4 eV and vanishes when getting to the edge of the BZ for ħω = 6.5 eV. The lowest energy required for the one-photon absorption is the one corresponding to the bandgap energy, i.e. 8 eV. It explains the lack of transition between the one-photon process and the two-photon process.
in order to make visible the high order absorption processes. The solid line curve shows a series of absorption processes of different multiphotonic order, depending on the photon energy. The three-photon absorption process takes place when the photon energy is high enough to induce a transition at the centre of the Brillouin zone, namely for ħω = 2.67 eV. Then the two-photon absorption process begins when ħω = 4 eV and vanishes when getting to the edge of the BZ for ħω = 6.5 eV. The lowest energy required for the one-photon absorption is the one corresponding to the bandgap energy, i.e. 8 eV. It explains the lack of transition between the one-photon process and the two-photon process.

Figure 5. Laser-induced electronic density in the conduction band as a function of the photon energy for I = 0.1 TW cm−2. Band structure configuration: one valence state and one conduction state (black solid line), two valence states and two conduction states with different curvature (green dotted line) and with an energy level shift (red dashed line). Bottom insets with band structures: band structure corresponding to the green dotted line (bottom left), band structure corresponding to the red dashed line (bottom right).
Download figure:
Standard image High-resolution imageWhen the two states are duplicated and shifted, the available energy range for each multiphotonic order is widened. This is illustrated by the descending steps emerging at the end of each absorption group in the dashed line curve. As a consequence, the distance between the two-photon absorption process and the one-photon absorption process reduces. It is expected that with some additional states, the various absorption groups may merge into a unique one, making it difficult to differentiate the contributions of different multiphotonic orders. The same analysis can be utilized to explain the dotted line curve shape, for which the curvatures of the duplicated states have been modified. In that case, the energy range is smaller because the new curvatures are smaller than the original ones. Similar steps appear but the energy distribution is identical.
These results show that the laser-induced electronic density is strongly dependent on the band structure shape. A slight variation of the curvature or any additional state induces a significant modification of the produced electronic density. As a consequence, this simple model gives accurate results on the whole BZ, but only results obtained in the centre of the BZ have a physical meaning. When predictive results are required, and comparison with experiments is needed, the complex structures of real materials thus should be utilized.
4. Application to real materials
Two materials of interest have been considered: NaCl and KDP. The first study has been carried out for NaCl because of the various available data in the literature and because the simple electronic structure emerging from its crystal structure including only two atoms per primitive unit cell. Then, KPD has been chosen because of its interesting properties as frequency converters and because it is extensively used in laser facilities.
In order to figure out the influence of the band structure alone, the same bandgap energy of 8 eV is used for both materials. This is a reasonable assumption since the experimental values of the bandgap are 8.6 eV [39] for NaCl and 7.8 eV [40] for KDP. The 'scissor operator' [36] has been utilized to increase the values of the bandgap obtained within the DFT formalism: 5.4 eV for NaCl and 5.2 eV for KDP, with calculation parameters as described hereafter. These values are consistent with previous results [14, 41–43].
Ab initio calculations based on the DFT have been performed to evaluate the matrix elements and the energy bands. The ABINIT code [32] dealing with 3D-periodic systems has been utilized. It numerically solves the Kohn–Sham equations by expanding the periodic parts of the Kohn–Sham wavefunctions on a plane wave basis set. Computations were performed within the generalized gradient approximation [33] in the projector augmented wave (PAW) formalism [34]. The latter allows one to treat explicitly only the external (valence) electrons that contribute to chemical bonding in the system, among which we find the ones that contribute to the transitions. The core electrons, which occupy deep levels, are frozen and are not treated explicitly in the calculation. It constitutes, in general, an excellent approximation ('frozen-core approximation'). The electronic structure is extracted from CONDUCTI [35], an ABINIT subprogram, which gives the 3D linear response of the material. The fact that the DFT is a theory developed to model the ground state leads to a wrong estimate of the excited states, i.e. of the energies associated with the conduction band levels. A way to get the real bandgap energy, and thus to perform calculations under realistic conditions, is to shift uniformly each conduction band towards higher energies. This procedure, known as the 'scissor operator' [36], relies on the fact that the energy difference between two levels of the same band is correct, whereas the energy difference between the two bands is not.
For the electronic properties of NaCl, the 2s, 2p, 3s and 3p orbitals are considered as valence orbitals. The energy cutoff of the plane wave basis functions is set to 816 eV. In order to test the convergence with the number of  -points used to perform the integration over the BZ, the one-photon absorption rate has been evaluated as a function of the photon energy for several configurations: 28, 60, 110, 182, 282 and 408
  -points in the irreducible BZ. We expect the absorption process to start significantly for a laser energy of 8 eV, which corresponds to the value of the bandgap. This is the case when a sufficient number of
  -points are chosen. In this study, the convergence is reached when 280
  -points are used to sample the irreducible Brillouin zone, that is, for a 14 × 14 × 14 reciprocal space grid. This is due to the fact that the integration over the BZ is performed by using a given
  -point mesh, corresponding to
  -points homogeneously distributed over the BZ. Hence, this mesh may not contain high-symmetry
  -points such as the Γ point (centre of the BZ). When the number of
  -points increases, the Γ point is closely surrounded by
  -points and the accuracy is improved, leading to the convergence.
The electronic density of NaCl as a function of the photon energy is presented in figure 6. It takes into account the transitions occurring only between two states: the top of the valence band and the bottom of the conduction band. All the multiphotonic orders are considered. The laser intensity is set to 100 TW cm−2 in order to clearly exhibit contributions of high order multiphoton processes. However, note that only physical trends are expected, as previously mentioned. In this configuration, the multiphotonic orders above four are not visible because they are drowned into the background tail of the one-photon absorption process. Results show that the electronic density no longer follows the simple behaviour derived within the parabolic band approach given by equation (6). This can be explained by the fact that the transitions now occur along a more complex band structure than a parabolic one. A closer look at the different contributions shows that, around 3 eV, the three- and four-photon processes provide equivalent contributions to the electronic density. Around 4 eV, the same phenomenon occurs with the two- and three-photon processes. This is due to the fact that when the laser intensity is high enough, the configuration of a complex band structure can favour simultaneously transitions involving N photons and N + 1 photons occurring in different areas of the BZ.
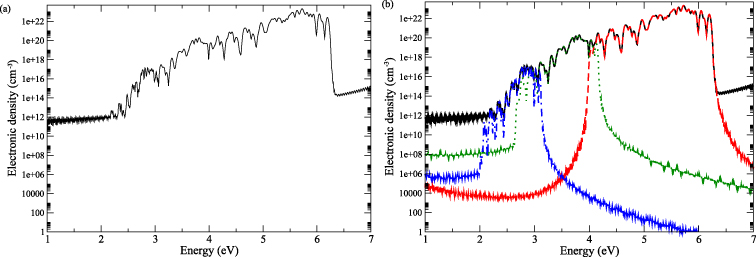
Figure 6. Laser-induced electronic density in the conduction band of NaCl as a function of the photon energy for I = 100 TW cm−2. Transitions occur between two states: the top of the valence band and the bottom of the conduction band. (a) All multiphotonic orders are included. (b) Various MPA contributions are extracted: two photon (red dashed line), three photon (green dotted line) and four photon (blue dashed–dotted line).
Download figure:
Standard image High-resolution imageThe same calculation was performed in figure 7 using more energy bands and a laser intensity of 0.1 TW cm−2. All the multiphotonic orders are considered here.

Figure 7. Laser-induced electronic density in the conduction band as a function of the photon energy for I = 0.1 TW cm−2 in the NaCl crystal. Three configurations are considered: one valence state and one conduction state (black solid line), three valence states and three conduction states (red dashed line) and ten valence states and ten conduction states (green dotted line).
Download figure:
Standard image High-resolution imageWhen the number of states increases, the gap between the one-photon process and the two-photon process is filled by additional two-photon absorption processes occurring between the additional valence and conduction states. This is the same phenomenon as the one observed previously in the parabolic band approach. However, this result must be carefully interpreted because some additional states may be resonant, and our model does not take into account the effect of intermediate resonant states on the ionization rate. Despite the fact that this result may not be quantitatively exact, it shows the qualitative evolution of the electronic density with the photon energy and highlights its strong dependence on the band structure.
The equal contribution of several processes of different multiphotonic orders is easily observable along the BZ, as shown in figure 8. For that purpose, the band structure has been reduced to one valence state and one conduction state. The electronic density is presented along several high-symmetry  -points of the BZ for various intensities. Three different photon energies are considered: 4, 2.67 and 2 eV. For each photon energy, intensities of 1, 10, and 100 TW cm−2 are used. Note that the latter intensity allows one to exhibit high order multiphoton processes, but which is slightly outside the domain of validity of the present approach.
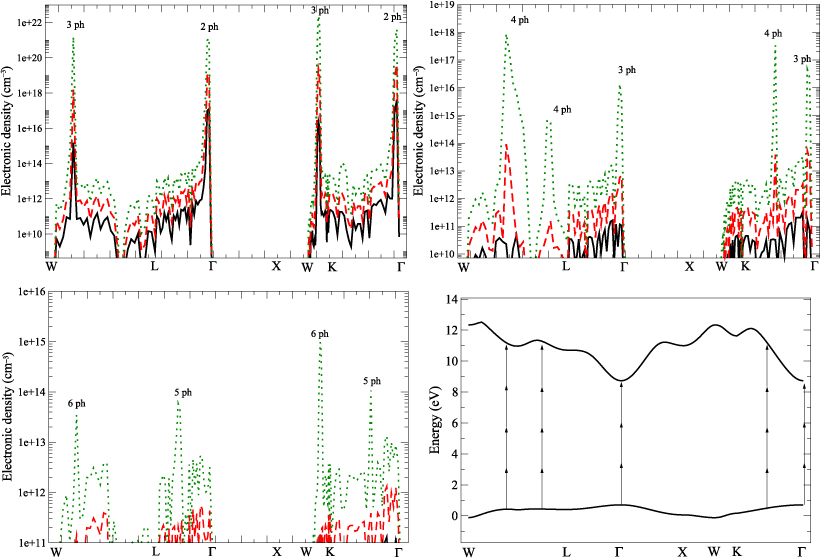
Figure 8. Laser-induced electronic density in the conduction band of NaCl as a function of the path in the BZ for several photon energies: (a) ħω = 4 eV, (b) ħω = 2.67 eV and (c) ħω = 2 eV. Three intensities are considered: 1 TW cm−2 (black solid line), 10 TW cm−2 (red dashed line) and 100 TW cm−2 (green dotted line). (d) NaCl band structure with the top of the valence band and bottom of the conduction band. Arrows stand for three- and four-photon absorption (ħω = 2.67 eV).
Download figure:
Standard image High-resolution imageFor each photon energy, significant transitions occur at given locations of the BZ for which energy conservation is fulfilled. Around these specific areas, either the contribution is reduced to a background noise, or there is no transition allowed at all. There are two kinds of regions where the transitions are forbidden: the high-symmetry points—W, L, Γ, X, W, K, Γ—for which matrix elements are zero, and the regions where the  -points coordinates are zero in the direction of laser polarization (
 ). This is illustrated by figure 9, which shows the projected matrix elements over the
  direction.

Figure 9. NaCl matrix elements projected over the direction of the laser polarization ( ) along a chosen path in the BZ.
Download figure:
Standard image High-resolution imageOne can see that between the  -points Γ and W, the projection of the matrix elements over a specific direction is close to zero. This is explained by the fact that, in a rough approximation, the wavefunction of the final state reads ϕc ∝ exp(ikxx). As a consequence, the projected matrix element is of the form kx〈ϕc|Ax|ϕv〉. Between Γ and W, we have checked that the coordinates kx are zero, which explains the lack of transitions between these specific
  -points, as can be seen in figure 8. From a general point of view, the variations of the electronic density follow those of the projected matrix elements.
For a laser energy of 4 eV, two main processes compete: the two-photon absorption process and the three-photon absorption process. For an intensity of 0.1 TW cm−2, the two-photon process dominates. When the intensity increases up to 10 TW cm−2, the amplitudes of both processes are comparable. Then the three-photon process becomes equivalent to the two-photon process from 10 TW cm−2. This reversal comes from the behaviour of the multiphoton absorption process with the intensity: IN as observed in section 3. A consequence is that, despite the fact that the (N + 1)-photon absorption process being less likely than the N-photon absorption process at low intensities, it can be favoured when the laser intensity is high enough, accounting for the beginning of non-perturbative conditions. Moreover, one can see that transitions arise from different regions of the BZ, depending on the laser intensity. Indeed, the two-photon absorption process occurs around the centre of the BZ while the three-photon absorption process occurs near the W point. It means that the main contributions to the ionization process may occur out of the centre of the BZ. This behaviour is also noticeable for laser energies of 2.67 eV, with the competition of the three and four photons, and for a laser energy of 2 eV which gives birth to five and six photons.
In this second part, the multiphotonic absorption process in a KDP crystal is studied and compared with results obtained in NaCl. As previously, the electronic properties are obtained from ab initio calculations with the ABINIT code. As for NaCl, and for the sake of comparison, the scissor operator is utilized to increase the KDP bandgap to 8 eV. The calculations have been performed using the projector augmented wave method [34, 45]. Further, we have used the generalized gradient approximation for the exchange–correlation energy functional [33]. The KDP crystal is studied within its tetragonal structure (space group  ). This structure is the one of the paraelectric, i.e. high-temperature, phase of KDP. It has been computed using a primitive unit cell containing 2 KH2PO4 units, i.e. 16 atoms. The plane wave cutoff is here set to 1088 eV. The phosphorus electrons 3s, 3p, the potassium electrons 3s, 3p, 4s, and the oxygen electrons 2s and 2p are treated as valence electrons. Integration over the BZ is achieved by using a 10×10×10 reciprocal grid (165
  -points in the irreducible BZ), and leads after geometric optimization to lattice constants of a = b = 7.58 Å and c = 7.09 Å, a + 1.7% overestimation of the experimental values at T = 26 ° C [44] typical of the GGA.
First, the electronic density has been studied as a function of the photon energy for a laser intensity of 0.1 TW cm−2. Results are shown in figure 10 for NaCl and KDP.

Figure 10. Laser-induced electronic density in the conduction band as a function of photon energy for I = 0.1 TW cm−2. Only two states (the top of the valence band and the bottom of the conduction band) are considered for each material: NaCl (black solid line) and KDP (red dashed line).
Download figure:
Standard image High-resolution imageResults show that after integration over the BZ, the electronic densities of NaCl and KDP follow the same qualitative trends. In both cases, the one-photon and two-photon absorption processes are easy to identify. However, for identical irradiation conditions, the quantitative results are quite different. First, the electron production in NaCl is efficient on a wider range of photon energy. Then, the electronic density in the conduction band is greater in NaCl than in KDP. These differences come from the fact that these materials have different electronic structures, as shown in figure 11. This result shows that significant transitions occur outside the centre of the BZ, strengthening the fact that further information than the bandgap value is required to correctly evaluate the ionization rate.

Figure 11. Bandstructure for NaCl (on the left) and KDP (on the right) along high-symmetry lines of the first Brillouin zone.
Download figure:
Standard image High-resolution imageConsidering the BZ associated to primitive unit cells, the band structure of NaCl exhibits fewer electronic states because its unit cell is less complex than that of KDP. However, these states are spread over a wider range of energies, from 8 to 30 eV (for 13 conduction states). Unlike NaCl, the first 15 conduction states of KDP are compacted from 8 to 15 eV. A dispersed bandstructure makes high multiphotonic order processes reached more easily than in compact bandstructures. This is why the amplitude of the two-photon absorption process in NaCl is several orders of magnitude greater than the one in KDP, as shown in figure 12, where the electronic density is calculated as a function of the wavevector for I = 100 TW cm−2 and ħω = 4.2 eV. When all multiphotonic orders are considered (solid black line), the discrimination between the two- and three-photon processes is difficult to make. This is why these two contributions have been separated, showing a predominance of the two-photon absorption process in both cases.

Figure 12. Laser-induced electronic density in the conduction band of NaCl (a) and KDP (b) as a function of wavevector for I = 100 TW cm−2 and ħω = 4.2 eV. All multiphotonic orders are included (black solid line), then various MPA contributions are extracted: two-photon process (red dashed line) and three-photon process (green dotted line).
Download figure:
Standard image High-resolution image
Even if the ionization rates are calculated over different paths of the BZ, it can be assumed that the ionization rates obtained from NaCl and KDP are quite different, despite the fact that their bandgap values are identical. This result strengthens the fact that a material cannot be described just by the value of its bandgap and by simple electronic structures if multiphotonic processes generated by elevated intensities are considered, inducing significant transitions far from the centre of the BZ where the parabolic band approximation is no longer valid.
5. Conclusion and outlooks
We have presented a semi-analytical model aiming to estimate accurately the density of free electrons generated by a multiphotonic ionization process in wide bandgap dielectric materials for moderate laser intensities. This model provides an analytical description of the ionization mechanisms through the Bloch–Volkov formalism, fed with electronic structures evaluated through ab initio calculations. Electronic properties of the materials are generated here within a first-principles approach using the ABINIT code. Thereby, this method allows one to deal with any material as long as ab initio calculations may be performed. In order to validate our approach and to make our results easy to analyse, we have performed preliminary studies within the parabolic band approximation. Results obtained from a revisited model have shown that the electronic density strongly depends on the band structure shape. Moreover, it appears that significant transitions may occur out of the centre of the Brillouin zone, depending on the laser intensity. The model has then been utilized with two materials of interest: NaCl and KDP, whose band structures have been obtained through ab initio calculations. Results confirm the previous trends observed within the parabolic approximation, namely the emergence of significant transitions out of the Brillouin zone which contribute significantly to ionization, where the assumption of parabolic band structure is in general no longer valid. Contrary to the revisited model, the ionization rate exhibits significant variations with respect to the photon energy or the electron momentum in the Brillouin zone, in particular some irregularities appear due to the presence of several valence and conduction bands of several forms.
The present approach provides a new baseline for modelling multiphoton absorption in real dielectric materials. The present work has demonstrated its reliability. It is expected to provide quantitative estimates of the laser-induced density in the conduction band up to intensities of the order of tens of TW cm−2, depending on the laser wavelength. Note that the shorter the wavelength, the larger the domain of validity with respect to the intensity. Only physical trends can be predicted for higher intensities due to the possible influence of laser-induced band structure modifications or ponderomotive energy. A further improvement of this model would consist in taking into account possible resonant intermediate states within the Bloch–Volkov formalism. Doing so, a significant increase of the electronic density is expected. Furthermore, a way to confront our model with experimental results [46, 37] will be to study the influence of the laser polarization on the ionization rate.
Acknowledgments
Candice Mézel acknowledges the Commissariat à l'Energie Atomique (CEA) for providing a post-doctoral grant. Robert Gayet, Henri Bachau, and Sophie Jequier are gratefully acknowledged for fruitful discussions.
Appendix A.: Derivation of the transition amplitude of the BV-DFT model
The semi-analytical expression for the amplitude transition reads:
One can identify the terms corresponding to the emission of (n + m + p + 1) photons:
and the terms corresponding to the absorption of (1–n–m–p) photons:
The energy difference between a valence band and a conduction band  depends on the electron wavevector. The terms
  appearing in the above expressions account for the finite duration of the pulse. They are responsible for spectral broadening of the transitions.
Appendix B.: Parabolic model: behaviour of the ionization probability as a function of ω
The time-dependent transition amplitude between an initial state |φv〉 and a final state |φc〉 reads:
In order to make this expression easy to solve analytically, the Volkov phase  has been developed into Bessel functions Jn(x):
Assuming a vector potential of the form  leads to the expression:
As the aim of this study is to get the evolution of the electronic density as a function of the energy, one can assume a simple evolution in time by supposing infinite pulse duration. The integration over the time thus leads to a Dirac function:
From this expression of the transition amplitude, the ionization probability  can be derived:
By considering a p photon transition, with n = p − 1, the ionization probability becomes
Near the centre of the Brillouin zone, the matrix element is considered as linear with the wavevector k:  . Moreover, for small values of k, the Bessel functions are assumed to be linear with their arguments:
  . At this stage, the ionization probability reads:
The energy difference between two bands of the band structure has the form  in the parabolic band approach, with Eg the band gap energy. Hence, the integration over the wavevector can be transformed into an integration over the energy and we obtain:
For a transition involving one photon, for instance, the probability thus reads  .
.