Abstract
Segregation and precipitation of second phases in metals and metallic alloys is an important phenomenon that has a strong influence on the mechanical properties of the material. Models exist that describe the growth of coherent, semi-coherent and incoherent precipitates. One important parameter of these models is the energy of the interface between matrix and precipitate. In this work we apply ab initio density functional theory calculations to obtain this parameter and to understand how it depends on chemical composition and mechanical strain at the interface.
Our example is a metastable Mo–C phase, the body-centred tetragonal structure, which exists as a semi-coherent precipitate in body-centred cubic molybdenum. The interface of this precipitate is supposed to change from coherent to semi-coherent during the growth of the precipitate. We predict the critical thickness of the precipitate by calculating the different contributions to a semi-coherent interface energy by means of ab initio density functional theory calculations. The parameters in our model include the elastic strain energy stored in the precipitate, as well as a misfit dislocation energy that depends on the dislocation core width and the dislocation spacing. Our predicted critical thickness agrees well with experimental observations.
Export citation and abstract BibTeX RIS

Content from this work may be used under the terms of the Creative Commons Attribution 3.0 licence. Any further distribution of this work must maintain attribution to the author(s) and the title of the work, journal citation and DOI.
1. Introduction
At high impurity concentrations and/or low solubilities in metals, precipitation and phase transformation are observed. Precipitation of second phases in metals and metallic alloys is an important phenomenon that has a strong influence on the mechanical properties of the material. Insight into this precipitation behaviour during heat treatment paves the way for the improvement of existing steel grades and other alloys.
Strengthening of metals by precipitates occurs due to the mismatch of modulus, lattice parameter, γ-surface and slip-plane between adjacent layers [1]. The modulus mismatch (the Koehler barrier), for instance, introduces a force between a dislocation and its image in the interface. The lattice mismatch gives rise to oscillating coherency stresses and van der Merwe misfit dislocations [2–4] at or near the interfaces, which interact with mobile dislocations. The γ-surface (chemical) mismatch introduces a localized force on gliding dislocations that is due to core energy changes at or near the interfaces.
In the study at hand, we have a closer look at the effect of the lattice parameter mismatch on the interface structure. This mismatch results in a misfit strain, i.e. the strain required to keep the phases coherent with respect to one another [5]. Depending on the absolute value of this strain the precipitation growth can be coherent, semi-coherent or incoherent with the original matrix of the metal, as well as exhibit transitions between these three regimes. For modelling of the microstructure evolution or growth kinetics, the size of the precipitate (critical size) before the interface undergoes such a transition from a coherent to a semi-coherent state is required. For a review of atomistic modelling approaches of interfaces and microstructure evolution see [6]. In this paper we use an interface model that is fully based on the results of ab initio density functional theory calculations, to predict the above-mentioned transition. The challenge is to have a realistic description of a semi-coherent interface, which is usually out of the scope of ab initio calculations.
1.1. Previous studies of the MoCx precipitate
The main focus in this work is on body-centred cubic (bcc) molybdenum, as it has very interesting high-temperature applications. However, its practical application is severely hindered due to a strong grain boundary embrittlement. This could be partially compensated by the inclusion of carbon, which has a beneficial effect of strengthening [7–12] the metal. Detailed experimental [13–15] and theoretical studies [16–19] have been carried out on the Σ5 symmetrical tilt grain boundary (STGB) in pure Mo. In a previous computational study [20], also the precipitation behaviour of the body-centred tetragonal (bct) carbide, MoCx, at a grain boundary has been investigated. This study showed that there is a significant strain contribution to the interface energy due to the lattice misfit. In the present work, this contribution is quantified by means of ab initio density functional theory (DFT) calculations [21, 22] using the Vienna ab initio simulations package (VASP) [23, 24]. The predictions for a precipitate of MoCx in Mo are then compared with high-resolution transmission electron microscopic (HRTEM) observations of carbides in molybdenum [13].
The HRTEM study [13] of the Σ5 STGB before and after the carburization treatment under certain conditions of temperature and pressure shows two different morphologies of carbides at the grain boundary: isolated particles of hexagonal Mo2C or very thin and continuous layers (1 nm thickness) of a more or less deformed tetragonal structure of MoCx. From the measured lattice constants of a = 0.305 nm and c = 0.406 nm, the carbon content x in MoCx was determined as 0.4. The orientation relationship between the carbide MoCx and Mo at the Σ5 STGB is given by [001]Mo || [010]MoCx, and (310)Mo || (103)MoCx. This bct phase is not present in the phase diagram of stable phases. It is assumed that this metastable phase is stabilized by the precipitate interface with the matrix. The lattice parameter mismatch between the tetragonal MoCx and the bcc Mo matrix gives rise to a coherency strain at the boundary, and finally to a semi-coherent interface [13]. This transition from a coherent to a semi-coherent interface is analysed by means of ab initio calculations in the present work.
1.2. Modelling of semi-coherent interfaces
The modelling of semi-coherent interfaces between a substrate and a film or between a matrix and a precipitate entails hundreds of atoms, which is large for DFT. It is feasible using classical potentials or force-field methods (e.g. [25]), but more often the expressions of continuum elastic theory (CET) are combined with the results of ab initio calculations for quantitative predictions. The application of elasticity theory itself to realistic microstructures is limited, as it cannot deal with large atomic displacements from ideal lattice sites (as in dislocation cores) or deviations from stoichiometry. These limitations can be overcome by the combination with ab initio calculations. Initially first-principles studies were restricted to coherent interfaces, neglecting misfit in the system. A wide variety of literature is available for coherent interface calculations, whereas for semi-coherent interfaces it is rather limited. In the following we only discuss approaches that model semi-coherent interfaces.
The general strategy is to start with a coherent or pseudomorphic interface, the energy of which can be determined by ab initio calculations using a periodic supercell. The contribution of the elastic energy in the thin film/precipitate to the total energy is then calculated from CET. Thus, also the chemical or cohesive contribution to the interface energy can be derived [26, 27]. The homogeneous strain energy depends on the dislocation density, because the presence of dislocations will partially release the misfit strain. This is indeed taken into account in [28, 29]. The energy due to the presence of misfit dislocations can be determined by considering shifted configurations of the same supercell [26, 28] comparable to points on the γ-surface [30], which corresponds to an approximate, implicit treatment of a dislocation core and line energy, as well as elastic and plastic effects. Alternatively, explicit analytic CET expressions for the dislocation line energy [25, 27, 31, 29] can be used. In [29], the latter approach is extended by a plastic deformation energy contribution via an evaluation of the γ-surface, while in [27] it is refined by including the dislocation–dislocation interaction energy. The dislocation core energy as an independent quantity can only be derived if misfit dislocations are actually present in the supercell, as done e.g. in a study employing valence-force-field simulations [25], where the dislocation core energy is a fitting parameter. The homogeneous strain energy depends on the thickness of the film/precipitate, which allows the derivation of a critical thickness at which a coherent interface will become semi-coherent [25, 29].
In our work we start from the 'square lattice model' [32], which has been used for semi-coherent interfaces in ceramics to estimate the effect of misfit dislocations on the work of separation, but we apply it to the interface energy itself. The semi-coherent interface with an arbitrary misfit is described as a combination of areas of coherent interface which mimic the local atomistic structure in the coherent regions as well as at the dislocation cores. This method is related to the shifted-supercell based approaches [26, 27], and, as we will show below, provides a simple way to vary both dislocation spacing and dislocation core width. To our knowledge, the influence of the latter has not been investigated so far.
2. Computational details
The coherent interface energy for two phases is calculated in an ab initio supercell approach as

where Etot is the total energy of the interface supercell, Esc the energy of the fully relaxed single-crystal reference phases, and 2A the interface area (the factor 2 arises due to the periodic boundary conditions). The coherency strain,  is given by
where a0 is the reference lattice constant of the respective phase, and a the lattice parameter of the strained phase.
We resolve the total energy, Etot, to quantify the contributions of strain inside the precipitate and the chemical bonds across the interface to the precipitate energy, and define

where Estrain is the elastic energy stored in a strained crystal, and Echem the chemical contribution to the interface energy. Equation (3) can be expanded to

 and
and  are the energies of the relaxed single crystal per formula unit of Mo and MoCx, and
  and
and  are the strain contributions to the system matrix–precipitate for n Mo and m MoCx layers respectively.
  ,
,  ,
,  , and
, and  are determined from strained and unstrained calculations of the corresponding single crystals. Then, the contribution of the interfacial bonds, γchem, can be obtained from

In our supercell calculation, we use m = 4, n = 6, see section 3.2.1. Note that with this decomposition of the total energy of the interface supercell, equation (3), the coherent interface energy, equation (1), becomes γcoh = γstrain + γchem.
The work of separation, Wsep, is the energy needed to separate the (coherent) interface into two free surfaces. It is calculated from

where EFS is the surface energy.
The semi-coherent interface energy in our approach is defined as follows:

γmisfit is the energy due to the presence of a misfit dislocation. It is obtained from the square lattice model [32], which is constructed by considering the number of unit cells of Mo and MoCx that could be matched to each other (see section 3.2.4). In this model the local atomic structure in different regions of the semi-coherent interface is represented by different coherent supercells with a relative shift. The presence of misfit dislocations reduces the coherent area of the interface, thus the strain contribution, γstrain in equation (5), is reduced to  in equation (8).
Besides the contribution due to misfit, this model contains also the elastic strain energy due to the coherent region. The relative weight of the respective terms is influenced by the dislocation spacing and the core width of the dislocation, as explained in section 3.2.5.
In the present work, the calculations are performed within the framework of ab initio DFT using the generalized gradient approximation (GGA) [33, 34] for the exchange–correlation effects, and ultrasoft pseudopotentials (USPP) [35, 36] for the core–valence interactions.
For the single-crystal study in this work, a 2 × 2 × 2 supercell of bcc Mo and tetragonal MoCx is used. x is chosen to be either 1/3 or 1/17. The interface supercell for Mo || Mo2C with n = 6 layers of Mo and m = 4 layers of Mo2C is constructed by straining the two phases along [100] and [010] into a common lattice parameter, as explained in section 3.1. Convergence tests have been performed for the cut-off energy to represent the electron wave function in the plane-wave basis set, and the k-point sampling using a Monkhorst–Pack grid [37] for the integration over the Brillouin zone. The energy cut-off obtained from these convergence tests is 350 eV. For the single-crystal supercell 8 × 8 × 8 k-points are used, in the case of the interface supercell 12 × 12 × 2. With these parameters, the total energy is converged within less than 1 × 10⁻² eV, which leads to an accuracy within several mJ m−2 for the interface calculation.
3. Results and discussion
3.1. Single-crystal studies
Carbon atoms are added to the original matrix of molybdenum at octahedral interstitial sites, as it is observed experimentally that carbon atoms segregate to the Σ5 STGB through the octahedral sites [13]. The carbon atoms cause a tetragonal distortion in the bcc Mo structure. By increasing the carbon concentration, finally a phase transition occurs from bcc via body-centred tetragonal (bct) to face-centred cubic (fcc). This carbide formation results in a lattice parameter mismatch between the two phases—Mo and MoCx—that in turn results in coherency strain at the Mo || MoCx interface. To quantify the elastic energy which is stored in the supercell due to this coherency strain, the cell parameter c of a formerly relaxed 2 × 2 × 2 supercell cell was optimized while keeping the cell parameter a at certain fixed values. This was done for (i) the pure molybdenum grain (Mo), originally in its bcc structure, (ii) molybdenum with a carbon content of 1/17 (Mo16C) with bct structure, and (iii) molybdenum with a carbon content of 1/3 (Mo16C8), originally having fcc structure. The energies of formation of Mo16C and Mo16C8 per formula unit have been calculated as 1.5814 eV and 0.3507 eV respectively. In comparison with the energy of formation of hexagonal Mo2C, −0.0821 eV/f.u., these structures are metastable. The lattice parameter for pure Mo is 3.152 Å, for Mo16C it is 3.147 Å and for Mo16C8 it is 2.991 Å. This leads to a lattice misfit of 0.5% between Mo and Mo16C and 16% for Mo and Mo16C8.
The elastic energy or strain energy stored in the whole system is calculated in three steps:
- By varying the lattice parameter c (along [001]) at fixed a (along [100] and [010]), the energy as a function of volume for different phases is obtained. This is shown exemplarily for pure Mo in figure 1. The different symbols in this plot represent the various fixed values of the lattice parameter a.
- From this set of curves, the energy minima and respective c values are determined for each a, as represented in figure 2.
- The energy as a function of biaxial coherency strain is obtained from figure 2 via equation (2), which is shown for all three compositions in figure 3.
Thus, from the single-crystal study, Esc and Estrain are obtained, which are used in the interface energy calculations in section 3.2.

Figure 1. Total energy of a 2 × 2 × 2 bcc Mo supercell as a function of volume (lattice parameter c) at fixed lattice parameters a (Å).
Download figure:
Standard image High-resolution image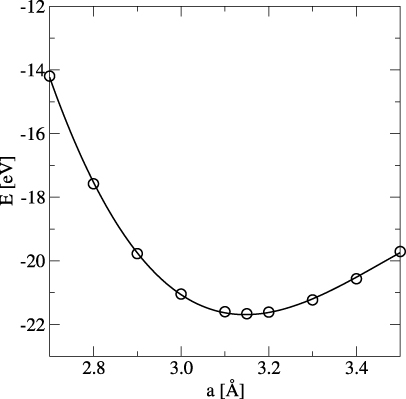
Figure 2. Total energy of a 2 × 2 × 2 Mo supercell as a function of lateral lattice parameter a.
Download figure:
Standard image High-resolution image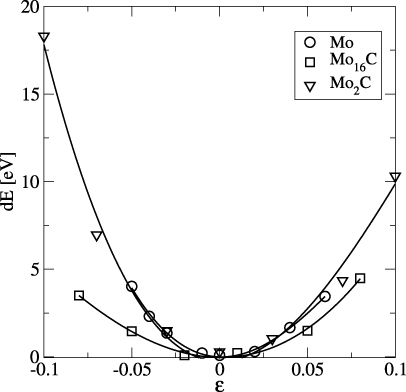
Figure 3. Energy difference between strained and unstrained supercells of Mo (open circle), Mo16C (open square), and Mo16C8 (inverted triangle) as a function of biaxial strain.
Download figure:
Standard image High-resolution image3.2. Interface study
3.2.1. Coherent interface.
The interface between Mo and MoCx (see figure 4) is constructed with the cube-on-cube orientation, Mo [001] || MoCx [001], taking into account the results of the study above. The experimentally observed orientation of the interface plane, (310), (see section 1.1) is simplified to (001) in our ab initio study. This choice reduces the computational effort significantly. It does not influence the elastic energy calculation, but might change the spacing of misfit dislocations. In our study, we treat this spacing as a free parameter. MoCx corresponds to two different stoichiometries, as mentioned in section 1.1, Mo16C and Mo16C8. As described above, Mo and MoCx, with their different lattice parameters, have to undergo biaxial strain along [100] and [010] in the construction of the coherent interface supercell. The dimension of the supercell may take any values between the lattice parameters of Mo as a lower limit and MoCx as a higher limit. In our study, we chose three values for the dimension of the supercell along [100] and [010]: (i) a supercell with the lattice constant of Mo, (ii) a supercell with the lattice constant being an average value of Mo and MoCx, and (iii) a supercell with the lattice constant of MoCx. These dimensions are expected to represent the growth condition of the precipitate for a thin, medium and thick carbide layer, respectively. The translational degrees of freedom are determined by performing rigid grain shifts perpendicular and parallel to the interface plane and subsequently relaxing the atomic positions. As an example, the energy for expansion is shown in figure 5 for the interface between Mo and Mo16C8. The expansion for Mo [001] || Mo16C8 [001] is −0.4451 Å.

Figure 4. Atomistic supercell of the interface between [001] Mo and [001] Mo2C with six Mo and four Mo2C units.
Download figure:
Standard image High-resolution image
Figure 5. Total energy of the Mo–Mo16C8 interface supercell as a function of expansion along the [001] direction; lattice parameter along [100] fixed to the value of aMo, 3.1520 Å.
Download figure:
Standard image High-resolution imageAfter optimizing the expansion perpendicular to the interface, the γ-surface [30] is calculated by shifting the grains rigidly parallel to the interface plane and subsequently relaxing the atomic positions perpendicular to the plane. This γ-surface is created for the three [100]-lattice parameters aMo, aavg and aMo16C8. The γ-surface thus obtained is represented in figure 6 for the interface with aMo. In this 2D potential energy surface, the coloured regions represent energies for various shifts along the interface. On the one hand it shows the stable translation state for the fully coherent interface, which is zero. On the other hand it can be used to identify possible Burgers vectors of misfit dislocations and the corresponding energies. This information will be used later in the approximation of the semi-coherent interface energy. The dark blue-coloured region at the origin represents the 'on-top' position of the interface, which can also be considered as the energy of the coherent interface. The energy maximum is represented by the red-coloured region at a relative shift of (0.5a, 0.5a) of the carbide grain with respect to the Mo grain parallel to the interface plane. From this plot we can also obtain the Burgers vector of possible misfit dislocations, ![$\vec{b}=1/2[1 0 0]$](https://content.cld.iop.org/journals/0953-8984/25/35/355005/revision1/cm471426ieqn194.gif) or
or ![$\vec{b}=1/2[0 1 0]$](https://content.cld.iop.org/journals/0953-8984/25/35/355005/revision1/cm471426ieqn195.gif) . Such a local shift would produce a stacking fault with 0.234 J m−2.
. Such a local shift would produce a stacking fault with 0.234 J m−2.

Figure 6. γ-surface of the Mo–Mo16C8 interface. The extension in [100] and [010] is one unit cell. Energy levels are given in (J m−2). The dark blue-coloured region represents the 'on-top' position of the interface, corresponding to the coherent interface. The red-coloured region refers to the maximum energy in an interface containing misfit dislocations. Other colours represent the intermediate shifts of Mo and Mo2C along the interface.
Download figure:
Standard image High-resolution image3.2.2. Calculation of the interface energy and work of separation.
For the three lattice constants (i)–(iii) considered for the interface construction, we calculated the interface energy, γ' and the work of separation, Wsep. The results are listed for Mo [001] || Mo16C8 [001] in table 1. From the result in table 1, it can be concluded that the interface with the average lattice constant has the highest Wsep and lowest γ, suggesting that the precipitate favours growth with a lateral lattice constant of 3.0712 Å. However, from equation (3), we know that γ is size dependent, because the strain energy stored in the system depends on the respective slab thickness. This thickness dependence is studied by varying the carbide thickness along [001] by increasing the value of m in (3) in section 3.2.3.
Table 1. Wsep, coherent interface energy, strain contribution and chemical contribution to the interface energy for Mo || Mo16C8 with n = 6 and m = 4 in equation (5).
| Lattice constant (Å) | Wsep (J m−2) | γcoh (J m−2) | γstrain (J m−2) | γchem (J m−2) |
|---|---|---|---|---|
| 3.1520 (Mo) | 3.274 | 1.130 | 1.974 | −0.845 |
| 3.0712 (avg) | 4.424 | 0.544 | 0.694 | −0.149 |
| 2.9907 (Mo2C) | 4.063 | 0.828 | 0.856 | −0.027 |
3.2.3. Variation of γ with the carbide thickness.
The three linear curves in figure 7 represent three different supercells with corresponding lateral lattice constants, as mentioned in table 1. The offsets of the graphs on the y-axis are the chemical contribution, γchem. The dotted lines refer to the interpolation of the strain contribution along with the chemical part to the interface energy due to the addition of carbide layers to the molybdenum substrate. Starting from γchem, the graphs for the average and the carbide lattice constants exhibit a discontinuity as the first carbide layer is added, since with this layer also a strain in the Mo substrate is introduced. After the first layer, the energy increases continuously according to equation (5). From this plot, the precipitation growth could be predicted to occur under three regimes. Initially, the carbide prefers to grow with a lattice constant of aMo (blue line (1)), after which it starts to grow with a lattice constant of aavg (green line (2)) and then with a value of aMo2C (purple line (3)). From these three discrete regimes, an interpolation is made that is represented by the thick asymptotic curve (black) in figure 7. This interpolated curve is constructed by considering the four interpolation points in figure 7. It represents the interface energy as a function of carbide thickness, assuming that the lattice constants at the interface would vary continuously between aMo and aMo2C.
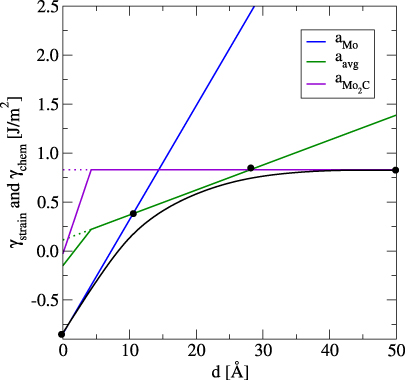
Figure 7. Interface energy (strain, γstrain, and chemical, γchem, part of interface energy) as function of carbide thickness for n = 6 Mo and m = 4 Mo2C units. The three curves represent three different supercells with corresponding lattice constants, as mentioned in table 1. The black line is the interpolation between the three discrete regimes marked by the four interpolation points. The offsets of the graphs on the y-axis are the values of γchem. The dotted lines are the interpolation of γstrain along with the chemical part to γ' due to the addition of carbide layers to the molybdenum substrate.
Download figure:
Standard image High-resolution imageInitially, the same procedure as for the Mo || Mo2C was carried out for the Mo || Mo16C interface. However, due to the low C concentration, there is only a 0.5% lattice misfit between Mo16C and the Mo matrix and the influence of the coherency strain is negligible. Thus, for the further calculation of the critical thickness of the precipitate, only the interface Mo || Mo2C is considered. In the following, the alternative of forming a semi-coherent interface to release some of the strain stored in different grains is examined.
3.2.4. Semi-coherent interface.
The elastic energy plays a negligible role if both the matrix and precipitate have the same lattice parameters. If there is a difference between them, there will always be slight elastic distortions. If the difference in lattice parameter is too large, then edge dislocations in the interface can compensate the elastic distortions, forming a semi-coherent interface [38]. From the experimental observation [13], the distribution of such dislocation is found to be periodic with a spacing of 7 nm.
As DFT is limited to systems with only a few hundred atoms, hybrid approaches have been employed for the modelling of the semi-coherent or incoherent interfaces by combining first-principles supercells with continuum elasticity models [26, 31], as explained in section 1.2. In the study at hand, the semi-coherent interface is modelled with the help of the square lattice model [32]. The square lattice model (figure 8) is constructed by considering 35 unit cells of Mo2C that match with 34 unit cells of Mo, and the semi-coherent interface is approximated by an array of 35 × 35 coherent interface cells with different relative shifts of the two grains (this corresponds to an equilibrium spacing of misfit dislocations of roughly 10 nm).

Figure 8. Square lattice model consisting of 35 × 35 interface cells. The different regions are: (a) the coherent region; (b)–(d) the transition between the coherent region and the dislocation core; (e) the centre of the dislocation core; (f) the point of intersection of two dislocations; (g)–(i) intersections of transition regions.
Download figure:
Standard image High-resolution imageA schematic picture is shown in figure 8, where the different regions are: (a), the coherent region; (b)–(d), the transition between the coherent region and the dislocation core; (e), the centre of the dislocation core; (f) the point of intersection of two dislocations; (g)–(i) intersections of the transition regions. The width of the dislocation core is fixed and the corresponding shifts in regions (b)–(i) are chosen by assuming a distribution of shifts between zero in region (a) and 0.5a along either [100] or [010] in region (e), respectively 0.5a along [110] in region (f). The energy of the (strained) coherent interface is taken as a reference, so the energy in region (a) is zero. The energies of regions (b)–(i) are read from the γ-surface and are listed in table 2. Note that the choice of the dislocation core width in this model is flexible, and in fact we use four different widths to investigate the influence of the core width on the interface energy. Furthermore, also the dislocation spacing is not a fixed value, and besides the equilibrium spacing we also calculate the energy for minimum and maximum dislocation spacings.
Table 2. Energies for different regions in the square lattice model (figure 8) read from the γ-surface for the three different lateral lattice constants along with the corresponding position on the γ-surface.
| Region | Energy (J m−2) | Position on γ-surface | ||
|---|---|---|---|---|
| aMo | aavg | aMo2C | ||
| a | 0.000 | 0.000 | 0.000 | 0.00 [100] |
| b | 21.195 | 19.386 | 13.662 | 0.10 [100] |
| c | 68.021 | 62.645 | 40.544 | 0.25 [100] |
| d | 50.201 | 43.992 | 20.778 | 0.40 [100] |
| e | 16.548 | 12.960 | 0.000 | 0.50 [100] |
| f | 3.137 | 3.472 | 2.900 | 0.50 [110] |
| g | 12.016 | 11.750 | 9.851 | 0.40 [110] |
| h | 5.178 | 5.190 | 4.256 | 0.25 [110] |
| i | 1.240 | 1.194 | 0.894 | 0.10 [110] |
From the energy values in table 2 we can calculate the total energy of the 35 × 35 lattice to obtain the misfit contribution to the interface energy, γmisfit. This estimation is done for all three lattice constants, and for four different approximations of the dislocation core width. The results are shown in table 3.
Table 3. The misfit (γmisfit) and semi-coherent energies (γsemi) derived for n = 6 and m = 4 in equation (5) for three lattice constants. Also γmisfit and γsemi are given for various dislocation core widths (w), i.e. the width of the coloured region (w = 7, 5, 3, 1 unit cells) in figure 8. The widths correspond to 64%, 73%, 84%, 94% coherent regions under strain.
| Cases | γmisfit (J m−2) | γsemi (J m−2) | ||||||
|---|---|---|---|---|---|---|---|---|
| w = 7 | w = 5 | w = 3 | w = 1 | w = 7 | w = 5 | w = 3 | w = 1 | |
| aMo | 0.145 | 0.127 | 0.067 | 0.016 | 0.564 | 0.720 | 0.881 | 1.028 |
| aavg | 0.131 | 0.111 | 0.059 | 0.013 | 0.426 | 0.469 | 0.493 | 0.517 |
| aMo2C | 0.075 | 0.061 | 0.027 | 0.002 | 0.596 | 0.659 | 0.719 | 0.805 |
γmisfit is the difference in energy between coherent and semi-coherent interface energies. Having this misfit energy, together with the other energy terms in equation (8), gives the semi-coherent interface energy. With a dislocation at the interface, the carbide grain is still not free of strain. In figure 8, in region (a), two lattices with different lattice constants are still forced together to be coherent. So, strain remains here and increases with the thickness of the carbide. In the coloured regions of figure 8, which represent the dislocation core, the strain is assumed to be fully released. By varying this coloured region's width, i.e., as the width of the dislocation core gets broader or more narrow, the coherency strain in the system changes as well. γsemi has been calculated for different widths of the dislocation core (w) in the square lattice (figure 8), as listed in table 3. Besides the dislocation core width also the dislocation spacing can be varied. This is done by keeping the number of dislocations constant and varying the size of the supercell for the square lattice model. To get an estimate of the energy range for this variation we have chosen the broadest (w = 7) and most narrow (w = 1) core width and dislocation spacings ranging from 10.99 nm to 3.45 nm. The interpolation of the obtained values is shown in figure 9. It can be seen that the dislocation spacing changes γmisfit by 140 to 430 mJ m−2, depending on the core width. For the narrow core, the change with dislocation spacing is negligible compared to the broad core. The equilibrium dislocation spacing calculated from the DFT lattice constants is 10.99 nm, while the experimental observations [13] show a 1 nm precipitate of MoCx at a grain boundary in Mo with misfit dislocations at a regular distance of 7 nm represented by the marked line (ρ12) in figure 9.
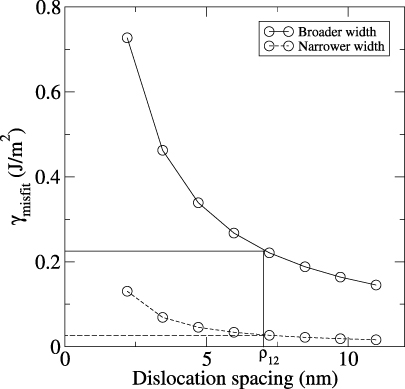
Figure 9. Misfit energy as function of dislocation spacing for a narrow (dashed line) and a broad (solid line) dislocation core width (i.e., w = 1 and 7 in figure 8). The equilibrium dislocation spacing calculated from the DFT lattice misfit is 10.99 nm, whereas the experimental value is 7 nm, represented by the marked line (ρ12).
Download figure:
Standard image High-resolution image3.2.5. Critical thickness of the precipitate.
γmisfit was calculated for a core width of seven unit cells and the equilibrium spacing of 10.99 nm for the following estimation. From the energy difference between a coherent and a semi-coherent interface as a function of carbide thickness, the critical thickness of the precipitate can be determined from figure 10.

Figure 10. Interface energy (γcoh and γsemi) as functions of carbide thickness. Solid lines correspond to the coherent interface and dotted lines represent the semi-coherent interface. The three linear curves represent three different supercells with corresponding lattice constants, as mentioned in table 1. The growth of the precipitate can be predicted by the interpolated asymptotic curves. The cross-over of the solid and dashed asymptotic curves give the critical thickness of the precipitate (3.5 Å).
Download figure:
Standard image High-resolution imageThe dotted lines in figure 10 correspond to the variation of the semi-coherent interface energy with the variation of the carbide thickness for the three different lattice constants. The energies for the coherent interface are represented as solid lines. The interpolation of both coherent and semi-coherent growth for any lattice parameter value between aMo and aMoCx shows an asymptotic behaviour. The intersection of the interpolated curves marks the point until which the precipitate grows coherently. In this case the prediction is that already above the first carbide layer it will form misfit dislocations and grow semi-coherently. To know how the dislocation core width influences the critical thickness of the precipitate, it has been derived for the two limiting cases of core widths w = 1 (figure 11) and w = 7 (figure 12). The blue line corresponds to the coherent and the other coloured lines represent the semi-coherent interface energies for various dislocation spacing as a function of carbide thickness. The green line represents the semi-coherent interface energy with the equilibrium spacing, whereas the purple line represents the minimum dislocation spacing in the square lattice model. The black dotted line represents the dislocation spacing closest to the experimental value [13] of 7.22 nm. The semi-coherent energies for different dislocation spacings have an influence on the critical thickness of the precipitate: in figure 11 the cross-over point, i.e. the critical thickness, ranges from 2.5 Å (for the cross-over of coherent and semi-coherent interface energy with equilibrium spacing) to 7.5 Å (for the cross-over of coherent and semi-coherent interface energy with minimum dislocation spacing). Similarly, from figure 12, the critical thickness ranges from 3.5 Å to 4.5 Å. It can be concluded from figures 11 and 12 that the dislocation core width and dislocation spacing can change the critical thickness of the precipitate between 2.5 Å to 7.5 Å, i.e. between zero and two layers of carbide. The effect of dislocation spacing is more pronounced the narrower the core is. Note that, as mentioned above, the interfacial plane considered for the calculation is the (001) plane while the one observed experimentally is the (310) plane. This choice does not influence the elastic energy calculation, but might change the spacing of misfit dislocations. In our study, we treat this spacing as a free parameter, but the influence of the plane index on γchem should be investigated further. Nevertheless, the cross-over point for the experimental dislocation spacing is 3.5 Å for the broad and 2.5 Å for the narrow core, and lies in the predicted range, which shows that our model provides a good approximation of the semi-coherent interface energy.

Figure 11. Interface energies assuming a narrow core width (w = 1) and aMo. The blue line corresponds to the coherent and the other coloured lines represent the semi-coherent interface energies (for various dislocation spacings), whereas the black dotted line represents the experimental value [13] for the dislocation spacing. The critical thickness ranges from 2.5 to 7.5 Å.
Download figure:
Standard image High-resolution image
Figure 12. Interface energies assuming a broad dislocation core width (w = 7) and aMo. The blue line corresponds to the coherent and the other coloured lines represent the semi-coherent interface energies (for various dislocation spacings), whereas the black dotted line represents the experimental value [13] for the dislocation spacing. The critical thickness ranges from 3.5 to 4.5 Å.
Download figure:
Standard image High-resolution image
We note that so far we have neglected the effect of temperature in our 0 K calculations. To get an idea of the effect of temperature on the critical thickness of the precipitate we have extrapolated the strain due to lattice misfit to various temperatures using the thermal expansion coefficients available in the literature [39, 40]. We observed that with increasing temperature the lattice mismatch decreases, resulting in a decrease of the strain energy. With this simple extrapolation and assuming the chemical energy to be constant, the predicted critical thickness of the precipitate at a carburization temperature around 2000 K [13] is roughly 10 Å, i.e. two to three carbide layers. This value is still in agreement with the experimental observation. Nevertheless, a future extension of our model to include different temperature effects is desirable.
4. Summary and conclusion
In this study we set up a model to predict the transition between a coherent and a semi-coherent interface during growth of a thin film or precipitate. The parameters in our model include the elastic strain energy stored in the film or precipitate as well as a misfit dislocation energy that depends on the dislocation core width and the dislocation spacing. All parameters in the model can be calculated ab initio.
The strain energy due to the lattice misfit between a MoCx precipitate and the bcc Mo matrix was calculated for single-crystal supercells. This strain energy represents an important contribution to the energy of the interface between the matrix and the coherent precipitate. Experimental studies show a presence of periodic misfit dislocations for large enough precipitates, giving rise to a semi-coherent interface. As ab initio calculations are limited with respect to the cell size, such a semi-coherent interface was approximated using the square lattice model. The energy calculated from this model is the misfit energy due to the presence of misfit dislocations at the interface. This misfit energy depends on the width of the dislocation core and the dislocation spacing. There is a competition between the strain energy of the coherent interface, which increases with the size of the precipitate, and the energy of the misfit dislocations, which reduce the strain but add their core energy to the total energy of the interface. With these contributions, the transition from a coherent to a semi-coherent interface was studied and the critical thickness of the precipitate was found to be 2.5 Å to 7.5 Å, i.e. between zero and two layers of carbide. Above that a network of misfit dislocations develops. The range of critical thickness values is in agreement with the observation of a 1 nm thick, semi-coherent precipitate with misfit dislocations at a distance of 7 nm, which shows that our model, which only relies on values that can be calculated ab initio, provides a good approximation of the semi-coherent interface energy.
The interface energies calculated here are often not accessible experimentally. They find their application as input parameters for mesoscopic simulations of the precipitate growth kinetics, e.g., using the phase field method. Furthermore these energies could serve as one of the input parameters in thermodynamic calculations to investigate the stabilization of a metastable (bct) precipitate by the surrounding matrix.
Acknowledgments
The authors thank A Hartmaier and S G Fries for fruitful discussions. SS acknowledges financial support from IMPRS-SurMat. ICAMS is supported through Thyssen Krupp AG, Bayer Material Science AG, Salzgitter Mannesmann Forschung GmbH, Robert Bosch GmbH, Benteler Stahl/Rohr GmbH, Bayer Technology Services GmbH and the state of North-Rhine Westphalia as well as the European Commission in the framework of the European Regional Development Fund (ERDF).