

Abstract
Gold and silver nanoparticles with their tunable optical and electronic properties are of great interest for a wide range of applications. Often the ligands at the surface of the nanoparticles have to be exchanged in a second step after particle formation in order to obtain a desired surface functionalization. For many techniques, this process is not accessible in situ. In this review, we present second-harmonic scattering (SHS) as an inherently surface sensitive and label-free optical technique to probe the ligand exchange at the surface of colloidal gold and silver nanoparticles in situ and in real time. First, a brief introduction to SHS and basic features of the SHS of nanoparticles are given. After that, we demonstrate how the SHS intensity decrease can be correlated to the thiol coverage which allows for the determination of the Gibbs free energy of adsorption and the surface coverage.
Export citation and abstract BibTeX RIS
1. Introduction
1.1. Ag and Au nanoparticles and the role of surface properties
Gold and silver nanoparticles (AuNP and AgNP) have attracted much interest in the last few decades due to their remarkable optical properties which depend on particle size and shape [1–4]. The applications of AuNPs range from sensors [5], nanoelectronics [6] and catalysis [7, 8] to medical diagnostics [9]. AgNPs with their antimicrobial properties [10, 11] can be found in biomedical applications [12, 13], clothing [14], fabrics [15] and cosmetics [16] but they are also used as catalysts [17, 18] or sensors [19, 20]. Traditionally, metal nanoparticles are synthesized by the reduction of metal salts and are stabilized in the presence of stabilizing agents, while in the last decade also new strategies to generate metal nanoparticles directly in polymers or melts have been established [21, 22]. Laser ablation processes have shown to be highly effective and can produce pure metal or even alloyed metal nanoparticles in electrolyte solutions that are free of any ligands and possible synthesis by-products [23–25]. So far, the most prominent AuNP synthesis route is according to the protocol outlined by Turkevich [26]. In this synthesis route, citrate acts not only as the stabilizing ligand but is also the reducing agent for the Au ions in the electrolyte solution [27, 28]. More recent protocols allow precise size tuning of both AgNPs and AuNPs by a controlled seeded-growth mechanism or an adjustment of the solution pH [29, 30]. In addition, the shape of the nanoparticles can be easily changed by addition of ligands or reagents which either passivate certain crystal planes at the particle surfaces or adjust the reduction potential of the metal ions in solution [31]. In that way rods [32, 33], triangular plates [34], decahedra [35, 36], cubes [37], and even branched nanocrystals [38] have been synthesized. Besides changing the synthesis condition also post-processing of the shape of the metal nanoparticles is possible [39, 40], while Au nanoshells [41, 42] and Ag or Au patches [43, 44] can be grown on silica core particles.
As indicated above, the ligand affects the synthesis and its outcome. However, for the use of metal nanoparticles in various applications the ligand plays an even larger role as it strongly influences stability, optical and electronic properties, toxicity and attachment to desired sites. Often the surface of nanoparticles needs to be functionalized after synthesis in order to achieve the desired optical or chemical properties. Obviously, besides size and shape control of plasmonic nanoparticles, control of their surface properties becomes increasingly important. Therefore, a molecular understanding of the thermodynamics and kinetics of the ligand exchange reaction at nanoparticle surfaces is prerequisite to tailor surface properties. For that, it is necessary to follow the adsorption or the exchange of ligands at the particle surfaces in situ and in real time in order to receive a full picture of the surface molecular structure in thermal equilibrium or far outside equilibrium conditions. However, resolving the latter is still a major challenge for most experimental methods.
1.2. Measurement techniques and focus of topical review
Standard characterization methods that are often applied to study as-synthesized metal nanoparticles are UV–Vis extinction spectroscopy, SEM/TEM and dynamic light scattering (DLS), which provide already valuable information on particle size whereas analytical ultracentrifugation equipped with a multiwavelength UV–Vis detector provides sizes and shape [45] or size and optical properties [46]. Surface properties which become increasingly important particularly for very small nanoparticles can only be addressed to some extend by UV–Vis due to a weak shift in the surface plasmon resonance which is often hardly noticeable (see below). Another approach uses an ex situ TEM analysis or other less often applied surface science tools that all require vacuum and thus only allow for ex situ inspection of nanoparticle surfaces. Although many experimental techniques exist that allow for a determination of size distributions and optical properties, the surface properties of nanoparticles are in fact not as easily obtained: Often techniques rely on ex situ characterization such as x-ray photoelectron spectroscopy (XPS) [47, 48], Auger electron spectroscopy, photoemission electron microscopy (PEEM) [49, 50] and FT-IR [48] for which nanoparticles or nanostructures have to be transferred from the solvent to ambient air/gas where they are dried and subsequently transferred and examined under (ultra-)high vacuum conditions [47]. On the one hand, this procedure makes the nanoparticle surfaces vulnerable to possible phase transitions that alter the molecular structure and coverage of the ligand shell, e.g. due to desorption of ligands and/or removal of major parts of their electric double layer. On the other hand it is impossible to observe the kinetics of ligand exchange reaction since all experiments are done ex situ after thermal equilibrium has been reached. Therefore, ex situ measurements need to be carefully analyzed because the measured surface properties might not exactly reflect the properties of the nanoparticles in solution. Techniques which are able to gain in situ information of surface properties include surface-enhanced Raman spectroscopy (SERS) [51], NMR [52], electron spin resonance (ESR) spectroscopy [53], isothermal titration calorimetry ITC [54, 55] and small-angle x-ray scattering (SAXS) [56]. Also less common x-ray techniques such as x-ray absorption near edge structure (XANES) and near-edge x-ray absorption fine structure (EXAFS) are sensitive to ligand states at the particle surface [24]. Of these, NMR, ESR and SAXS also offer high time resolution which is needed to follow ligand exchange at the surface of nanoparticles or changes during particle formation [52, 53, 56, 57]. NMR and ESR, however, are typically confined to very small nanoparticles or clusters.
In this topical review second-harmonic scattering (SHS) is presented for in situ investigation of surface properties and ligand exchange reactions at the surface of colloidal gold and silver nanoparticles. Recently, several groups demonstrated the high potential of SHS to observe ligand exchange reactions in situ and in real time. SHS is highly surface sensitive and can often provide the necessary time resolution. As a label-free nonlinear optical technique, SHS does not require marker molecules or molecules with a distinct fingerprint e.g. in extinction spectra because the SHS signal originates purely from the surface. However, since often only relative changes in SHS intensities are measured, this method is limited to simple changes of surface properties such as exchange of one ligand by another ligand. The analysis of more complex systems necessarily demands the use of additional complementary techniques such as those discussed above. Since SHS on nanoparticles is not a common technique, the theoretical background and various features of the SHS intensity originating from metal nanoparticles will be discussed before the use of SHS for investigations of ligand exchange processes will be reviewed.
2. Second-harmonic light scattering (SHS) at nanoparticle surfaces
2.1. Basic concept of second-harmonic generation and its physical origin
The interaction of light with matter induces an electric polarization  which can be generally described for spatial homogeneous materials by a power series of the electric field strength of the fundamental light wave
  [58, 59]:
where  is the ith order of the materials electric susceptibility and
  the vacuum permittivity. The first-order term is attributed to linear optics and dictates all the well-known effects such as absorption, dispersion etc whereas the second term is related to second-order optical effects, for instance three-wave mixing processes such as sum-frequency generation (SFG) and second harmonic generation (SHG). In the case of low electric field strengths the higher-order terms can be neglected and the relationship between electric field and the electric polarization is strictly linear. Typically, the higher-order susceptibilities are several orders of magnitude smaller than the first-order susceptibility [58]. As a consequence, high electric field strengths are needed to observe second-order or third-order optical phenomena. These high field strengths of the fundamental waves cause an electric polarization where the bound electrons in the material are moved far outside their equilibrium positions and where the electron's potential energy becomes highly anharmonic. In the semi-classical Lorentz model of condensed matter, atoms are treated as harmonic oscillators and the harmonic potential will lead to linear optical effects only. Although the Lorentz model is a good description for most solids at low field strength, it is inadequate for high field strengths where the anharmonicity of the potential needs to be explicitly considered. Extending the Lorentz model to an anharmonic potential with the anharmonicity a one can directly show that nonlinear susceptibility for second-harmonic generation can be written in the following form [58]

Empirically Miller [60] could show that  is only weakly dependent on the material and the frequencies used in an SHG experiment. Consequently, second-order susceptibilities can be described by first-order susceptibilities as determined by linear optical methods. This is in itself no advantage for nonlinear optical spectroscopy but it shows that the same optical resonances where
  matches with the eigenfrequencies
  of the material also dominate the SHG intensity. In addition to SHG resonances at
  , a second resonance at
  can be seen in SHG spectra [61, 62].
In case of SHG and within the dipole approximation where only local contributions are considered, the second-order polarization  generated by the electric field of the fundamental wave is proportional to the square of the incoming electric field:

For centrosymmetric materials e.g. fcc metals or liquids, the second-order susceptibility does not change for inversion ( ) at the symmetry center (
 ), while both the second-order polarization (
 ) and the electric field of the fundamental wave (
 ) necessarily have to change their signs. Inserting these identities into equation (3) one obtains:

Since equations (3) and (4) must be simultaneously fulfilled for all times, it follows that the second-order electric susceptibility must vanish in the bulk of centrosymmetric materials:

Obviously, in this case the bulk does not contribute to the SHG signal due to symmetry reasons, but surfaces and interfaces necessarily break the prevailing bulk symmetry and thus give rise to new contributions to the second-order susceptibility that arise only from the interface and its molecular structure. Here, SHG [61–64] and in more general SFG [65, 66] become powerful tools to study buried surfaces and interfaces because they are highly selective to the interfacial properties while ignoring the bulk.
On the molecular scale e.g. of an isotropic liquid, one can imagine that for every molecule oriented in one direction, there is another one that is oriented in the opposite direction. The second-order polarizations induced in these molecules will be opposite in phase and thus the coherent overlap of the polarizations will cancel. In dipole approximation the signal of the centrosymmetric bulk material will be therefore zero.
The surface second-order susceptibility  depends on the number of molecules N at the interface and the spatial and temporal average of all hyperpolarizabilities β of the individual molecules:

The measured SHG intensity  can be directly related to the hyperpolarizability β:

Going from macroscopic interfaces of bulk materials to microscopic interfaces of colloidal micro- and nanoparticles it was long assumed that no SHG can be generated at particle surfaces as a spherical particle is intrinsically centrosymmetric due to its shape. In the 1990s Eisenthal et al [67] showed that a SHG signal is generated at the surface of microparticles according to the coherence length of the system. The coherence length is the inverse of the phase difference of two electric fields generated at opposite positions of the particle. If the size of the particle is much less than the coherence length, the electric field will vanish due to destructive interference.
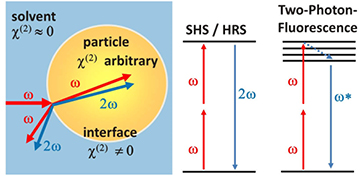
Figure 1. Principles of second-harmonic scattering (SHS) at particle surfaces as well as optical transitions in SHS and 2-photon fluorescence.
Download figure:
Standard image High-resolution imageFor spherical nanoparticles which are usually much smaller than the laser wavelength no SHG would be expected within this model. From colloidal nanoparticles, however, incoherent SHS was observed. While nanoparticles are often said to be spherical, they regularly feature deviations from a perfect sphere. As Brevet et al [68] have shown, it is exactly such deviations from a perfect spherical nanoparticle that causes incoherent SHS as the centrosymmetry of the shape of the nanoparticles is locally broken. Due to the absence of a fixed phase difference, the SHS is generated incoherently and depends linearly on the number concentration of nanoparticles in solution. For nanoparticles of shapes other than spheres such as rods, stars etc their reduced symmetry leads to an increase in SHS intensity as compared to a sphere [69]. In addition, gaps such as small cavities that are formed during the growth of Au nanoshells on a silica core or sharp tips present at the particle surface can lead to an enhancement of the local electric field and thus to a significant enhancement of the SHS intensity [41, 70].
Also in the bulk liquid, light at a frequency of 2ω is incoherently generated via hyper-Rayleigh scattering (HRS) but at comparatively low intensities. In this case the frequency-doubling is attributable to spatial and temporal molecular fluctuations which cause short-lived deviations from the centrosymmetry [71]. The measured overall electric field of the second-harmonic wave  must then be described as the sum of both the contribution of the liquid and the particle. Once the solvent's HRS signal has been subtracted the electric field
  of the scattered second-harmonic wave can be written as [63, 72–74]:

Here,  and
and  are the second- and third-order electric susceptibilities of the interface, ε0 the vacuum permittivity,
  the phase mismatch between fundamental and second harmonic waves and
  the static electric field within the electric double layer at the particle interface. For a more detailed description of charging effects and their discussion the reader is referred to the recent work by Gonella et al [74, 75] and Ohno et al [73, 76]. As a consequence of equation (8), the static electric field
  of a charged surface contributes to the overall SHS signal by a third-order process. This can be either a consequence of electronic polarization or due to a reorientation of solvent molecules within the double layer caused by the double layer's static electric field. In that way, information about the orientation of water molecules at charged particle surfaces have been obtained [63, 75]. As previously found by Kumal et al for 50 nm Au nanoparticles, the
  contribution only plays a role at very low ionic strengths of <20 µM [77].
In the following only spherical nanoparticles are considered. To our knowledge, ligand exchange at the surface of non-spherical nanoparticles has not been studied with in situ SHS yet. For non-spherical nanoparticles with distinct geometries, e.g. cubes for which adsorption can take place at face or edge sites, in situ SHS might be able to distinguish the ligand exchange at these different surface adsorption sites. For non-metallic nanoparticles the literature is also rather scarce. For semiconducting quantum dots SHS is not easily generated as these particles typically feature a strong two-photon fluorescence (2-PF) in the same spectral region where the SHS signal usually occurs. Moreover, as these material systems (CdS, CdSe, ZnO etc) are often noncentrosymmetric, SHS is not only generated at the surface of the particles but also in the particle volume. However, Banin et al were able to show that for CdSe nanoparticles the ligand at the particle surface alters the SHS intensity [78, 79].
2.2. Experimental approaches to SHS
Typically, laser used for SHS and HRS spectroscopy are based on a mode-locked Ti:Sapphire oscillator which delivers laser pulses of ~800 nm wavelength and ~70–150 fs pulse durations at repetition rates of ~70–80 MHz [80, 81]. The laser is focused into a cuvette containing the liquid sample or a liquid-jet column (figures 2(a) and (b)). The SHS signal of nanoparticles is then collected at an angle of 90°. Solvents scatter HRS in the forward direction with respect to the incoming fundamental light beam and the solvent HRS intensity is consequently minimized at 90° [82]. The reason for this behavior is so far still under debate. The SHS intensity of nanoparticles with sizes much smaller than the excitation wavelength is not expected to depend on the scattering angle. Figure 2(c) presents angle-resolved measurements of the SHS intensity of different sized AuNPs in Sin/Sout polarization combinations. That means, both the fundamental and the SH light were polarized perpendicular to the scattering plane. For signal detection either a photomultiplier tube (PMT) in combination with a monochromator, a narrow bandpass filter or a spectrograph with CCD camera is used to generate an overview spectrum.

Figure 2. Setups for SHS experiments: (a) in situ setup for high throughput and time resolution, (b) fiber-based setup for wavelength-resolved measurements. See the main text for details. (c) SHS intensity as a function of scattering angle for Au nanoparticles between 23 nm (black line) and 43 nm (purple line). The corresponding scattering profiles were as indicated in the figure. (a) Reprinted with permission from [85], copyright 2016 American Chemical Society.
Download figure:
Standard image High-resolution imageFigures 2(a) and (b) show two exemplary setups used in our group. The setup in figure 2(a) serves as an in situ setup where large collimator and focusing lenses collect the SHS intensity over a broad solid angle which provides high SHS intensities, but poor angular and spectral resolution. In this setup, the quadratic cuvette can be stirred and heated while aliquots of new surface active ligands can be added to the solution. A bandpass filter with a transmission at 405 nm and a bandwidth of 5 nm, transmits the SH wavelength but blocks the fundamental light. The filter is introduced just in front of the PMT, thus the wavelength of the fundamental beam is set to 810 nm, accordingly. Moreover, a colored glass filter (Schott RG780) is installed in front of the focusing lens and absorbs any SHG signals that have been generated before the fundamental has reached the sample. The second setup as shown in figure 2(b) uses a fiber-based collection of photons where several fibers are placed around a 8 mm cylindrical cuvette and which guide the collected photons to an imaging spectrograph with a high-sensitive CCD. On the CCD, the signal of each fiber can be collected in an individual track and recorded separately within a single CCD readout. Again, the fundamental wavelength is typically set to S-polarization while the polarization of the second harmonic beam is not chosen (all out).
For fluorescent nanoparticles the SHS signal has to be spectrally separated from a possible two-photon fluorescence background (2-PF). An example for AuNPs which also give rise to (weak) 2-PF can be found in figure 6(a). Here, the fundamental beam was at a wavelength of 810 nm and therefore the narrow feature at 405 nm corresponds to the SHS signal from the Au nanoparticle surface while the broad feature between 350 and 625 nm is attributable to 2-PF. Recently, Goldys et al [83] suggested that the one-photon fluorescence of AuNPs is due to a transition from d1 and d2 bands of the Au nanoparticle into the LUMO of a ligand at the surface of the AuNP. According to their model, organic ligands are able to promote fluorescence due to a charge transfer across the metal-organic interface. The fluorescence intensity is then governed by the amount of adsorbed ligand and its chemical identity. Furthermore, Wu et al [84] found from their studies on Au25 clusters that in addition to a charge-transfer process, a direct donation of delocalized electrons by electron-rich groups, e.g. COOH or NH2, can largely promote fluorescence emission in contrast to less electron-dense thiol head groups. As fluorescence is in these cases incoherently generated, the 2-PF 'background' can be simply subtracted from the SHS peak.
Besides correction of the SHS intensity for possible 2-PF features and the HRS signal of the solvent, also the extinction spectrum of the nanoparticle solution has to be taken into account when comparing different particle sizes or addressing particle formation processes with SHS. On the path through the cuvette the fundamental and the SH light can be partially absorbed at their respective wavelengths and, consequently, the SHS intensity must be corrected for self-absorption. In case of samples with low concentrations where multiple scattering is negligible, Lambert–Beer law can be applied in order to correct the measured SHS intensity in the following way [41]:

with I2ω,det being the detected SHS intensity, I2ω the corrected intensity,  the extinction at fundamental wavelength and
  the extinction at SH wavelength.
2.3. Particle size and wavelength effects
Assuming that the SHS signal originates purely from the nanoparticle surface, the SH electric field is proportional to the available surface area in the system. Accordingly, the SHS intensity  is a function of the particle's diameter d in the following way:
  . In the case, where the SHS signal predominantly originates from the particle's volume the SHS intensity
  is necessarily proportional to
  .
.
In order to resolve the actual origin of SHS scattering from Au and Ag nanoparticles, particles with different diameters <100 nm are synthesized. Subsequent to their synthesis, the particle size was determined by analytical centrifugation (AC) and their corresponding SHS intensities as well as their extinction spectra were determined experimentally. Figure 3 presents the SH intensities of Au and Ag nanoparticles as a function of their diameter. For citrate-stabilized Au nanoparticles, a close correspondence to the ~d4 dependence of the SHS intensities was found [85]. From a comparison of the latter results with the SH intensity from CTAB-stabilized AuNPs (triangles in figure 3(a)), it becomes apparent that the intensities differ notably. This observation is indicative for a change in the surface electronic structure and is caused by the differences between citrate and CTAB ligand shells (see section 3.1). For Ag nanoparticles, the change of the SH intensity as a function of particle diameter is close but not identical to d4 (figure 3(b)). The result is, however, much closer to a pure surface contribution than to a contribution that is fully dominated by the particle bulk. This observation, is consistent with the works of Brevet et al [68], who reported that the SHS intensity of Au nanoparticles is surface dominated for particles sizes <150 nm. In addition, also the Brevet group addressed the transition from surface to bulk-like signals for Ag nanoparticles and reported that within this system the SHS signals become bulk dominated in the size range of 20–80 nm [86].
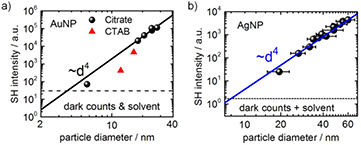
Figure 3. (a) Size dependent SHS intensity for AuNPs stabilized with citrate (black squares) or CTAB (red triangles); (b) size dependent SHS intensity for AgNPs stabilized with citrate. The excitation wavelength was set to 800 and 810 nm for Au and Ag nanoparticles, respectively. All intensities were corrected for the sample's optical extinction as discussed in the text. Citrate-stabilized AuNPs and AgNPs were synthesized according to Puntes et al [29, 30]; CTAB-stabilized AuNPs according to Murphy et al [87]. (a) Reprinted with permission from [85], copyright 2016 American Chemical Society.
Download figure:
Standard image High-resolution imageThe differences in the behavior of Au and Ag nanoparticles can be attributed to their surface-plasmon resonances (SPR) which are at different excitation wavelengths. For 20 nm Ag particles the SPR typically occurs at a wavelength of ~400 nm (figure 4(a), dashed line), while for 60 nm Ag particles the SPR is at 440 nm (figure 4(b), dashed line). Once the SH wavelength is identical or close to a wavelength where the SPR can be excited, it is likely that the SH intensity becomes resonantly enhanced. For this reason, the SH intensity of 20 nm AgNP is maximal around the position of the SPR (figure 4(a)), while for 60 nm Ag nanoparticles the SPR and the maximal SHS intensity shift to higher wavelength, clearly demonstrating the resonant enhancement effect of SHS when the SPR is optically excited at  (figure 4(b)). This is also consistent with previous wavelength-resolved SHS measurement with Au nanoparticles of 11 nm in diameter [88]. In our experiments, the SH wavelengths were close to 400 nm and are, thus, far away from the SPR of Au nanoparticles at ~520 nm.

Figure 4. SHS intensity as a function of the wavelength of the second harmonic and comparison with the linear optical extinction spectrum for Ag nanoparticles with an average diameter of (a) 20 nm and (b) 60 nm. For both particle sizes the highest SHS intensity is found in close vicinity to the SPR wavelength and is caused by a resonant enhancement of the SHS intensity. All SHS intensities were normalized to the hyper-Rayleigh signal from pure aqueous solutions.
Download figure:
Standard image High-resolution imageIn addition, one can also discuss the minimal sizes that are detectable with SHS (using our setups) which can be estimated from data shown in figure 3. For Au nanoparticles, SH signals can be measured for particle sizes as small as 4 nm, while for AgNP the minimal size for SHS spectroscopy is in our current setup about 9 nm. However, Russier-Antoine et al [89] were able to obtain SHS signals from Au15 and Au25 clusters because the hyperpolarizability of these clusters was determined to be significantly higher than for larger sized AuNP > 10 nm and points to a different electronic structure of these clusters as compared to larger Au nanoparticles. These findings suggest that SHS can be used to study metal particle formation processes in situ when combined with a second techniques e.g. UV–Vis extinction spectroscopy that gives complementary information.
2.4. Dipole versus quadrupole contributions from metal nanoparticles
Also dipole or quadrupole contributions can indicate surface or volume contributions from the nanoparticles. In order to resolve these contributions the SHS intensity is measured as a function of polarization angle [68, 90, 91]. The linear polarization of the incident electric field propagates along the z axis and is defined with the angle γ while the SHS intensity along the x axis is collected at a right angle in the y axis direction. The SHS intensity can be either chosen vertically or horizontally corresponding to even and odd SHS modes.
A dipolar SHS mode oriented parallel to the incident beam propagation direction will therefore be independent of the polarization angle when measured horizontally. The electric dipole emission  and the electric quadrupole emission
  are generated by combination of two electric or magnetic fields. For an even ordered optical process as SHS the lowest order mode
  is forbidden as the overall parity is lost. The electric dipole mode can be only generated by
  and
and  , that is by combination of the electric dipole mode with the electric quadrupole mode or magnetic dipole mode. In fact, the dipole mode requires retardation at the fundamental frequency which is fulfilled by the combination with a quadrupole mode. The electric quadrupole emission can be generated under local excitation by a
  process. In fact, for centrosymmetric nanoparticles much smaller than the excitation wavelength a dipole mode is found which exhibits the corresponding surface origin behavior (
 ). For larger sized nanoparticles the electric dipole approximation no longer holds true which results in a quadrupole mode due to retardation effects. For intermediate sizes these two modes might interfere with each other and give rise to intermediate patterns. The group of Brevet established a weighting parameter to distinguish the relative contribution of dipole and quadrupole mode [86]. Theoretical background and schemes of scattering patterns of both SHS and SPR can be found in the work by Dadap et al [90].
For spherical AuNP a dipole mode was found for nanoparticle diameters up to 55 nm while for diameter higher than 69 nm also a quadrupole contribution is found (figure 5(a)). For AgNP a different picture is found (figure 5(b)). Here, dipoles dominate up to sizes of 34 nm of citrate-stabilized AgNP, after which intermediate patterns are found until at 60 nm a distinct quadrupole mode is found. Russier-Antoine et al found a similar behavior [86]. The quadrupole mode for AgNP at smaller sizes than for AuNP is again a result of the resonant enhancement due to the proximate SPR. For larger AuNP also octupoles contribute to the overall intensity [92].

Figure 5. Polar plots of the SHS intensity as a function of the polarization angle of the fundamental wave for (a) AuNPs and (b) AgNPs. The particle size was as indicated in the figure.
Download figure:
Standard image High-resolution image3. In situ surface investigations using SHS
3.1. Au nanoparticles
Besides in situ studies of the size and polarization dependence there are only few works which have addressed the surface properties of nanoparticles in situ with SHS. Harfouch et al [93] showed that the hyperpolarizabilities of Au and Ag nanoparticles were significantly lower when capped with dodecanethiol compared to those which were capped with citrate. The decrease of the hyperpolarizability was attributed to the charge transfer between Au surface atoms and the sulfur of the thiol as Au–S bonds were formed. At metal surfaces the formation of strong bonds such as Au–S or Ag–S leads to a localization of metal surface electrons and to a reduction of  of the metal surface. This effect has been previously examined on planar Au and other metal substrates [94–96]. By a combination of ex situ XPS and in situ SHG, Buck et al [97] studied the adsorption of long-chain thiol molecules onto a planar Au substrate and showed that the reduction of
  upon thiol adsorption can be linearly related to the surface coverage of thiols. The decrease of the SHS signal can be then described as the difference of the initial intensity
  of the blank Au substrate and the intensity of thiol covered Au surface
  that is a function of the corresponding thiol coverage:


Here,  is the second-order electric susceptibility of a blank or thiol covered Au surface, θi is the respective surface coverage and
  is the intensity of the fundamental light. For t = 0 the coverage of the pure Au surface θblank is equal to 1.
For AuNP Haber et al were first to probe in situ adsorption of malachite green at the surface of 16 nm AuNP [98]. In this case the ligand malachite green is strongly SHS active and served as an optical marker molecule. The authors were able to measure an adsorption isotherm with in situ SHS and obtain the free energy of adsorption and the number of adsorbate sites per particle. For the analyses a modified Langmuir model was applied which was established by Wang et al [99]. The standard Langmuir model applies only for planar substrates for which the total surface site concentration of the substrate is usually much smaller than the concentration of the adsorbing molecules in the bulk liquid. For nanoparticles, however, the overall surface area can be quite large which can lead to a depletion of the adsorbing molecules in the bulk solution. If this depletion is taken into account, the following modified Langmuir model is obtained:
with C being the molecule concentration,  = 55.5 mol l−1 the concentration of water, Nads the number density of adsorbed molecules, Nmax the maximum density of adsorbed molecules and K the equilibrium constant. As discussed above, the decrease of
  can be linearly related to the surface coverage of the adsorbing molecule. Consequently, the SHS intensity scales quadratically with the surface coverage. To illustrate this point, the modified Langmuir model in equation (10) has been squared as it is proportional to the measured SHS intensity in that form. Besides obtaining K and therefore the Gibbs free energy ΔG = −RT ln K as in the standard Langmuir model, also the maximum density of adsorbed molecules Nmax on the nanoparticle surface is received from the data analysis. This quantity can then be used to calculate the surface coverage of the adsorbed molecule by first calculating the available specific surface area
  , where d is the nanoparticle diameter and
  the nanoparticle concentration and subsequently the surface coverage
  [85]. Obviously, the surface coverage
  is strongly dependent on the nanoparticle diameter which should be carefully examined.
In continuation of these previous studies, our group [85] has performed ligand exchange experiments with sodium 3-mercapto-1-propanesulfonate (MPS) on colloidal AuNPs. The particles were synthesized according to the seeded-growth protocol by Puntes et al [29] and their diameter was determined by AC to 27 ± 4 nm. AC was chosen for size determination as the high density of the nanoparticle core mainly dictates the sedimentation coefficient whereas the less dense ligand shell can be neglected. In particular, AUC is highly sensitive to measure core–shell structures directly in solution [100], while the combination with SAXS and SANS sheds further light on core–shell structures [101]. As mentioned earlier, the characterization of the nanoparticle diameter is crucial for the analysis of the adsorption isotherm and the calculation of the surface coverage. SEM images confirmed that the AuNPs were mostly spherical. The nanoparticle concentration  was calculated from the amount of Au in the synthesis and determined to 9.6 ± 2.6 · 1014 NP l−1.
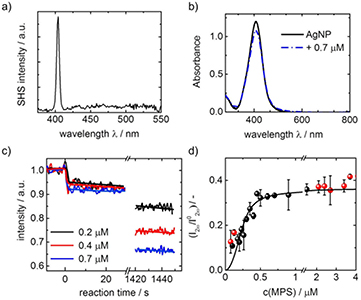
Extinction spectra (figure 6(d)) showed a surface plasmon resonance (SPR) at 525 nm which is typical for such AuNP sizes [29]. The SPR did not shift during ligand exchange which indicated that no agglomeration of AuNPs took place. SHS spectra were excited at 810 nm; the SHS peak is accordingly found at 405 nm, while the 2-PF stretches from 350 nm to 625 nm (figure 6(a)). After MPS addition a pronounced decrease of both SHS and 2-PF was found. The decrease of 2-PF can be explained by the thiol group of MPS being less electron dense than the carboxyl group of citrate and thereby promoting less fluorescence than citrate by electron donation across the metal-ligand interface. In fact, the decrease of SHS and 2-PF for each MPS concentration was found to be very similar.
Moreover, the addition of MPS into the AuNP dispersion was followed in situ with SHS (figure 6(b)). With our in situ setup we were able to resolve two adsorption steps: an initial fast intensity decrease (<5 s) which is followed by a much slower decrease (>24 min). The additional intensity increase for lower MPS concentrations (<6 µM MPS) is attributed to an initial concentration gradient due to incomplete mixing at early stages of the exchange. After 25 min an equilibrium state was established. The steady SHS intensity indicates that no significant agglomeration took place during MPS adsorption as the intensity is expected to increase strongly with particle size [102].
In order to gain thermodynamic information the intensity decrease after 25 min at equilibrium as a function of MPS concentration is fitted with the modified Langmuir model discussed above (figure 6(c)). This yielded an equilibrium constant K of (1.73 ± 0.2) · 108 which gives a free Gibbs energy of adsorption ΔG of −46 ± 1 kJ mol−1. Moreover, the maximum density of MPS on the AuNP surface is determined by the fit to 7.6 ± 0.6 µmol l−1 which resulted in a surface coverage of MPS of 3.5 ± 1.9 µmol m−2.

Figure 6. (a) Wavelength resolved SHS spectra before and after addition of MPS; (b) SHS and 2-PF intensity versus time upon MPS addition at different concentrations; (c) SHS and 2-PF intensity decrease as a function of MPS concentration. The solid line is a fit to the data with a modified Langmuir adsorption model; (d) UV–Vis spectra before and after MPS addition. Reprinted with permission from [85], copyright 2016 American Chemical Society.
Download figure:
Standard image High-resolution imageEarlier, the surface coverage of 3-mercaptopropionic acid (MPA) on planar Au(1 1 1) was determined using a combination of cyclic voltammetry and electrochemical scanning tunneling microscopy (STM) to 6.8 µmol m−2 which is close to the theoretical maximum of 7.7 µmol m−2 for a (3 × 3) superstructure of MPA molecules on Au(1 1 1) [103, 104]. Comparing the obtained MPS surface coverage to values of MPA adsorption on planar Au substrates we find that only a coverage of 0.51 monolayer as compared to a planar surface is obtained. Obviously, citrate was not fully exchanged with MPS but both are co-adsorbed on the AuNP surface. This is probably due to formation of citrate network on the Au surface [47, 48]. A recent combination of ex situ attenuated total reflectance IR absorption spectroscopy (ATR-IRAS) and XPS on AuNP suggested that initial citrate actually resists thiol adsorption as the citrate molecules form a network by strong hydrogen bonds, thus kinetically hindering the adsorption of thiols from the bulk to the Au surface [47]. Therefore we can now explain the two adsorption processes as follows: the fast initial intensity decrease is attributed to MPS adsorption on defect sites, e.g. vertex or edge sites, which are sterically easily accessible whereas the slow intensity decrease is attributed to the adsorption on terrace sites where the citrate both sterically and electrostatically hinders MPS adsorption.
3.2. Ag nanoparticles
For AgNPs ligand exchange experiments with in situ SHS have been first conducted in the group of Dai. Their experiments were performed on 80 nm AgNP whose SHS intensity was quenched with three different ligands and by applying the modified Langmuir model the free Gibbs energy was calculated for 1,2-benzenedithiol [105]. Later work included temperature dependent SHS measurement in order to gain the activation barrier for the adsorption process of 1,2-benzenedithiol on 80 nm AgNP which they found to be of the order of 35 kJ mol−1 while the Gibbs free energy was determined to −37 kJ mol−1 [106].
In a more recent study, Dai and co-workers concentrated on the adsorption of MPS on 80 nm AgNP where they distinguished between two surface adsorption sites. Here, the author's analysis was based on a two-step adsorption isotherm [81]. They attributed these sites to charge repulsion among the thiols on or near the surface. In their model, thiols adsorb at low coverages without replacing citrate until the electrostatic interthiol repulsion becomes too high. Only when the MPS concentration is further increased the thiol is assumed to replace citrate. However, they also found a two-step decrease in SHS intensity in their kinetics which they also attributed to the same two-step mechanism due to thiol repulsion. They found that the adsorption kinetics took about 12 h to reach an equilibrium state. The size of the AgNP was determined with DLS to 80 ± 20 nm which is clearly in the regime of a high bulk contribution to the SHS signal (see above). TEM images indicated polyhedral shaped AgNP. The role of citrate was left out from the discussion which at least for AuNPs plays a dominant role for adsorption processes as discussed above.
In our group the MPS adsorption on AuNP was also extended to AgNP. Nanoparticles were synthesized by citrate reduction of AgNO3 in the presence of tannic acid [30]. As the tannic acid is fluorescent, the nanoparticles were centrifuged four times at 18 000 g, washed with water and finally redispersed in 1.2 mM citrate solution. As the SHS spectrum showed no indication for 2-PF, only the SHS signal at 405 nm due to excitation at 810 nm is present (figure 7(a)). This indicated that tannic acid was successfully removed from the dispersion. The diameter of the AgNP was determined with AC to 27 ± 3 nm where the SHS is of surface origin (figure 7(b)). SEM images showed that the particles were spherical in shape. Ligand exchange was again performed with MPS. In contrast to adsorption at AuNP where an equilibrium state was reached after 25 min, the equilibrium for AgNP was reached only after 24 h. Therefore, no complete kinetics are provided but only some examples of the initial MPS addition and first few minutes of adsorption (figure 7(c)). Similar to AuNP and to Dai et al, a two-step mechanism was found with a fast decrease occuring within a few seconds and a second much slower decrease happening over 1 d. The much longer adsorption times on AgNP than on AuNP might be correlated with the citrate having a higher affinity for Ag. Ab initio calculations which addressed citrate adsorption on Ag surfaces found that on Ag(1 1 1) the binding energy of citrate is quite high with −58 kJ mol−1 while for Ag(1 0 0) it is much smaller with −15 kJ mol−1 [107]. For citrate adsorption on Au(1 1 1) the adsorption energy was determined to −38 kJ mol−1 using MD simulations [108].
Figure 7. (a) SHS spectrum of AgNP after centrifugation, inset: UV–Vis spectra before and after MPS addition; (b) size distribution of AgNP as obtained from DLS and AC; (c) SHS intensity during MPS addition, MPS was added at t = 0 s; (d) final SHS intensity decrease versus MPS concentration with modified Langmuir model fit.
Download figure:
Standard image High-resolution image
The final value of the decrease once the particle surface were in thermal equilibrium after 24 h was plotted against MPS concentration and the modified Langmuir adsorption isotherm model was applied to fit the data (figure 7(d)). The equilibrium constant K was determined by the model to (3.0 ± 2.22) · 109 which gives a Gibbs free energy of −53 ± 3 kJ mol−1. In comparison, the Gibbs free energy for MPS on AuNP was determined to −46 ± 1. According to DFT studies on the adsorption of alkanethiols on Ag(1 1 1) and Au(1 1 1) the Au–S bond is of more covalent character than Ag–S [109]. Moreover, the binding energy of CH3S [109] adsorbed on Ag(1 1 1) was found to be higher than on Au(1 1 1) as long as surface relaxation was neglected and low-coverages are assumed. The adsorption of n-alkanethiols onto Ag(1 1 1) was studied with cyclic voltammetry and in situ SERS and two adsorption free energies were determined for a low and a high coverage regime to −95 kJ mol−1 and −69 kJ mol−1, respectively [110]. Dai et al [81] gave −60 kJ mol−1 and −31 kJ mol−1 for the first and second adsorption step, respectively. The free Gibbs energy as found by our group fits well with this data.
The density of MPS on AgNP was determined by the Langmuir model to 0.27 ± 0.05 µmol l−1 which resulted in a MPS coverage of 1.5 ± 0.4 µmol m−2 for a AgNP concentration of (7.7 ± 0.8)·1013 NP l−1. For MPS on 80 nm AgNP Dai et al [81] found larger values, namely 3.7 µmol m−2 and 2.7 µmol m−2 for the first and second adsorption step, resulting in a total MPS coverage of 6.3 µmol m−2. Ag and Au both crystallize in fcc with quite similar lattice constants of Au = 4.070 Å and Ag = 4.078 Å. For 27 nm AuNP a MPS surface coverage of 3.5 µmol m−2 was found which is substantially larger than the surface coverage on the 27 nm AgNP in this study. Possible causes for this difference are different surface sites present on the respective NP to which citrate is more or less strongly adsorbed or Ag having a general higher affinity to citrate as Au as indicated from the longer adsorption times. However, from literature no comparison has been performed yet on this issue. Hubbard et al [111] determined the surface coverage of 1-propanethiol and 2-mercaptoethanol on planar Ag(1 1 1) by means of Auger spectroscopy and low-energy electron diffraction (LEED) to 6.8 µmol m−2 and 7.0 µmol m−2, respectively. For 2-mercaptoethanesulfonic acid (MES), a charged molecule with a large end group, the surface coverage was found to be only 3.9 µmol m−2. As MPS is in structure quite close to MES, the monolayer coverage of MPS can be determined to 0.38 monolayers with respect to a planar Ag substrate. As for AuNP, no full MPS monolayer is achieved which is probably due to a similar citrate-binding network on the nanoparticle surface. Due to the two-step adsorption behavior from the kinetic, we suggest that the same model as for MPS on AuNP applies [111].
4. Conclusions
In this Topical Review, we have attempted to give an introduction to SHS on metal nanoparticles and highlight the potential of SHS for in situ surface investigations of colloidal gold and silver nanoparticles. Due to a lack of suitable experimental techniques information on surface properties of nanoparticles in liquids is not easily available. Often, techniques are performed ex situ or they only apply to planar substrates or are in need of strongly absorbing marker molecules. SHS has been proven to be a powerful tool for investigations on ligand exchange at the surface of colloidal gold and silver nanoparticles due to its intrinsic surface sensitivity. In situ SHS is able to provide thermodynamic data like Gibbs free energy of adsorption and also kinetic information. Using SHS it was possible to distinguish between two different adsorption steps which were attributed to adsorption at two surface sites of different reactivity.
Future work might include expanding the in situ SHS investigation of ligand exchange to different molecules in order to find electronic or steric patterns of the ligand which allow for a better desorption of citrate and monolayer coverage of the desired ligand. Other work could investigate whether the suggested two-step adsorption mechanism can be applied to other nanoparticle sizes or systems.
Acknowledgments
The authors gratefully acknowledge financial support from the German Research Council (DFG) through project PE 427/29-1, the Cluster of Excellence Engineering of Advanced Materials (EAM) within the framework of the 'Excellence Initiative' and the Interdisciplinary Center for Functional Particle Systems (FPS).