

Abstract
The phase transformation behavior of anatase and rutile titanium dioxide with particle sizes of 60 nm and 150 nm under shock compression have been investigated. To increase the shock pressure and reduce the shock temperature, copper powder and a small amount of paraffin were mixed with the TiO2 powder. The shock recovered samples were characterized by x-ray diffraction, Raman spectroscopy, and transmission electron microscope. The results indicate that both anatase and rutile TiO2 can transform to α-PbO2 phase TiO2 through shock-induced phase transition. The transformation rate of α-PbO2 phase TiO2 for anatase TiO2 under shock compression is 100% and pure α-PbO2 phase TiO2 can be obtained, while the transformation rate for rutile TiO2 is over 90%. The influence of the particle size on the yield of α-PbO2 phase TiO2 is not noticeable. The thermal stability of the recovered pure α-PbO2 phase TiO2 was characterized by high temperature x-ray diffraction, thermogravimetric analysis and differential scanning calorimetry. The results show that α-PbO2 phase TiO2 transforms to rutile TiO2 when heated to temperature higher than 560 °C. The mechanisms of the phase transition of TiO2 under shock compression are discussed.
Export citation and abstract BibTeX RIS
1. Introduction
Titanium dioxide and related materials have attracted considerable attention worldwide due to its specific commercial application in environmental photocatalysis, solar cells, gas sensors, etc [1–4]. In addition, the study of high-pressure phases of titanium dioxide is of great geophysical significance [5–8]. The experimental and theoretical studies revealed that there could exist many different structured polymorphs of titanium dioxide under different pressure and temperature conditions [9]. At ambient condition, titanium dioxide exists mainly in the form of anatase, brookite and rutile, which were reported to be the most stable and abundant in nature [5, 10]. Under certain high-pressure high-temperature conditions, various types of high-pressure modifications with excellent electronic and mechanical properties may occur [10–12], for example α-PbO2, baddeleyite, OI, cotunnite, fluorite or distorted fluorite-like cubic phase [10, 12–20] and other post-cotunnite phases [21]. However most of the high-pressure polymorphs reverse to α-PbO2 phase during the decompression process. α-PbO2 phase is one of the high-pressure polymorph which can be quenched at ambient condition in addition to the baddeleyite phase TiO2 reported by Goresy et al [8].
As the common phases of titanium dioxide, the powder or single crystals of anatase or rutile TiO2 were often selected as the starting materials to study the phase transition behavior of titanium dioxide under static or shock compression conditions. Recently, Nishio-Hamane et al [18] revealed that the phase transition sequence under static high pressure was rutile → α-PbO2 phase → baddeleyite phase → OI phase → cotunnite phase with increasing pressure. This is consistent with the sequence reported by Dubrovinskaia et al [20], and they also suggested that the cotunnite phase was the most stable phase under high pressures ranging from 40 GPa to at least 70 GPa. The cotunnite phase was reported to be formed at pressures above 60 GPa and temperatures above 1000 K under static compression condition by Dubrovinsky et al [12] and Ahuja et al [22], and then the cotunnite phase TiO2 was quenched below 170 K. The mechanical properties measured indicate that the cotunnite phase TiO2 is the hardest dioxide so far discovered. However, the results conflicted with the results reported by Nishio-Hamane et al [18], so the hardness of the cotunnite phase TiO2 is still controversial. In 2004, Mattesini et al [17] reported the coexistence of the known cotunnite phase and a new cubic phase TiO2 under static compression conditions. However the new cubic phase was hard to quench during the decompression process, and they also suggested that high temperature was required to synthesize the new cubic phase TiO2. In 2011, Dekura et al [21] reported the discovery of a new post-cotunnite phase of TiO2 both by theoretical and experimental studies under high pressure, but when the pressure was released, the new phase converted to the normal phase. Despite the fact that the static compression conditions are easy to control and the loading time can vary from microseconds to several days, the amount of the sample treated is too little, and the high-pressure modifications are always hard to quench due to the low cooling rate.
The shock compression technology has attracted considerable attention worldwide and has been successfully used to synthesize various new materials due to its unique advantages, such as high pressure, high temperature, high quenching rate and a larger sample volume compared with static compression method. In the past few decades, some techniques have been developed to control the pressures and temperatures during shock compression to synthesize cubic diamond, cubic born nitride and cubic silicon nitride [23–26]. In 1967, the shock Hugoniot data for c-axis direction were measured by the flash-gap method by McQueen et al [16], and ones for unknown axis done by the pin contactor up to >200 GPa by Alt'shuler et al [27]. They found the phase transition to α-PbO2 phase at about 33 GPa. Linde and DeCarli [28] confirmed this transition by the pressure measurement using manganin-gauge method and the recovery experiment. X-ray diffraction (XRD) patterns of the recovered samples demonstrated the presence of α-PbO2 structured high pressure polymorph, and the maximum transformation rate for rutile-type single crystal was about 90%. For the powder samples, the transformation rate was no more than 30%. Anisotropic phase transitions were first measured for 〈1 0 0〉, 〈1 1 0〉 and 〈0 0 1〉 axis directions by the electro-magnetic-gauge method by Mashimo et al [29]. Then, Syono et al [30] measured them up to >100 GPa by the inclined-mirror method. They revealed that the phase transition pressure of rutile single crystal to α-PbO2 phase TiO2 depended strongly on the shock wave propagation direction, e.g. 13.7 GPa for [1 0 0], 16.9 GPa for [1 1 0] and 33.8 GPa for [0 0 1], respectively. They also observed two new phases, which were named as the HPP-I and HPP-II, for pressures from 70 GPa to 100 GPa. In this work, they did not perform the recovery experiment except the Hugoniot measurement experiment in this paper. Later, they performed the recovery experiments of single crystals [14], and the maximum yield of α-PbO2 phase TiO2 was about 70% for rutile single crystal parallel to [1 0 0] direction. In 1984, Morosin et al used a mixture of anatase and rutile TiO2 powder as the starting material to study the phase transition behavior under shock compression conditions for pressure range from 20 GPa to 27 GPa, but none of high pressure polymorphs was observed [31]. Compared with considerable work conducted for rutile TiO2, few literatures can be found for shock compression of anatase TiO2. Molodets et al [32] and Shul'ga et al [33] selected pure anatase TiO2 as the starting material to study the phase transition behavior under shock compression, and found that the anatase particles would either transform into α-PbO2 phase or exhibit amorphization. The occurrence of α-PbO2 phase TiO2 in nature due to the high-pressure endogenic geological processes or bolide impact events was reported by Hwang et al [34] for the first time, and later by Goresy et al [13], Chen et al [6] and Shen et al [7] and recently by Smith et al [35]. In addition to α-PbO2 phase TiO2, Goresy et al [8] reported the discovery of another high-pressure phase of TiO2 in the shocked rocks with cell parameters of a = 4.606(2) Å, b = 4.986(3) Å, c = 4.933(3) Å, which can be attributed to the baddeleyite-type TiO2.
Despite many attempts to synthesize various kinds of high pressure polymorphs of titanium dioxide, the transformation rate of α-PbO2 phase TiO2 is not very high and pure α-PbO2 phase TiO2 is hard to obtain no matter by static or shock-compression method up to date. This is mainly due to the vulnerable reverse phase transformation of α-PbO2 phase to rutile TiO2 induced by the high residual temperature after shock unloading. In addition, the α-PbO2 phase TiO2 obtained through static or shock induced phase transition has not been well characterized. In this work, the phase transformation behavior of commercial anatase and rutile TiO2 powder under shock compression is reported, and the structure and thermal stability of the obtained pure α-PbO2 phase TiO2 are characterized.
2. Experimental methods
A planar shock compression assembly was used to generate shock pressures with different magnitude. Figure 1 illustrates the shock compression setup. A copper flyer with a diameter of 40 mm and a thickness of 2 mm is accelerated to a high velocity by the detonation of the main explosive charge of nitromethane (CH3NO2), initiated by a booster charge of 8701 explosive. The impact velocity calculated according to the Gurney equation [36] approaches 1.7 km s−1 for each shot. Then the copper flyer impacts on the copper sample container, and the generated shock waves act on the powder sample stored in the sample container.
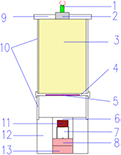
Figure 1. Schematic of shock compression setup. (1) Detonator, (2) booster charge, (3) main explosive charge, (4) bottom cover, (5) flyer, (6) sample container, (7) screw lid, (8) spall plate 1, (9) upper cover, (10) PVC plastic tube, (11) powder sample, (12) steel confinement ring, (13) spall plate2.
Download figure:
Standard image High-resolution imageCommercial anatase and rutile TiO2 powder with particle sizes of 60 nm and150 nm were chosen as the starting material. To increase the shock pressure and reduce the shock and residual temperatures, copper powder was mixed with the TiO2 powder due to its high shock impedance and thermal conductance. To further reduce the porosity and lower the shock temperature and residual temperature, a small amount of paraffin was mixed with the TiO2 and copper powder. Paraffin can also act as a lubricant to reduce the heat generated by particle friction during shock compression. Then the powder mixture was pressed into the sample container with a pressing pressure of 150 MPa. During the pressing process, excessive paraffin was extruded out and nearly all the interparticle pores between copper and/or TiO2 particles can be filled by paraffin. A mere mixture of TiO2 and copper powder without addition of paraffin was also tested for comparison. The equation of state (EOS) of the porous powder mixtures was calculated using the Mie–Grüneisen EOS of the components and a mixture method [36, 37]. The impedance match method [36, 38] was used to calculate the pressure generated in the powder sample. The shock temperature and residual temperature were calculated with consideration of reverberation effects with surrounding copper. In the calculation, the TiO2 particles were treated as thin layers surrounded by the mixture of copper and paraffin. At the upper and lower interface between the TiO2 thin layer and surrounding copper mixture, the shock wave reflects and increases the pressure. After multiple reflections, the sample pressure reaches the pressure at the interface of mixture and Cu flyer. The final shock temperature and residual temperature in TiO2 were approximated by the first wave in the multiple reflection, because the Hugoniot energy increases of the following shock wave are very small. Figure 2 shows the impedance matching technique for determining the first shock-loading states in rutile TiO2. The shock temperature and the residual temperature after shock unloading were estimated by the thermodynamic method [36], given by

Figure 2. Illustration showing impedance matching technique for determining shock-loading states in rutile TiO2, for the case of shot no. 373, at impact velocity 1700 m s−1.
Download figure:
Standard image High-resolution imageWhere T0 is the initial temperature;  and
and  are shock temperature and residual temperature, respectively;
  and V are initial specific volume and specific volume corresponding to the determined shock pressure P, respectively;
  is the Gruneisen coefficient and
  is the specific heat at constant volume. Table 1 shows the detailed experimental conditions for all the tests, including shock pressure, shock temperature and residue temperature. After the shock experiment, the samples were taken out of the container and immersed into nitric acid to remove the copper powder. To remove the paraffin, the sample was further extracted with low boiling point petroleum ether under reflux. Finally, the purified sample was dried for various characterization.
Table 1. Experimental conditions for shock compression tests and phase contents of the recovered samples.
| Shots | Sample compositions (wt.%) | Density (g cm−3) | Relative density (%) | Final shock pressure (GPa) | Pressure in TiO2 (GPa) | Shock temperature (K) | Residual temperature (K) | Phase contents (%) | ||
|---|---|---|---|---|---|---|---|---|---|---|
| Anatase | Rutile | α-PbO2 | ||||||||
| 373 | 150 nm TiO2 (anatase) (3.6) + Cu (96.4) | 7.46 | 87 | 31.1 | 20.2 | 1808 | 1097 | 0 | 62.39 | 37.61 |
| 1322 | 60 nm TiO2 (anatase) (3.58) + Cu (95.82) + paraffin (0.6) | 8.15 | 100 | 37.7 | 24.6 | 892 | 469 | 0 | 0 | 100 |
| 1324 | 150 nm TiO2 (anatase) (3.59) + Cu (96.28) + paraffin (0.13) | 8.5 | 100 | 38.8 | 24.5 | 888 | 468 | 0 | 0 | 100 |
| 1321 | 60 nm TiO2 (rutile) (3.53) + Cu (94.51) + paraffin (1.96) | 7.29 | 100 | 35.5 | 24.9 | 901 | 472 | 0 | 9.10 | 90.90 |
| 1323 | 150 nm TiO2 (rutile) (3.58) + Cu (95.93) + paraffin (0.49) | 8.23 | 100 | 37.9 | 24.6 | 891 | 469 | 0 | 8.29 | 91.71 |
XRD patterns of all the recovered samples were recorded by operating a Rigaku D/MAX-2500 at a working voltage of 40 kV and a working current of 200 mA with Cu Kα radiation. According to XRD analysis, sample 1324 was selected to further characterize the structure and thermal stability of pure α-PbO2 phase TiO2. Raman spectra were recorded on a LabRAM Aramis Raman spectrometer with a He–Ne laser at an excitation wavelength of 514.5 nm. The microstructures were characterized by using a transmission electron microscope (TEM, JEM-2010) with an accelerating voltage of 200 kV. High temperature x-ray diffraction (HTXRD), thermogravimetric analysis (TG) and differential scanning calorimetry (DSC) were used to study its thermal stability. HTXRD analysis were conducted at temperatures from 300 °C to 900 °C under atmospheric pressure and preserved for half an hour at each temperature points. The TG-DSC data were recorded from room temperature to 1200 °C.
3. Results and discussion
3.1. X-ray diffraction (XRD)
Figure 3 shows the XRD patterns of the five recovered samples. The XRD patterns of the original anatase and rutile TiO2 are given for comparison. For all the recovered samples, the diffraction peaks at approximately 31.4° are assigned to the (1 1 1) plane of α-PbO2 phase TiO2 (JCPDS 21-1236), demonstrating the phase transformation of anatase and rutile TiO2 to α-PbO2 phase TiO2 under shock compression. The characteristic peaks of rutile, anatase and α-PbO2 phase TiO2 are marked with various symbols respectively. By carefully analyzing the diffraction patterns, the phase contents were calculated according to a formula given in [39], as listed in table 1.
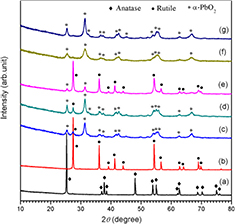
Figure 3. XRD patterns of post-shock samples under different shock compression conditions. (a) 150 nm anatase TiO2, (b) 150 nm rutile TiO2, (c) shot 1321, (d) shot 1323, (e) shot 373, (f) shot 1322 and (g) shot 1324.
Download figure:
Standard image High-resolution imageThe XRD pattern of the sample for anatase TiO2 and copper powder mixture without the addition of paraffin (shot 373, figure 3(e)) shows that the original anatase TiO2 is completely transformed to rutile and α-PbO2 phase TiO2, and the content of α-PbO2 phase TiO2 is only 37.61%. The XRD patterns of the samples for anatase and copper powder mixtures with the addition of paraffin (shots 1322 and 1324, figures 3(f) and (g)) show that all the diffraction peaks can be assigned to α-PbO2 phase TiO2, demonstrating that anatase TiO2 is completely transformed into α-PbO2 phase TiO2 and pure α-PbO2 phase TiO2 is obtained. The cell parameters calculated according to the XRD patterns are a = 4.547 Å, b = 5.507 Å and c = 4.893 Å, which is in agreement with the results reported by Goresy et al [13]. These results clearly show that addition of a small amount of paraffin plays an important role to quench α-PbO2 phase TiO2 during shock compression. Figures 3(c) and (d) show the XRD patterns of shocked rutile and copper powder mixture with addition of paraffin and the content of α-PbO2 phase TiO2 is approximately 90%. The transformation rate of α-PbO2 phase TiO2 for rutile powder is close to that for rutile single crystal (90%) and much higher than that of the powder samples (30%) reported by Linde et al [28]. Considering the transformation rate of 100 % for anatase powder and 90% for rutile powder under similar shock conditions, we can conclude that anatase TiO2 is easier to transform to α-PbO2 phase TiO2 than rutile TiO2 under shock compression. If we compare the transformation rates of α-PbO2 phase TiO2 for rutile powder with two particle sizes of 60 nm and 150 nm (91.71% for shot 1323 and 90.90% for shot 1321) and complete transformation of α-PbO2 phase TiO2 for anatase powder with two particle sizes of 60 nm and 150 nm, we can conclude that the influence of the particle size on the yield of α-PbO2 phase is not obvious.
3.2. Raman spectra
Figure 4 shows the Raman spectra of α-PbO2 phase TiO2 obtained from shot 1324. The Raman spectra of the starting anatase TiO2 is given for comparison. The Raman spectrum of the anatase TiO2 (figure 4(a)) displays well defined peaks at 143, 197, 396, 518, 639 cm−1, respectively, which is consistent with the data reported in literatures [33, 40, 41]. While the Raman spectrum of shock synthesized α-PbO2 phase TiO2 displays ten Raman bands (figure 4(b)) at the wave numbers of 150, 176, 289, 316, 339, 354, 428, 533, 570 and 612 cm−1, respectively. The wave numbers of these bands are consistent with the data measured for α-PbO2 TiO2 obtained by static experiments [40] and that discovered in nature due to impact events (152, 175, 285, 315, 340, 358, 428, 532, 575 and 610 cm−1) [35]. No peaks corresponding to anatase or rutile TiO2 were observed. Raman spectra analysis confirms that the sample obtained from shot 1324 is pure α-PbO2 phase TiO2.
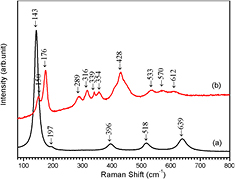
Figure 4. Raman spectra of the starting anatase powder and α-PbO2 phase TiO2. (a) Starting anatase TiO2 with a particle size of 150 nm, (b) α-PbO2 phase TiO2 obtained from shot 1324.
Download figure:
Standard image High-resolution image3.3. Transmission electron microscopy
Figure 5 shows typical high-resolution TEM images of α-PbO2 phase TiO2 obtained from shot 1324. The TiO2 particles after shock compression are ellipsoidal in shape with good crystallinity. The interplanar spacings of 0.354 nm and 0.286 nm corresponding to the (1 1 0) and (1 1 1) crystal planes of α-PbO2 phase TiO2 can be clearly discerned. The average particle size is approximately 14 nm, which is far smaller than the original 150 nm. This demonstrates that particle size refinement occurs during shock compression. The interpalanar spacings of α-PbO2 phase TiO2 were calculated through the SAED pattern (figure 5(a)), as shown in table 2. The standard values of α-PbO2 phase (JCPDS 21-1236) are also given for comparison. The d-spacings of the α-PbO2 TiO2 obtained in this paper are in good agreement with the standard values of α-PbO2 phase.
Table 2. Interplanar spacings calculated by SAED patterns for shock synthesized α-PbO2 TiO2 obtained from shot 1324.
| h k l | d-spacings (d(h k l)) (Å) | |
|---|---|---|
| Sample 1324 | α-PbO2 phase | |
| 1 1 0 | 3.54 | 3.50 |
| 1 1 1 | 2.82 | 2.84 |
| 0 0 2 | 2.46 | 2.45 |
| 1 0 2 | 2.17 | 2.15 |
| 2 0 2 | 1.66 | 1.66 |
| 2 2 2 | 1.41 | 1.42 |
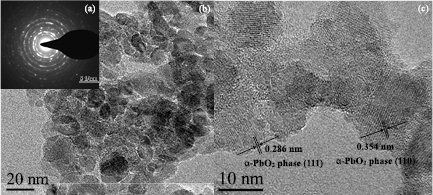
Figure 5. High-resolution TEM images of shock synthesized α-PbO2 TiO2 obtained from shot 1324. (a) The selected area electron diffraction (SAED) pattern. (b), (c) High-resolution TEM (HRTEM) images.
Download figure:
Standard image High-resolution image3.4. Thermal stability
α-PbO2 phase TiO2 is a thermal metastable phase. It may transform to rutile phase when heated. The reported onset reverse transformation temperature of the shock synthesized α-PbO2 phase TiO2 under atmospheric pressure is 440 °C by Linde et al [28] and above 450 °C by McQueen et al [16]. For the α-PbO2 phase TiO2 discovered in nature, the reported onset reverse transformation temperature under atmospheric pressure is 500 °C by Goresy et al [13], above 300 °C–900 °C by Chen et al [6].
Figure 6 shows the high temperature XRD patterns of pure α-PbO2 phase TiO2 obtained from shot 1324. For temperature below 500 °C, the diffraction peaks of α-PbO2 phase TiO2 do not show any noticeable change (figures 6(a)–(c)), demonstrating that the α-PbO2 phase TiO2 is rather stable at temperatures below 500 °C under atmospheric pressure. When the temperature is increased to 600 °C, a diffraction peak around 27.5° (figure 6(d)) assigned to (1 1 0) plane of rutile TiO2 (JCPDS 65-1119) can be observed, implying the occurrence of reverse transformation of α-PbO2 phase TiO2 to rutile TiO2. When the temperature is further increased to 800 °C and above, all the diffraction peaks assigned to α-PbO2 phase TiO2 disappear and all the diffraction peaks with enhanced intensities can be assigned to rutile TiO2.
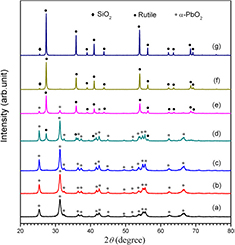
Figure 6. High temperature XRD patterns of shock synthesized α-PbO2 TiO2 obtained from shot 1324 under different temperature. (a) 300 °C, (b) 400 °C, (c) 500 °C, (d) 600 °C, (e) 700 °C, (f) 800 °C and (g) 900 °C.
Download figure:
Standard image High-resolution imageFigure 7 shows the TG-DSC curves for pure α-PbO2 phase TiO2 obtained from shot 1324. The TG curve shows that the mass loss is approximately 8.9 wt% when temperature is increased to 560 °C, which can be attributed to the evaporation of residual solvents and absorbed water. The DSC curve suggests the onset of heat release at 560 °C, demonstrating that the onset reverse transition temperature is about 560 °C, which is consistent with the result of high temperature XRD patterns. When the temperature is above 600 °C, little weight loss (about 2.3 wt%) is observed and the DSC curve shows a smooth downward trend due to continuous reverse transformation of α-PbO2 phaseTiO2 to rutile TiO2.

Figure 7. TG-DSC curves of shock synthesized α-PbO2 TiO2 obtained from shot 1324.
Download figure:
Standard image High-resolution image
3.5. Mechanism of the phase transition
The formation mechanism of α-PbO2 phase TiO2 under shock compression remains controversial. Kusaba et al [14] reported that α-PbO2 phase TiO2 was formed due to reverse phase transition of fluorite or distorted fluorite type during shock unloading and they proposed a displacive mechanism, while the study of phase transition under static high pressure [18] clearly showed that rutile phase TiO2 firstly transformed to α-PbO2 phase and then to other high pressure phases. The shock experiments reported by Syono et al [30] revealed that the formation of fluorite or distorted fluorite type TiO2 would occur only for pressure range from 70 GPa to 100 GPa. The calculated shock pressure in the present study is 31.1–38.9 GPa, much lower than the required onset phase transformation pressure of anatase or rutile TiO2 to fluorite or distorted fluorite type TiO2. According to the high energy ball milling experiment results reported by Ren et al [42], anatase TiO2 can directly convert to α-PbO2 phase TiO2 at pressures below 6 GPa. So we propose that the anatase or rutile TiO2 precursor directly convert to α-PbO2 phase TiO2 under shock compression, followed by possible reverse transformation of α-PbO2 phase TiO2 to rutile phase depending on residual temperature after shock unloading.
The residual temperature after shock unloading is crucial for quenching shock formed metastable phases like α-PbO2 phase TiO2. According to the study of Breusov et al [23], it might be effective to fill the free spaces between the sample powders with a liquid to reduce the residual temperature. As Cowan et al [43] pointed out, it is crucial to mix low impedance precursor with high impedance cooling media to quench high pressure phases under shock waves. In our shock recovery experiment, the copper powder can act as a cooling medium [43, 44], because the temperature increase of copper would be much lower than that of TiO2 particles. For shock compression of anatase and copper powder mixture without the addition of paraffin (shot 373), the calculated average shock temperature and residual temperature are 1808 K and 1097 K, respectively, higher than 833 K (560 °C), the onset reverse transformation temperature for α-PbO2 phase TiO2 determined by thermal analysis. Due to the high residual temperature, α-PbO2 phase TiO2 formed during shock compression might convert to rutile TiO2, thus the yield of α-PbO2 phase TiO2 is not very high. When a small amount of paraffin is added (shots 1322 and 1324), the pores between the powder particles can be filled and paraffin can also act as lubricant, therefore the residual temperature can be significantly reduced to 468–472 K, which is much lower than the reverse transformation temperature of 560 °C (833 K) for α-PbO2 phase TiO2. This means the shock formed α-PbO2 phase TiO2 could be retained after unloading, leading to 100% yield of α-PbO2 phase TiO2 in shot 1322 and 1324. Due to the lack of corresponding data for anatase TiO2, the shock state in anatase TiO2 was calculated using the Hugoniot data of rutile TiO2. Then the shock temperature in anatase should be higher than the one of rutile due to the lower density of anatase. However, it is reasonable to believe the residual temperature in anatase was lower than 833 K by the cooling of surrounding copper.
For the rutile TiO2 precursor, the yield of α-PbO2 phase TiO2 did not reach 100% under similar shock conditions with anatase TiO2 precursor, which denotes that rutile TiO2 is more difficult to transform to α-PbO2 phase TiO2 than anatase TiO2 under shock compression. Li et al [45] also reported that the structure of the precursor would influence the onset phase transition pressure, and the onset transition pressure of rutile TiO2 to α-PbO2 phase TiO2 is higher than anatase. According to our high energy ball milling experiments, the anatase TiO2 precursor can partially transform to α-PbO2 phase TiO2 under dynamic loading induced by ball milling, however, no α-PbO2 phase TiO2 transformation was observed for the rutile TiO2 precursor under the same experimental conditions, which also demonstrates that rutile TiO2 is more difficult to transform to α-PbO2 phase TiO2 than anatase TiO2. The remaining approximately 10% content of rutile is assumed to be the original untransformed rutile TiO2 precursor considering the residual temperature is quite low. If the shock pressure can be further increased and the residual temperature can be delicately controlled, complete transformation of rutile TiO2 to α-PbO2 phase TiO2 can be achieved. This work is planned to be carried out in our future study.
4. Conclusions
The phase transformation behavior of anatase and rutile TiO2 with different particle sizes was investigated under shock compression. Paraffin was added to the mixture of titanium dioxide and copper powder to fill the pores among the particles to reduce the residual temperatures of the shocked samples after shock unloading. The XRD analysis indicate that all the samples recovered under shock compression undergo a phase transition to a certain extent. Both anatase and rutile TiO2 can undergo phase transformation to α-PbO2 phase TiO2 under shock compression. The transformation rate of α-PbO2 phase TiO2 for anatase TiO2 precursor can reach 100%, while the transformation rate for rutile TiO2 is about 90%. High resolution TEM examination and Raman spectra analysis also verify that pure α-PbO2 phase TiO2 was obtained. The yield of α-PbO2 phase TiO2 is largely affected by the structure of the starting TiO2 powder, and the anatase TiO2 powder is easier to transform to α-PbO2 phase TiO2 than rutile TiO2 powder. The influence of the particle size on the yield of α-PbO2 phase TiO2 is not obvious. High temperature XRD analysis together with TG-DSC examination suggest that α-PbO2 phase TiO2 is a thermally metastable phase, and can convert to rutile phase at temperature above 560 °C. The residual temperatures in the shocked powder samples is crucial for the preservation of the shock formed metastable α-PbO2 phase TiO2. Adding a small amount of paraffin to the powder mixture to reduce the porosity is proven to be effective to lower the residual temperature of the shocked powder and preserve the metastable α-PbO2 phase TiO2. The anatase and rutile TiO2 are assumed to convert to α-PbO2 phase directly under shock compression, and then α-PbO2 phase TiO2 may reverse transform to rutile phase, depending on the cooling rate and residual temperature after shock unloading.
Acknowledgment
This work was financially supported by the National Natural Science Foundation of China under Grants 11521062 and 10972039 and the Project of State Key Laboratory of Explosion Science and Technology, Beijing Institute of Technology under Grant ZDKT18-01.