
Abstract
Transient absorption and photoluminescence are experimentally investigated in the polaronic reference system lithium niobate, LiNbO (LN), with the aim to refine the microscopic model of small polaron dynamics in materials with strong electron–phonon coupling. As a unique feature, our study is performed by using two different spectroscopic methods, in crystals with dopants enhancing photorefraction or damage resistance, and over a broad temperature range from 15–400 K. Although being self-consistent for particular experimental conditions, the hitherto used microscopic polaronic models reveal inconsistencies when applied to this larger data set. We show that comprehensive modeling is unlocked by the inclusion of an additional type of polaronic state with the following characteristics: (i) strongly temperature- and dopant-dependent relaxation times, (ii) an absorption feature in the blue-green spectral range, and (iii) a Kohlrausch–Williams–Watts decay shape with a temperature-dependent stretching factor
  showing a behavior contrary to that of small, strong-coupling polarons. The hypothesis of self-trapped excitons (STEs, i.e. bound electron–hole pairs strongly coupled to Nb
 and O
and O within a niobium-oxygen octahedron) and their pinning on defects as the microscopic origin of these characteristics is supported by a spectroscopic linkage of photoluminescence at low (15 K) and elevated (300 K) temperatures and explains the long-lifetime components in transient absorption as due to pinned STEs.
Export citation and abstract BibTeX RIS

Original content from this work may be used under the terms of the Creative Commons Attribution 3.0 licence. Any further distribution of this work must maintain attribution to the author(s) and the title of the work, journal citation and DOI.
1. Introduction
The study of charge carrier dynamics with strong-coupling to the lattice, e.g. small polarons and self-trapped excitons (STEs) in lithium niobate, LiNbO (LN), triggered widespread attention even in nanosciences since the verification of their decisive role in the microscopic mechanisms of ferroelectric photovoltaics [1, 2], of THz wave damping [3] and laser-induced bulk damage mechanisms [4, 5], but also of photocatalysis in other oxide dielectrics like TiO
 , MgO, or ZnO [6–10]. LN is a ferroelectric oxide with excellent photoelectrical and (nonlinear) optical features, exhibits pronounced electron-/hole-phonon coupling, and hosts four different kinds of intrinsic small polarons [1, 4, 11, 12]: the free polaron Nb
 , the bound polaron Nb
 , the bipolaron Nb
 :Nb
:Nb , and the hole polaron
  . It should be noted that electrons bound to Fe
 [1, 13] or Ti
 [14, 15] may also be described in the framework of the strong-coupling-polaron picture. Luminescent STEs in LN are bound electron–hole pairs with strong coupling to Nb
 and O
and O within a single niobium-oxygen octahedron and reveal different optical properties depending whether the STEs form in stoichiometric materials or in niobium-oxygen octahedra near defect sites [16, 17]. Small polarons can be accessed by transient absorption spectroscopy (TAS) due to their characteristic, broad-band absorption features (for a rough overview of the absorption cross sections of the different polaron species see [18]), whereas time-resolved photoluminescence (TRPL) is applied for STEs, showing broad-band luminescence in the blue-green spectral range (see [11, 16, 19–23]).
To this date, carrier self-trapping and recombination in LN, i.e. polaron formation and decay, is described by microscopic models restricted to certain temperature ranges, stoichiometries and dopings of the particular study [16, 24–27], and appear consistent on their own, i.e. within the framework of given experimental boundary conditions and/or within the focus of a specific physical question. The restrictions of these models naturally contradict to the demand of a comprehensive microscopic model for pulse-induced transient absorption (TA) and luminescence in LN as reflected in detail by the following striking examples of our previous studies: (i) room temperature (RT) TA measurements of Conradi et al [24] in LN doped with Mg above the optical damage resistance threshold (ODRT) showed that neither a slow decay component at  nm nor the spectral form of the TA-signal can be explained by absorption features of hole and free polarons alone. (ii) Comparing the results of Herth et al [25] and Berben et al [26] who investigated the TA in Fe:LN in the blue-green spectral range and at
  nm, respectively, several inconsistencies regarding the stretching-factor
  obtained by fitting a Kohlrausch–Williams–Watts function (KWW) to the data can be found. For Fe
 polarons absorbing in the blue-green, Herth et al reveal
  values between
  , depending on the wavelength whereas Berben et al published
  at 785 nm for the decay of bound polarons under similar experimental conditions. This is in contrast with the claim of Herth et al, according to which the decrease of the near-infrared signal is due to a direct transition from Nb
 bound polarons to Fe
 . In this case, the increasing numbers of Fe
 polarons should be described by the same
  and
and  values as obtained from the bound polaron decay function.
Studies of STEs in LN, generated also by band-to-band excitation, refer to (TR)PL measurements [19, 21, 22], usually carried out at temperatures below 100 K. At elevated temperatures, in particular at RT, the luminescence signal becomes weak so that STEs have been disregarded in small polaron dynamics, so far. Using intense laser pulses and considering the complex formation paths in the temporal regime from electron–hole-pair generation up to small polaron formation [4], a considerable number density of STEs and their contribution to the transients can per se not be neglected. Only recently, Reichenbach et al showed that photoluminescence (PL) of unknown microscopic origin can be raised in LN by femtosecond pulse illumination at RT [28, 29].
Thus—despite the presence of a sound knowledge on the formation, transport and recombination of small polarons as well as on the luminescence properties of STEs—we need to accept that nearly nothing is known about the possible interplay of STEs with small polarons in LN in different temperature ranges. This interplay may occur at different stages during the various lifetimes of the individual quasi-particles. For instance small polaron and STE formation may be highly competitive in the ultrafast time range upon hot carrier excitation. On longer timescales, transformations of small polaron pairs to STEs may be discussed and may be decisive to explain the variety of optical phenomena being unexplained in TA experiments, so far.
The intention of this work is to fill this gap in knowledge by inspection of the possible role of self-trapped excitons in the polaronic recombination processes in LN in its very details. This topic inherently comprises a large degree of complexity: two different experimental techniques (TAS and PL) have to be applied, and the studies need to be performed with LN crystals with different doping below and above the photorefractive concentration threshold, over a large temperature range from about 15 K up to RT and on timescales up to minutes upon an incident pump event. Furthermore, it is challenging to uncover an appropriate experimental fingerprint to identify STEs within the polaronic recombination process. We address this complex task by stepwise answering the most obvious and driving questions, at first: (i) are STEs at the origin of PL in LN up to room temperature?, (ii) is there a justified need for a revision of the microscopic polaronic recombination processes?, and (iii) is there any experimental fingerprint pointing to a role of STEs in the polaronic recombination process? After (positively) answering these questions, we become able to focus our discussion on the development of a comprehensive picture for polaronic recombination including STEs and, finally, to tackle the revision of the existing microscopic model.
The paper is organized according to this concept: we first present steady state PL data over a large temperature range uncovering STEs as the microscopic origin of PL at RT (see question (i)). Then, TA data of Fe- and Mg-doped lithium niobate samples, again obtained over a large temperature and an extended wavelength range, indicate, beyond experimental incertitude, that the dynamics of TA in the red/near-infrared ( nm or
nm or  nm,
nm,  nm), and the blue (
 nm,
nm,  nm) spectral range cannot be correlated with each other for a number of experimental conditions in the framework of the current model proposed by Herth et al (see question (ii)). Finally TRPL and TA data in Mg:LN are presented and compared over a large temperature range demonstrating some distinct properties of the stretching factor
  of STEs deviating from the ones of small polarons, which is used to identify STE-related phenomena in the transient blue absorption in Fe:LN (see question (iii)). Based on these results, we discuss that STEs, and mainly pinned STEs (STEs bound to a defect), shall be considered in polaronic recombination. We present a revised comprehensive microscopic model, being an extension of the original Herth model [25]. It is capable to explain all inconsistencies in TA and TRPL measurements discussed, so far.
2. Experimental methods
Three experimental techniques were used in this study.
- (i)PL: Photoluminescence spectra under fs-exposure (regeneratively amplified Ti:Sapphire laser,
 fs, repetition rate 1 kHz; Coherent Inc., type Astrella) were obtained using a spectrograph with an air-cooled back-illuminated CCD-camera (Roper Scientific, type Isoplane and PIXIS-UV). The frequency doubled pump beam ( nm) with an energy of 40 J per pulse was slightly focused into the sample and the luminescent emission was collected over the duration of a whole second (averaging over 1000 pump events).
 - (ii)TAS: Transient absorption spectroscopy using a Q-switched, frequency doubled Nd:YAG pulse laser (Innolas, type Spitlight 600) at a center wavelength of nm (ordinary light polarization) with a pulse duration of ns and a maximum pulse energy of mJ. Pulse-induced changes of the absorption were detected by the dynamic transmission loss of continuous-wave probe lasers at wavelengths: nm, 488 nm, 785 nm, and 633 nm or 1310 nm (ordinary light polarization) via Si-PIN photodiodes and a fast digital storage oscilloscope (LeCroy, type Waverunner LT584). The recording took place in a time range from 30 ns after excitation up to the complete recovery of the sample (up to several tens of seconds). As shown by comparisons with as-grown crystals, effects of permanent photorefractive damage can be neglected for the given pulse parameters.
- (iii)TRPL: Time-resolved photoluminescence measurements were performed utilizing the above mentioned ns-pulse laser, but now in the frequency tripled configuration with a center wavelength of nm ( mJ, extraordinary polarization). A combination of a monochromator and a photon counter with a time resolution of 250 ns was used to detect the emitted luminescence in a direction perpendicularly to the pump pulse propagation. In both setups, the measurement was triggered by a diode detecting the scattered pump light and in the case of TRPL the signal to noise ratio was improved by averaging over a total of 1000 shots.In all setups, the sample temperature could be tuned in the range from 15 K to 400 K using a closed-cycle cryostat with optical windows.


Samples: Polished plates of thickness 1 mm of congruent lithium niobate, with the  -axis in the plane, with dopant concentrations of 0.1 mol% Fe or 6.5 mol% Mg in the melt were prepared by Czochralski growth at the University of Padova, and the WIGNER Research Centre for Physics Budapest by the high-temperature top-seeded solution growth method, respectively.
3. Are STE's at the origin of photoluminescence in LN up to room temperature?
The first question to be experimentally answered is whether STEs can be identified unambiguously at the origin of PL up to RT. The anchor for addressing this question is the low temperature luminescence spectrum that already has been attributed to the radiative decay of STEs, i.e. of electron–hole-pairs localized in a Nb–O-octahedron. By temperature-dependent measurements of the steady state PL signal in the temperature range from 15–300 K, we intend to gradually track the evolution of peak position and width of emission as the temperature changes. The results then allow for a clear assignment of the emission to STEs in the entire range. We note that the measurement series is performed with over-threshold Mg:LN (6.5 mol% Mg in the melt) where luminescence can be observed also at elevated temperatures.
Figure 1(a) shows the spectral fingerprints of the PL of Mg:LN in the temperature range from 15 K to 300 K for the particular case of an exposure to a train of fs-laser pulses with a center wavelength of 400 nm. The spectra, all normalized to their respective peak maxima, feature at 15 K a spectral width of 
 eV (FWHM) at a peak position of 2.82 eV. For the first time, clear evidence for a red-shift of the peak maximum by a total of about 0.2 eV upon heating to RT (see figure 1(b)), together with a spectral broadening to a bandwidth of
 eV (see figure 1(c)), is found. It should be noted that the total PL intensity decreases by several orders of magnitude at elevated temperatures.
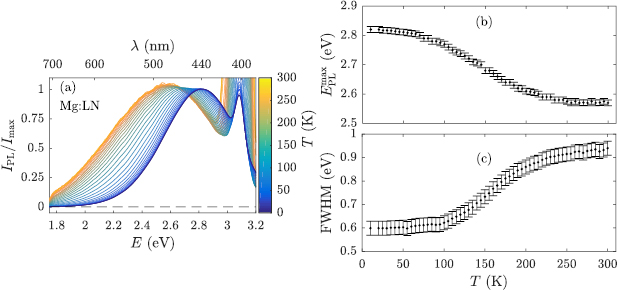
Figure 1. (a) Normalized temperature-dependent emission spectra of Mg:LN following exposure to a fs pump pulse at 400 nm. (b) Emission maximum and (c) full width at half maximum (FWHM) of the emitted luminescence as a function of temperature. A red-shift and a spectral broadening with increasing temperature can be observed.
Download figure:
Standard image High-resolution imageThe data are in good agreement with low temperature data published in the literature [16, 19–21], where the PL signal was mostly assigned to the recombination of STEs, and additionally confirm the results of Reichenbach et al [28, 29] about RT emission in Mg:LN. Up to  K the gradual shift of the luminescence peak maximum corresponds to the Varshni equation [30] expected for luminescence also in semiconductors [31], and can be understood, together with the observed broadening as the impact of phonon coupling on the electron–hole pairs bound in the STE [32]. At higher temperatures the flattening of the peak maximum's temperature dependence, accompanied by a decreased broadening rate, may indicate the gradual appearance of a second, weak, slightly blue-shifted luminescence signal reported by Kämpfe et al [19]. The authors attributed it to a recombination process similar to the one at low temperatures, only involving trapping centers at larger distances with respect to the formation area.
It is thus very reasonable to conclude, that (i) up to RT the PL signal must be assigned to the radiative decay of optically generated STEs, and (ii) STEs have to be present within the entire temperature range. The assignment of the luminescence to STEs generated at early stages of pumping is strongly supported by TAS results indicating much slower transport processes for charged electron polarons (up to minutes), compared to PL dynamics, both to be presented and discussed in the forthcoming sections.
4. Is there a justified need for a revision of the microscopic polaronic recombination processes?
Previous experimental studies on polaronic recombination by means of TA already revealed a few inconsistencies in the microscopic models for polaronic recombination that could not be resolved satisfactorily, so far. In particular, inconsistencies were uncovered if the experimental boundary conditions, such as doping concentration or wavelength of inspection were changed significantly (examples are given in the introduction). We here address the question, whether it is possible to clearly demonstrate the failure of the established models under certain experimental conditions. For this purpose, we use the temperature as main tuning parameter, but also extend the spectral range of optical inspection to the ultraviolet-blue spectral range. A particular feature of the previous microscopic models, a relaxation of electrons from Nb to Fe
to Fe , can specifically be inspected in the ultraviolet spectral range. Our results are finally capable to highlight the model failure by severe differences in the relaxation and rise times of the number densities of Nb
 and Fe
 , respectively, at temperatures below RT. The studies are performed (a) with Fe:LN (0.1 mol% Fe in the melt) in order to connect and compare our findings with the literature data, and (b) with over-threshold Mg:LN in order to foster the presence of STEs, but also to exclude that our findings may mainly be related to the presence of Fe
 .
.
4.1. Transient absorption experiments in Fe-doped lithium niobate
In figure 2(a), measurements of the transient absorption on the Fe:LN sample are shown at  K at the probing wavelengths 445 nm, 488 nm, 633 nm, and 785 nm. The first two are monitoring the nearly coinciding Fe
 and trapped hole absorption bands and the last one roughly corresponding to the maximum of the Nb
 band, all being strongly overlapping broad asymmetric features characteristic for polarons [18]. Following the incident pump pulse at
  s, a transient absorption appears in the near-infrared spectral range and vanishes almost completely in the microsecond range at RT. In the blue spectral range (445 nm and 488 nm), the transient absorption increases on a time scale up to several microseconds and vanishes to zero only after a few seconds.
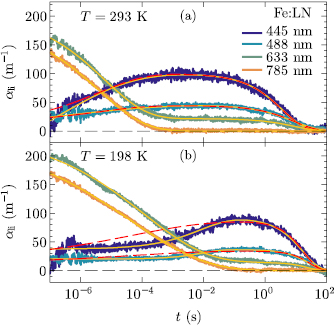
Figure 2. Temporal development of the transient absorption in Fe:LN at (a)  K and (b) 198 K (
 MW cm
MW cm ). The continuous yellow and dashed red lines represent fits of equation (1) to the data set. A two-term KWW-function (
 ) was used at wavelengths 445 nm, 488 nm, and 633 nm, whereas a one-term function (
 ) for
) for  nm. In the case of the continuous lines
  ,
,  , and
, and  were chosen as free parameters in the fitting procedure, whereas in the case of the dashed red lines the fixed values
  and
and  obtained in the red region were also used in the blue spectral range. The results are summarized in table 1.
Download figure:
Standard image High-resolution imageTable 1. Parameters of the KWW-function used to describe the TA of the 0.1 mol% Fe:LN sample at  K and 198 K exemplarily for the data set depicted in figure 2.
| 293 K | ||||||
|---|---|---|---|---|---|---|
| 445 nm | 488 nm | 633 nm | 785 nm | |||
 (m (m ) ) |
−72 ± 10 | −25 ± 5 | 184 ± 10 | 191 ± 10 | ||
 ( ( s) s) |
5 ± 3 | 2 ± 1 | 6 ± 2 | 4 ± 2 | ||
 |
0.39 ± 0.04 | 0.30 ± 0.03 | 0.32 ± 0.03 | 0.29 ± 0.03 | ||
 ( ( s) s) |
18 ± 16 | 19 ± 17 | 42 ± 30 | 43 ± 42 | ||
 (m (m ) ) |
99 ± 10 | 41 ± 5 | 21 ± 5 | — | ||
 (s) (s) |
4 ± 2 | 7 ± 4 | 9 ± 4 | — | ||
 |
0.61 ± 0.06 | 0.64 ± 0.06 | 0.62 ± 0.06 | — | ||
 (s) (s) |
5.9 ± 3.0 | 9.7 ± 6.0 | 13 ± 6.5 | — | ||
| 198 K | ||||||
| 445 nm | 488 nm | 633 nm | 785 nm | |||
 (m (m ) ) |
−41 ± 10 | −16 ± 5 | 227 ± 10 | 238 ± 10 | ||
 ( ( s) s) |
(20 ± 10) ⋅ 103 | (9 ± 4) ⋅ 103 | 121 ± 30 | 40 ± 10 | ||
 |
0.52 ± 0.05 | 0.69 ± 0.07 | 0.22 ± 0.02 | 0.18 ± 0.01 | ||
 ( ( s) s) |
(37 ± 3) ⋅ 103 | (12 ± 6) ⋅ 103 | (68 ± 62) ⋅ 103 | (13 ± 10) ⋅ 103 | ||
 (m (m ) ) |
82 ± 10 | 37 ± 5 | 14 ± 5 | — | ||
 (s) (s) |
20 ± 10 | 26 ± 10 | 25 ± 10 | — | ||
 |
0.9 ± 0.1 | 0.9 ± 0.1 | 0.8 ± 0.08 | — | ||
 (s) (s) |
21 ± 11 | 27 ± 11 | 28 ± 15 | — | ||
In comparison, at  K (figure 2(b)), the TA signals show clearly decelerated decay dynamics affecting much stronger the blue than the red spectral range, the maximum for 445 nm and 488 nm being preceded by an almost flat stage up to the millisecond time regime. The blue absorption signal vanishes to zero only after a duration of tens of seconds. This behavior suggests a pronounced time delay between the decaying red and increasing blue transients and can, in fact, be observed for various reduction and oxidation pre-treatments, i.e. for differently adjusted [Fe
 ]/[Fe
]/[Fe ] ratios between 0.01 and 0.19.
Previously, Berben et al [26] and Herth et al [25] reported that a sum of stretched-exponential functions (Kohlrausch–Williams–Watts function, KWW)
is a reasonable ansatz for the description of the temporal behavior of the transient absorption in Fe:LN. Accordingly, equation (1) has been fitted to the entire experimental data set as represented in figure 2 by the continuous yellow lines. For the absorption at 785 nm a single KWW-function is used to describe the data ( ), while
  is chosen for all other wavelengths. The obtained values of the fitting parameters providing a fair description of the results are presented in table 1 for both temperatures and all four probe wavelengths. The mean relaxation and build-up times for the various components defined by
are also included in table 1. Here,  denotes the gamma function. It should be noted that the error intervals for
  can be close to the order of the calculated value itself due to the combined error of
  and
and  . Still, the activation energies given in section 5 can be estimated very well, as we deal with different orders of magnitude of the decay time
  at different temperatures. Furthermore, a large number of separate measurements over a broad temperature range is available.
At RT, all transients seem to be in accordance with the model proposed by Herth et al [25]. In the red spectral range, the initial absorption change  is attributed to the formation of Nb
 bound electron polarons excited either from the valence band or Fe
 to the conduction band by a two-photon or one-photon process, respectively. The initial absorption change in the blue spectral range can be assumed to originate from various sources. There is a negative contribution, i.e. induced transparency due to the transformation of the Fe
 (part or all) into non-absorbing Fe
 centers [1, 18]. A positive contribution comes from valence band holes trapped next to Li vacancies as
  hole polarons together with a much smaller positive contribution coming from the overlapping absorption tail of the Nb
 bound electron polarons formed during the parallel electron trapping event.
According to the Herth model, the hopping motion of electron polarons may lead to the formation of stable or intermediate Fe centers, resulting in the decrease of red absorption and to the simultaneous appearance of the rising component in the blue on the microsecond timescale, which is in agreement with the coincidence of the values
  ,
,  and
and  measured at RT for different wavelengths simultaneously. Some of the Fe
 centers might be metastable (e.g. due to their specific charge compensation), whereby electron trapping and release at such iron centers could occur repeatedly while electrons recombine with all available pump-induced trapped-hole centers; this process could lead to a decrease of the blue absorption of both trapped holes and metastable Fe
 centers, contributing to some (rather) long TA component. This model neglects the formation of Nb
 electron polarons between possible repeated trapping events on iron which can be justified by Nb
 lifetimes shorter by several orders of magnitude than those of metastable Fe
 centers (a similar argument explains the neglect of Nb
 free polarons compared to Nb
 bound ones at faster stages).
In contrast, cooling the sample by 
 K (figure 2(b)) results in clear changes that are no longer consistent with Herth's model assuming the same
  and
and  for all probe wavelengths. In particular significant deviations appear in the first few milliseconds in this low temperature regime (dashed red lines in figure 2). The non-zero blue absorption remains remarkably constant during most of the Nb
 decay, prior to its rise to an interim maximum value. Adopting for
  and
and  the values
  and
and  obtained at 785 nm as fixed parameters, i.e. applying the Herth model, the data set cannot be reconstructed by a converging fit. The only way to reach a very good fit quality is by treating the
  and
and  parameters at various wavelengths as independent free parameters in the fitting procedures (see yellow lines in figure 2). The decay time in the near-infrared and the rise time in the blue deviate by a factor of 100 and only the mean relaxation/build-up times
  have approximately the same values. The bound polarons thus seem to disappear without having recombined simultaneously with holes or having promptly filled Fe
 traps, and reappear only later as Fe
 centers. This trend is already indicated for temperatures below
 K.
K.
The considerable displacement of the TA signal towards longer times and its changed shape at low temperatures have to be described by strongly increased  and
and  values in the blue (
 nm) compared to a moderately rising
  and decreasing
  in the red region. The increased stretching factor
  K
K in the blue has to be contrasted with its decreased value
  K
K in the red (table 1). The slow decreasing component shows an even larger
  value in the blue:
  198 K
198 K . The weakly defined mean values
  show much less variation which is also due to the fact that different combinations of
  and
and  can, by coincidence, lead to the same value of
  .
.
Taking into account the widely accepted interpretation of  [33–35] including the attempt of Merschjann et al [36] to relate
  and
and  directly to characteristic parameters of the hopping transport (time of a single hopping event, number of hopping events, etc), means that the blue transients have a much weaker dependence on hopping history before annihilation than the respective transients in the red. While the electron polaron decay for lower temperatures is increasingly characterized by slow hopping, the blue transients become nearly mono-exponential.
These data point to a clear failure of the Herth model and support the previous reports on inconsistencies in Fe:LN crystals under rather different conditions. In particular at low temperatures and with probing wavelengths in the blue and near-infrared spectrum, we are faced by two striking experimental observations: (i) the decay of bound polaron absorption in the near-infrared is not correlated with the increase of the Fe absorption anymore, and (ii) there is a strong discrepancy of the determined
  value with the state-of-the-art knowledge for small, strong-coupling polaron dynamics in LN [26, 35, 37] to be further discussed in section 5. At the same time, these data are not sufficient to conclude a general failure of the Herth model, i.e. that Herths' model also fails for the description of TA in LN crystals of different stoichiometry and/or with/without different dopants (including non-photorefractive defect centers). In what follows, we intend to exclude that the failure is solely related to the dominating existence of Fe
 by means of equivalent TAS studies with over-threshold Mg:LN.
4.2. Transient absorption experiments in Mg-doped lithium niobate
The dynamics of the transient absorption in Mg:LN at 445 nm, 488 nm, 785 nm, and 1310 nm at RT (the latter approximately centered on the broad absorption band of Nb free polarons) is depicted in figure 3, showing, in addition to a fast decreasing transient on the same time scale for all wavelengths, a long-lived transient blue absorption as previously reported by Conradi et al [24]. However, in comparison to former studies a new probe at 445 nm was applied and we were able to observe an unexpected feature, i.e. a clear increase in the absorption at surprisingly long timescales. The newly measured transient local maximum for 445 nm is observed after a significant period (few milliseconds) of constant absorption that resembles the dominant feature of the low-temperature TA dynamics of Fe:LN. This corresponds to a small rising component (denoted by the index 1b) with a time constant
  ms. The fitting parameters derived for all KWW components in Mg:LN are summarized in table 2, essentially coinciding at RT with those reported in [24]. The fast component on the microsecond timescale (denoted by the index 1a) is decreasing in the blue region at variance from the case of Fe:LN. The slow component extends to hundreds of seconds in the visible and is absent in the infrared as in Fe:LN.
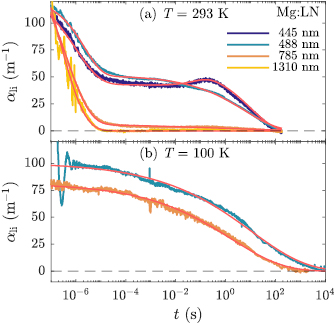
Figure 3. Temporal development of the light-induced absorption in Mg:LN at (a)  K and (b)
  K for a pump pulse intensity of
  MW cm
MW cm . The red lines represent fits of equation (1) to the experimental data. Fitting results are summarized in table 2.
Download figure:
Standard image High-resolution imageTable 2. Parameters of the KWW-function used to describe the TA of the 6.5 mol% Mg:LN sample at  K and
K and  K (figure 3).
| 293 K | 100 K | |||||||||||||||||
|---|---|---|---|---|---|---|---|---|---|---|---|---|---|---|---|---|---|---|
| 445 nm | 488 nm | 785 nm | 1310 nm | 488 nm | 785 nm | |||||||||||||
 (m (m ) ) |
90 |  |
10 | 71 |  |
10 | 177 |  |
10 | 248 |  |
20 | 100 |  |
5 | 81 |  |
10 |
 ( ( s) s) |
1.0 |  |
0.2 | 2.3 |  |
0.5 | 0.4 |  |
0.1 | 0.2 |  |
0.1 | (10 |  |
5)  |
(1.7 |  |
1)  |
 |
0.45 |  |
0.1 | 0.62 |  |
0.1 | 0.44 |  |
0.1 | 0.45 |  |
0.1 | 0.19 |  |
0.01 | 0.19 |  |
0.01 |
 ( ( s) s) |
2.5 |  |
1.5 | 3.3 |  |
1.1 | 1.0 |  |
0.6 | 0.5 |  |
0.3 | (1890 |  |
1200)  |
(321 |  |
200)  |
 (m (m ) ) |
 |
 |
5 | — | — | — | — | — | ||||||||||
 (ms) (ms) |
70 |  |
20 | — | — | — | — | — | ||||||||||
 |
0.8 |  |
0.2 | — | — | — | — | — | ||||||||||
 (ms) (ms) |
79 |  |
40 | — | — | — | — | — | ||||||||||
 (m (m ) ) |
58 |  |
10 | 51 |  |
5 | 6 |  |
2 | — | — | — | ||||||
 (s) (s) |
10 |  |
3 | 6 |  |
2 | 5 |  |
3 | — | — | — | ||||||
 |
0.45 |  |
0.05 | 0.32 |  |
0.04 | 0.25 |  |
0.1 | — | — | — | ||||||
 (s) (s) |
25 |  |
10 | 42 |  |
24 | 120 |  |
110 | — | — | — | ||||||
The dynamics in Mg:LN at RT should be compared to scenarios in Fe:LN taking into account the changed defect structure of Mg:LN: (i) Nb antisites and most Fe
 centers are missing as indicated by the vanishing photorefractive effect in over-threshold crystals [38], (ii) a portion of Mg
 dopant ions and some of the background Fe impurities on the ppm level are incorporated on Nb sites [39, 40], where their charge state remains fixed.
The lack of Nb antisites results in an increase of the electron polaron hopping frequency, now occurring in the regular Nb sublattice, leading to a shortening of
  by nearly an order of magnitude, compared to Fe:LN, so that
  nm, RT
 s. Accordingly, there are even longer delays (compared to Fe:LN) between this fast decay of free polarons and the slower components in the blue. Due to the small number of Fe
 centers, a significant influence on the TA can be excluded as supported also by the monotonous decrease of the 488 nm TA signal in the entire observed temporal region. Only the small rising component
  at 445 nm extending into the 70 ms range has to be attributed to background Fe impurities, based on the analogy with component
  in Fe:LN. The fast blue TA component in Mg:LN, temporarily locked with polaron decay monitored in the near-infrared, can be attributed to a direct process of polaron recombination with trapped-hole centers. For
  K, TA signals in Mg:LN extend to several minutes both in the near-infrared and the blue region due to the slow hopping of polarons and delays in the recombination processes. Therefore, the three KWW-components in the blue spectral range cannot be satisfactorily distinguished anymore due to similar decay times of several overlapping TA components. A single-component fit at
  K and
K and  nm yields
  s and
s and  , and therefore
  s. The latter is much longer in comparison to the value determined in the near-infrared, thus indicating the presence of the RT processes at low temperatures, as well. The values obtained for 785 nm and 488 nm are summarized in table 2.
Apart from the latter process, the RT TA-data in Mg:LN thus clearly resemble the findings in Fe:LN, and further stress the failure of the original microscopic model for polaronic recombination. Similarly to the case of Fe:LN the model cannot be corrected by simply considering some process of more complex type but involving only single-electron transfers. Instead, a more complex electronic center, the STE, having clear fingerprints for its identification, will be discussed in more detail below.
5. Is there any experimental fingerprint pointing to a role of STE's in the polaronic recombination process?
The PL spectra presented in section 3 clearly indicate the presence of STEs over the temperature range 15–300 K suggesting that STEs should not be neglected in non-radiative recombination processes either. In order to find the various transient manifestations of STEs, in this section temperature-dependent TRPL measurements are presented and combined with corresponding TA results. The temperature dependence of the stretching coefficient  will be shown to be an unambiguous fingerprint for a clear separation between STE-related phenomena on the one hand and processes determined by the hopping of electron polarons on the other hand. This distinction is also supported by the different Arrhenius-type activation energies obtained from the respective time constants. First we use Mg:LN in order to benefit from the comparison with the characteristic blue PL feature, then turn to the peculiarities offered by Fe:LN.
5.1. Stretching-factors and activation energies in the photoluminescence and transient absorption of Mg:LN
Figure 4(a) shows the TRPL of Mg:LN upon ns-pulse exposure at 355 nm ( GW m
GW m , extraordinary polarization) for the emission wavelength of 460 nm for a series of temperatures in the broad range from 15 K to 200 K in a semi-logarithmic plot. For comparison, all data have been normalized to the maximum luminescence signal at
  s. With increasing temperature the luminescence decay time is found to decrease from the milli- to the microsecond time range as expected from the studies of Powell and Freed, and Fischer et al [21, 23]. For a quantitative analysis, and according to Zatryb et al [41], the evolution rate of excited emitters has to be considered, so that the first time derivative of the stretched-exponential KWW function is used for the fitting procedure:
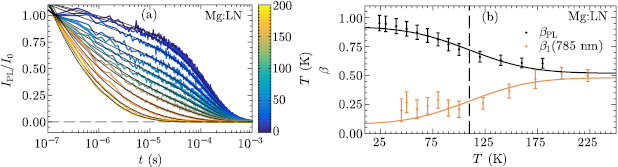
Figure 4. (a) Temporal decay of the PL intensity at 460 nm Mg:LN following exposure to a single ns laser pulse for temperatures given by the color code. The signal is normalized to the value determined at  s; the black lines represent fits to the experimental data using equation (3). (b) Temperature dependence of the stretching-factors:
  (black) obtained from fitting equation (3) to the luminescence decay data and
  (orange) obtained from fitting equation (1) to TA results in Mg:LN. The solid lines are phenomenological descriptions of the
  behavior with an error-function. The dashed line represents a common inflection point at
  K.
K.
Download figure:
Standard image High-resolution imageAs shown by the black lines in figure 4(a), very good correspondence could be achieved between equation (3) and the experimental data using only a single KWW component with two independent fitting parameters, the stretching coefficient  and the decay time
  , giving further support to the unambiguous (STE-related) origin of the PL observed. The dependence
  depicted in figure 4(b) is in full accordance with a trend recently recognized in a smaller temperature interval by Kämpfe et al [19]. The change of
  is very significant and represents a transition from unity for a mono-exponential function at
  K to the stretched case
  at
at  K (see figure 4(b)). The decay time
  remains nearly constant for temperatures below 100 K with a value of
  s whereas an Arrhenius-like behavior with an activation energy
  eV is found for
  .
.
We interpret both findings by assuming that at low  the decay time of the luminescence is defined by a localized process where hopping is suppressed leading to a single exponential decay
  . As the temperature is increased above 100 K, the steep decrease of both
  and the stretching exponent
  suggests that a hopping process becomes dominant. To explain the extremely low activation energy for luminescence decay, we assume that hopping of the STE as a whole is involved. In comparison, for free polaron hopping a clearly larger activation energy
  eV can be derived from the observed temperature dependence of the mean relaxation time
  which also follows an Arrhenius behavior for
  K in our Mg:LN sample; practically the same value has been estimated earlier as one fourth of the optical excitation energy
  1 eV of Nb
 [12, 42]. Accordingly the temperature dependence of
  has to be attributed to the hopping of STEs and their subsequent localized recombination.
Comparing  with TA measurements of
  on Mg:LN displaying the behavior expected for polaron hopping (see figure 4(b)), it is immediately clear that
  exhibits a reversed temperature dependence. We chose
  nm as a probe wavelength where the largest contribution, in the absence of antisites, can be attributed to Nb
 free polarons. Both types (TRPL and TA) of temperature behavior in figure 4(b) can be described phenomenologically, e.g. by an error-function with a common inflection point at
  K indicating the temperature where the processes due to hopping become dominant. Thus, the given reverse type of
  dependence, can be regarded as a fingerprint of STEs, in contrast to the
  behavior observed for small electron polarons; this is supported by the fact that the activation energies obtained for luminescence and red/near-infrared absorption decay are different requiring a second hopping entity, STEs. Note, that even though the transients in luminescence and absorption are on different timescales, a comparison between the
  behaviors may be justified as the stretching-factor is a good indicator for the type of transport and annihilation processes involved.
5.2. Stretching-factors and activation energies in the transient absorption of Fe:LN
In this section detailed temperature-dependent measurements of the red and blue TA on Fe:LN are presented with the goal to uncover similar fingerprints. The obtained behavior of the various stretching-factors  is shown in figure 5. Results in the red and blue spectral range differ in two major points: (i) with decreasing temperatures
  is observed to decrease in the red spectral range, compared to the opposite behavior of both
  and
and  in the blue (see figure 5, but also table 1). Both types of temperature behavior in figure 5, again, can be described by an error-function (orange and blue lines in figure 5) where
  K is discovered as a common inflection point. (ii) At higher temperatures, the mean decay times
  follow an Arrhenius behavior, however, for temperatures
  the mean decay times in the blue range become nearly temperature-independent. The obtained activation energy
  apparently corresponds to polaron hopping in the presence of antisites (to be compared to one fourth of the optical excitation energy
  1.6 eV of Nb
 [12]). It should be added that the most recent value of the polaron stabilization energy was determined to
  eV [37]. The activation energies derived for the blue region,
  and
and  are correspondingly higher and will be discussed in section 6.
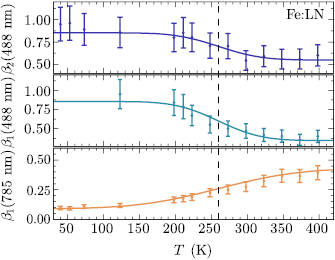
Figure 5. Temperature dependence of the stretching-factors  ,
,  , and
, and  in Fe:LN. The solid lines are qualitative descriptions of the
  behavior with an error-function. The dashed line represents a common inflection point at
  K.
K.
Download figure:
Standard image High-resolution imageThe temperature dependence of the stretching exponents  and
and  in the blue of the TA of Fe:LN (figure 5) qualitatively shows the same fingerprint behavior as
  obtained from time-resolved luminescence measurements on Mg:LN (figure 4(b)). The similar dynamics of the considered blue transients in emission and absorption strongly suggests their common origin, namely STEs. In Mg:LN the temperature
  K equally characterizes the onset of polaronic and excitonic hopping processes observed in transient absorption and luminescence decay, respectively. In Fe:LN, the
  K value reflects the smaller mobility of the polarons and a parallel change in electron–phonon coupling due to the presence of antisite Nb defects, as compared to Mg:LN where antisites are absent. These findings will be used in the following section to reconsider the microscopic polaronic recombination model in LN.
6. Extension of the microscopic model by STE's and pinned STE's
So far, our analysis was able to answer the most striking questions related to the role of STEs in the polaronic recombination processes in LN. First, it is clearly demonstrated, that the observed, pulse-induced blue-green luminescence in LN can be attributed to the decay of STEs up to RT. Second, the failure of the microscopic model comprising solely small electron and hole polarons is highlighted and evident as soon as the temperature is reduced or the doping is changed. Third, the stretching factors and activation energies are recognized to yield sensitive information on the dynamics of both PL and TA indicating the presence of STEs.
As a result, it becomes necessary to extend the microscopic picture by including the additional electronic states of STEs and STEs pinned on defects, as schematically depicted in figure 6. As a matter of fact, such pinned STEs (i) may be long-lived, (ii) should absorb in the blue spectral range, and (iii) decay preferably non-radiatively and, thus, considerably contribute to the blue TA in LN crystals. We like to note that the alternative consideration of an interim formation of bipolarons, that are strongly absorbing in the blue region (see e.g. [11, 18]), would not explain the delayed appearance of the blue component in Fe:LN. The same holds for Mg:LN due to the lack of antisites. We will thus disregard the presence of bipolarons in our model approach, though it may be included if thermally reduced LN is considered.

Figure 6. Excitation and recombination model after pulse exposure (green thick arrows) in LN. Hot electron–hole pairs created by the pump pulse in a two-photon process either recombine directly (1), form STEs within NbO octahedra (2), or dissociate to form separate oppositely charged small polarons (3), as a further option, electrons from Fe
 may be excited to form additional small polarons leaving back Fe
 (4). The recombination paths are divided into a polaron and an exciton branch, for more detail see text.
Download figure:
Standard image High-resolution imageAs seen on the left-hand side of figure 6, the starting situation can be summarized as follows: immediately (on the ps scale) after the pump pulse, a given concentration of free or bound electron polarons and holes is created, together with a certain amount of emptied Fe traps [4, 42]. Small electron polarons forming the polaron branch (upper right-hand part of figure 6) move through the lattice by thermally activated hopping [43, 44] which terminates in deep traps like Fe
 converting to Fe
 or they annihilate with trapped holes. However, depending on conditions of temperature and composition, a considerable concentration of STEs, disregarded in earlier TA studies, may be present as well, as indicated by luminescence. Since this radiative recombination is observed to be orders of magnitude faster than the small polaron decay time measured by TA (see our measurements), we can assume that it stems from STEs formed directly after light exposure forming a second relaxation channel parallel to the polaron recombination. Besides the possibility to recombine radiatively, the STE is the starting point of a pinned-STE branch (lower right-hand part of figure 6) which will be described in more detail in the following.
6.1. (Pinned) STEs in LN
STEs may be assumed to have a significant hopping mobility as confirmed by the presence of a thermally activated process ( eV) of the luminescence decay. At higher temperatures and in defective materials, STEs formed at early stages of pumping are expected to get pinned on defects, similarly to the formation and trapping of single-site small polarons. Resonant excitonic/energy transfer can be discarded due to the large Stokes shifts. In particular, STEs may be captured, among others, by the same defects as free holes (e.g. by lithium vacancies or Mg
 defects). The final recombination site should play a decisive role, especially at lower temperatures, when localization sets in and
  gets nearly temperature-independent. The exact optical properties depend on the presence and type of defects adjacent to the niobium-oxygen octahedron containing the STE as shown by luminescence studies in LN with various stoichiometric compositions [16] including also crystals with ilmenite type cationic stacking order [17]. While the presence of Mg up to the
  5 mol% threshold, i.e. the elimination of antisites, leads to increased emission [21], Fe doping seems to lead to luminescence quenching comparable to the case of Cr doping [23], indicating that both intrinsic defects and Fe form pinning centers for STEs where luminescence is suppressed. Non-radiative decay should be strongly preferred for STEs pinned on defects with high pinning/stabilizing energies leading to the longer absorption decay times and higher activation energies as observed for TA in the blue. In this case, the decreasing
  function characterizes the temperature dependent pinning history of the STE influencing its decay. The existence of a second, slow component, with activation energies slightly larger than in our case (0.14 eV and 0.11 eV) valid above somewhat higher temperatures 140 K and 160 K for the respective luminescence components, obtained in 7.5 mol% Mg-doped samples by Kämpfe et al [19], may then be attributed to minor deviations from the crystal structure optimal for luminescence. It should be noted that pinned STEs might also be formed as interim states during the recombination of electron polarons with trapped-hole centers.
6.2. Absorption properties of (pinned) STEs
STEs, which have been established in various materials, e.g. alkali halides, beside their capability to decay radiatively, have absorption bands similar to those of small polarons as demonstrated by Williams et al [5, 45]. As pointed out by these authors, the hole and electron, which a STE consists of, can be excited optically and show a near ultraviolet and a near-infrared absorption, respectively, corresponding to optically triggered jumps of the respective constituent to equivalent neighboring sites. In LN, due to the transfer of the hole constituent to an equivalent or non-equivalent neighboring oxygen site, STEs are also expected to have an absorption in the blue/near-ultraviolet region. However, a separate contribution of the radiatively decaying STEs to the TA at the measured wavelengths was not observed even in Mg:LN at low temperatures although the luminescence and TA decay times deviate by a factor of at least 1000 from each other and a TA of such STEs—if present—should have been clearly visible. Furthermore, to the best of our knowledge, evidence for the presence of excitonic infrared/ultraviolet absorption in LN is not reported in literature, so far.
Concerning the absorption properties of pinned STEs, we have no experimental indication for the presence of a near-infrared absorption. The 'quenching' of infrared-absorption may be understood by taking into account proposed dynamic or static models of trapped hole O− centers containing a unique Nb neighbor in a strongly preferred position for electron trapping [46, 47]. In such cases electron hopping may be hampered or requires much higher energy. The blue/ultraviolet absorption of pinned STEs, though present, might be nearly indistinguishable from the absorption of an O− trapped hole.
6.3. Two-step recombination model of STEs pinned on Fe centers

STEs should also be capable to get pinned on iron centers. Most Fe centers in LN may be assumed to have a nearest neighbor charge-compensating lithium vacancy (V
 ) suggesting the following scenario: the constituents of a nearby STE are attracted by the constituents of the Fe
 dipole leading to an STE pinned on Fe
 with the Nb
 and O− sites at nearest neighbor positions of the Fe
 and
and  sites, respectively. A single jump of the electron from Nb
 to the Fe site (along the
  axis) transfers the complex into a new state, which is a coupled Fe
 defect. Both Fe
 and the hole constituent absorb in the blue, their aggregate causing a net increase of the total blue TA with respect to the pinned STE absorption, thus providing a rising TA component. However, this new defect state again has a metastable excitonic character and tends to recombine, restoring the original Fe
 defect having no absorption at all. Thus we consider a strongly localized two-step STE recombination process where the electron constituent, starting from a Nb
 state, proceeds to a lower Fe
 level before rejoining its O− partner. Since both the pinned STE and the intermediary Fe
 complex can be assumed to have metastable ground states with differently relaxed lattice environments, both jumps have to be phonon-induced/assisted, and may involve significant, separate temperature dependent time delays. This two-step STE recombination path, leading to an interim TA maximum with a subsequent steep decay clearly explains the most conspicuous features of the TA at 445 nm, while it seems to be much less pronounced at 488 nm. As the second jump seems to take significantly longer than the first, a description in terms of two separate KWW-functions has to be a good approximation.
The derived activation energies support the two-step relaxation model of the STE pinned on Fe yielding
  eV for the first and a larger
  eV for the second step, the latter corresponding to the decay of the strongly distorted Fe
 - state, and roughly equaling one fourth of the strong absorption measured at 445 nm (2.79 eV). A similar ratio may hold for the STE pinned on Fe
 in the first step as well, confirming
  /4 as the activation energy characterizing the hopping of a polaron from a given site to an adjacent one [12]. Negligible differences between 488 nm and 445 nm data (
 ,
,  ) in Fe:LN indicate small superpositions from other recombination centers not containing Fe.
At low temperatures the proposed two-step relaxation of the STE pinned on Fe clearly dominates the 445 nm TA spectrum in Fe:LN for
  ms (see figure 2(b)). While these two steps seem to explain both the rising and decreasing 445 nm components in Fe:LN, an important contribution to the long decreasing component in Mg:LN may come from STEs pinned on hole-trap defects like (V
 )-pinned STEs. Contributions from such pinned STEs correspond to centers with observed lifetimes in the minute range and have been attributed to O− -type centers in 5 mol% Mg-doped LN by Xin et al [40]. In fact, our probe wavelengths are in the central part of the O− and on the very wing of a TA band attributed to O− (Mg
 ) centers in [40].
Accordingly the first-step lifetime of the (Fe )-pinned STE state recombination may correspond to the lifetimes of the rising components
  and
and  observed at 445 nm in Fe:LN at low temperatures and in Mg:LN at RT, respectively. In contrast, much longer second-step lifetime may correspond to
  of the long decreasing component at 445 nm in Fe:LN. The separation of time domains of polaron and pinned-STE decay is rather large in Mg:LN (figure 3). However, there may be a considerable overlap in Fe:LN at RT which resulted in the earlier misinterpretation of the blue TA components discussed above.
7. Summary and conclusion
In this paper the question is answered whether STEs play a role in polaronic recombination processes in LN. In a first step it was shown that STEs can be optically generated in Mg:LN in the whole temperature range from 15–300 K. In particular, our data, collected for the first time continuously up to 300 K, demonstrate that the PL signal can clearly be assigned to similar STEs in the entire temperature range.
In the next step shortcomings of earlier microscopic polaronic recombination models were demonstrated. Transient absorption measurements in an extended temperature and spectral range on Fe:LN and Mg:LN reveal inconsistencies when Herth's model is applied on these new data sets: (i) the decay of bound polarons absorbing in the near-infrared is not correlated with the increase of blue absorption, (ii) the fact that the  coefficient in the blue spectral range is larger for lower temperatures is in contrast to the state-of-the-art knowledge for small, strong-coupling polaron dynamics in LN.
Third, the temperature-dependent TA was compared with the corresponding TRPL data to check whether features in TA could also be attributed to STEs. The striking increase of the stretching factor  with decreasing temperature attributed to STEs in TRPL, but present also in TA in the blue spectral range, was found to be such a fingerprint. In fact, this is in contrast to the usual
  behavior which is expected for small polarons in LN.
Based on these results, we propose and discuss for the first time an excitation and recombination model by including a STE branch in addition to the established polaron recombination branch. Both together are capable to describe in a comprehensive model TA and PL over a broad temperature-range. Here, STEs and pinned STEs formed during or immediately after pumping were found to be important transporters of negative charges towards deep Fe traps. The presence of long-lived perturbed O− centers containing an adjacent lithium vacancy in their clusters have to be assumed in both LN systems, while a second distinct group of STE hosts can be attributed to doping (Mg
 or Fe
or Fe ). The varying accessibility of these centers and/or the different stability of the corresponding pinned STEs can be ascribed to different clustering with intrinsic and extrinsic defects, taking into account that clustering not only results in various levels of charge compensation but may also result in different restrictions for polaron and exciton hopping. However, further investigations are required regarding the absorption of the emitting STEs on even shorter timescales and the type of centers at which pinned STEs are formed. We further assume that the concept of both the polaron and (pinned) STE branch in LN could also be transferred to other materials with perovskite structure such as KNbO
 , LiTaO
 , etc, since all these materials may host similar kinds of defects. Furthermore, we expect that our approach may also serve as a basis for new models and insights to describe related phenomena such as photocatalysis in TiO
 , MgO and/or ZnO.
Acknowledgments
The authors are indebted to O F Schirmer and T Nörenberg for fruitful discussions as well as L Kovács and coworkers at the Wigner Research Centre for Physics, Budapest, for crystals and crystal preparation. Financial support from the Deutsche Forschungsgemeinschaft (DFG) via projects IM37/5-2, IM37/11-1, INST 190/137-1 FUGG and INST 190/165-1 FUGG is kindly acknowledged.