


Abstract
The /EC decay of Tl to excited states in the daughter nuclei Hg has been investigated at the CERN on-line isotope mass separator facility. In both Tl nuclei two β-decaying states were observed. In the case of 184Tl, narrow-band laser spectroscopy could be used to disentangle the decay of both isomers. In 182Hg a precise energy of 335 (1) keV for the state was measured together with its feeding from a tentatively proposed state at 973 keV. Large conversion coefficients for the transition in Hg were measured to be 7.2 (13) and 14.2 (36), respectively, evidencing a strong E0 component.


Content from this work may be used under the terms of the Creative Commons Attribution 3.0 licence. Any further distribution of this work must maintain attribution to the author(s) and the title of the work, journal citation and DOI.
1. Introduction
The region of neutron-deficient nuclei in the vicinity of the proton shell-gap at Z = 82 and neutron mid-shell at N = 104 exhibits conceivably the most extensive manifestation of shape coexistence, whereby a nucleus shows two (or more) distinct types of deformation at low energy. The coexistence of different deformations in the neutron-deficient mercury isotopes has been well established by using several techniques: from optical pumping and laser spectroscopy, to in-beam and decay spectroscopy. For a recent survey on the experimental data and the progress in the theoretical description we recommend [1]. However, in order to fully characterize in the Mercury nuclei the underlying link between collective features and their microscopic origin it is necessary to complete the experimental information on the yrast and non-yrast states with not only energies, but also branching rates, life times, static and transitional moments. Recent experiments, such as Coulomb excitation of radioactive Hg isotopes [2], lifetime measurements [3, 4], Tl β-decay studies [5] and laser-spectroscopy studies [6] are pursuing these goals.
In the case of even–even nuclei, shape coexistence manifests itself through the occurrence of 0+ states, with distinctive bands built on top of them. In the even-A neutron-deficient mercury isotopes the states associated with a weakly deformed, presumably oblate, ground state () show an almost constant excitation behavior as a function of the neutron number while a parabolic intrusion of strongly deformed states associated with a presumably prolate band () is observed, see figure 1 in [5]. A recent Coulomb-excitation study of even-A Hg fixes the oblate character of their ground state and establishes a larger deformation for the excited 0+ state [2], while recent in-source laser-spectroscopy studies on the even Hg nuclei [6] extend the trend of a weakly deformed ground state down to 178Hg.


In an α-decay study of 186Bi [7], two long-living states were identified in 182Tl: one fed in the decay of the 9.8 ms 186m1Bi and other fed in the decay of the 14.8 ms 186m2Bi. The relative positions of the isomers in 186Bi and 182Tl could not be obtained and no spin and parity suggestions were given. A β-decay study of 182Tl performed at ISOLDE [8] showed the population of the 8+ state in 182Hg suggesting spin I = (7) for the β-decaying state of 182Tl. The half-life was measured to be 3.1(10) s. Next to β decay, 182Tl has also a weak α-decay branch [9] having an half-life of 2.8(6) s [10]. In our α-decay study [11] a more precise half-life of 1.9(1) s was obtained together with a lower limit of 0.49% for the α-branching ratio. In our laser spectroscopy study [12] a spin I = (4) was tentatively assigned to the 1.9 s α- and β-decaying state. In the same study a spin I = (7) was confirmed for the second β-decaying state.
In earlier studies on 184Tl, α as well as β decay has been observed with a respective half-life of 10(2) s [13] and 11(1) s [14]. The β-decay study showed feeding up to the 8+ level in 184Hg suggesting a spin I = (7+) for the β-decaying state but also strong β feeding was observed to the first 2+ state suggesting the existence of two β-decaying states with a similar half-life. In a further α-decay study of 188Bi [15], three long-living states were identified in 184Tl having as possible spin: (10−), (7+) and (2−). In our internal-decay study of the (10−) state in 184Tl [16], a half-life of 47.1(7) ms was measured together with a 506.1(1) keV excitation energy above the (7+) isomer. In our α-decay study [11], α-decay branching ratios of 0.089(19)%, 0.047(6)% and 1.22(30)% have been deduced for the (10−), (7+) and (2−) states, respectively. A new half-life of 9.5(2) s was measured for the (2−) state.
In this paper, which results from an extensive experimental program on neutron deficient Tl nuclei at ISOLDE, CERN, we report on the β-decay of Tl in which on-line mass separation is combined with resonant laser ionization (LI) to produce pure sources of Tl. This completes our decay study of these nuclei where the α- and internal-decay parts have already been published [11, 16]. Also narrow-band lasers were used to probe the hyperfine splitting of the atomic states. These laser-spectroscopy studies will be published elsewhere [12] but in the case of 184Tl the narrow-band laser approach was used to enhance the production of the higher-spin isomers. The β decay of the involved isotopes and isomers feeds levels in Hg which are characterized through β–γ, e–γ and γ–γ coincidence studies.


2. Experimental setup
The two experiments (IS466 for 182Tl and IS511 for 184Tl) were performed at CERN-ISOLDE and are part of a systematic α-, β-, β-delayed fission and laser spectroscopy study of neutron-deficient thallium isotopes. In both experiments, the Tl radioactive ions were produced in a 1.4 GeV proton-induced spallation of a 50 g cm−2 UCx target followed by surface and resonant LI [17] in a similar way as used for the study of 180Tl reported in [5]. The ions were subsequently extracted from the ion source, accelerated to 50 keV and separated according to their mass-to-charge ratio with the general pourpose separator. As a result, a high-purity beam of 182Tl or 184Tl was obtained. The typical intensity of the Tl beams at the detection setup was in the order of 104 pps. The intensity of 184Tl was reduced in order to avoid saturating the data acquisition system.


The experimental setup and data acquisition system were identical for the two experiments. They are also described in [11, 16]. The thallium beam was implanted on one of ten carbon foils, 20 μg cm−2 thick, set on a rotatable wheel inside a vacuum chamber. By rotating the wheel every 40–50 s, the irradiated foil was moved to the decay position and the next foil moved to the implantation position. Two silicon detectors were placed in close geometry at the implantation point, as shown in figure 1 in [18], covering a solid angle of 24% of 4π. An annular detector (Si1) having an active area of 450 mm2 and thickness 300 μm, placed upstream the foil, has a central hole of 8 mm so that the ion beam was passing through this hole before being implanted into the foil. A circular detector (Si2) of active area 300 mm2 and thickness 300 μm was placed behind the foil. Two extra circular Si detectors, 300 μm thick and 300 mm2, were placed at the decay position.
The Si detectors were used for the detection of electrons, positrons, and α-rays. In this article we concentrate on positrons and conversion electrons. Due to the limited thickness, the Si detectors mainly acted as ΔE detectors for the electrons and positrons yielding a ΔE peak around (see the red curve in figure 1). However for conversion electrons in the energy range between 200 and 500 keV, the full energy could be observed (see figure 1). The full-energy detection efficiency of Si2 was determined by using the known 375 keV (0+2 0+1) E0 transition in 184Tl [14]. In figure 1(b) the K and L electrons of this E0 are shown through a coincidence with the feeding 608 keV transition. This yields an efficiency of 7.6(16)% at 292 keV and 7.2(17)% at 360 keV. The red ΔE curve in figure 1 is deduced from the Si spectra in coincidence with the 511 keV γ ray from the positron annihilation. Its normalization to the Si spectra gated on the 617 keV (2+3 2+1) transition (figure 1(a)) and 608 keV (2+3 0+2) transition (figure 1(b)) is based on matching the energy region between 500 and 1000 keV (see arrows in figures 1(a) and (b)). The γ rays following the de-excitation of the levels fed in the daughter nuclei were detected by two individual HPGe detectors placed outside the vacuum chamber at (Ge1) and (Ge2) with respect to the direction of the incoming beam. The typical energy resolution of each detector for a 1.3 MeV γ ray was ∼3.1 keV (FWHM). Energy and efficiency calibrations were performed using standard sources of 133Ba, 137Cs, 60Co and 152Eu. As explained in [11], the effective absolute efficiency of the HPGe detectors during the decay measurements is lowered with respect to the one determined from the calibration sources due to summing and loss effects related to the high γ multiplicity, the close-detector geometry and the count-rate. The efficiency for the 351 and 367 keV γ lines, the 0+1 transitions in 182Hg and 184Hg, respectively, has been determined by γ–γ coicidences. With this method an efficiency of 0.77(7)% and 0.44(4)% for the 351 keV line in 182Hg was obtained for Ge1 and Ge2, respectively, and 2.0(2)% and 0.71(7)% for the 367 keV line in 184Hg.


Figure 1. Si2 spectrum for A = 184 gated on (a) the 617 keV (2+3 2+1) transition and (b) the 608 keV (2+3 0+2) transition in Ge1 and Ge2. The red curve shows the ΔE background due to the β particles. The K and L electron lines of the 367 keV (2+1 0+1) E2 transition and 375 keV (0+2 0+1) E0 transition are indicated. The arrows indicate the energy range used to normalize the β-ray spectrum to the γ-ray-gated Si spectrum.


Download figure:
Standard image High-resolution imageThe difference in efficiency for the 351 keV in 182Hg and the 367 keV in 184Hg is due to the difference in count-rate. The effect of the multiplicity for the different γ lines within the same isotope was examined and could be ignored in the deduced intensities relative to the 0+ transition.

3. Results
3.1. The β-decay of 182Tl
Narrow-band laser scans probing the hyperfine structure of 182Tl [12] were used to verify the proposed presence of two isomeric states [7]. A different hyperfine structure was observed when gating on γ rays de-exciting high-spin levels or on γ-rays de-exciting low-spin levels, yielding evidence for the existence of two β-decaying states. However, it was not possible to disentangle the two β-decay patterns with reasonable accuracy and therefore the results here are from the mixture of the two isomers.
Figure 2 shows a γ-ray spectrum measured with the Ge1 detector. The assignment of γ lines to the β decay of 182Tl is based on γ–γ coincidences and on previously known transitions [3, 19]. A spectrum of γ rays observed in coincidence with the 351 keV () transition, the strongest transition in 182Hg, is shown in figure 3. Out of the γ–γ coincidences a level scheme was constructed and for many weaker transitions the coincidence spectra were also used to determine relative intensities.


Figure 2. γ-ray singles spectrum obtained at A = 182 by the Ge1 detector. Transitions assigned to the decay of 182Tl are indicated, together with some identified transitions belonging to daughter nuclei. The other lines are due to room background or residual radioactivity due to previous implantations. The numbers next to the peaks give the energies in keV.
Download figure:
Standard image High-resolution image
Figure 3. The γ-ray spectrum coincident with the 351 keV 0+1 transition in 182Hg. The labels in the spectrum give the energy of the transitions in keV.


Download figure:
Standard image High-resolution imageTable 1 summarizes the energy and intensities, relative to the 351 keV transition, of all the transitions identified in 182Hg in the present work, as well as the energy of the initial state and the coincident γ rays.
Table 1. The γ-ray energy, γ-ray intensity relative to the transition at 351 keV, energy of the initial state and observed coincident γ rays for the transitions belonging to the β decay of 182Tl. The γ-ray intensities are determined from the γ singles spectrum, unless otherwise indicated.
| Energy | Relative γ-ray intensity | Initial level | Observed coincident γ rays |
|---|---|---|---|
| (keV) | (%) | (keV) | (keV) |
| 196.7(10) | 1.6(5) | 547.9 | |
| 213(1) | 0.9(3)a | 547.9 | |
| 260.8(6) | 61.5(18)b | 611.9 | 332.4, 351.1, 413.5, 463.0, 586.5, 683.5, 770.7, 817.0, 862.1, |
| 919.0, 936.6, 1154.5, 1373.8, 1398.2, 1475.0, 1807.5, 1837.2, 1953.7 | |||
| 332.4(6) | 23.9(4) | 944.3 | 260.8, 351.1, 413.5, 586.5, 817.0, 862.1, 1398.2, 1475.0 |
| 351.1(6) | 100 | 351.1 | 196.7, 260.8, 332.4, 406.8, 413.5, 463.0, 547.9, 576.4, 586.5, 621.9, |
| 683.5, 714.0, 723.1, 747.9, 770.7, 773.5, 862.1, 913.0, 1156.2, 1218.6, | |||
| 1373.8, 1398.2, 1475.0, 1807.5, 1837.2, 1953.7 | |||
| 378.1(6) | 1.3(5) | 1761.0 | 260.8, 351.1, 770.7 |
| 406.8(9) | 2.3(1) | 1531.0 | 351.1, 547.9, 576.4, 773.5 |
| 413.5(6) | 3.0(6)b | 1357.8 | 260.8, 332.4, 351.1 |
| 463.0(9) | 2.8(1) | 1074.4 | 260.8, 351.1 |
| 471.0(6) | 4.9(1) | 1766.5 | 260.8, 351.1, 547.9, 683.5, 747.9 |
| 526.3(9) | 2.4(1) | 1074.4 | 351.1, 547.9, 714.0 |
| 547.9(6) | 21.7(6) | 547.9 | 406.8, 471.0, 526.3, 576.4, 747.9, 862.1, 913.0, 1218.6 |
| 576.4(6) | 15.0(5) | 1124.4 | 196.7, 351.1, 406.8, 547.9, 862.1, 913.0, 1218.6 |
| 586.5(9) | 3.8(2) | 1531.0 | 260.8, 332.4, 351.1 |
| 621.9(6) | 1.8(4)b | 972.9 | 351.1, 701.7 |
| 627.9(9) | 2.2(7)b | 2010.5 | 260.8, 351.1, 770.7 |
| 632.2(9) | 1.0(1) | 2419.3 | 714.0 |
| 637.8(10) | 1.9(6)b | 972.9 | 701.7 |
| 683.5(9) | 3.7(4)b,c | 260.8, 351.1, 471.0 | |
| 690.1(6) | 2.4(1) | 1986.0 | 260.8, 351.1, 547.9, 683.5, 747.9 |
| 701.7(9) | 2.5(1) | 1674.7 | 621.9, 637.8 |
| 714.0(9) | 2.0(1) | 1788.4 | 351.1, 463.0, 526.3, 632.2, 723.1 |
| 723.1(6) | 5.2(2) | 1074.4 | 351.1, 714.0 |
| 730.3(9) | 1.7(1) | 2449.9 | 351.1, 547.9, 1172.6 |
| 747.9(6) | 12.9(6) | 1295.6 | 196.7, 351.1, 547.9, 471.0, 690.1, 1047.6 |
| 770.7(9) | 7.3(7)b | 1382.6 | 260.8, 351.1, 378.1, 627.9, 1036.6, 1182.8 |
| 773.5(9) | 9.4(18)b | 1124.4 | 351.1, 406.8, 862.1, 913.0, 1218.6 |
| 817.0(9) | 1.3(3)b | 1761.0 | 260.8, 332.4, 351.1 |
| 862.1(6) | 7.2(11)b | 1986.0 | 351.1, 547.9, 576.4, 773.5 |
| 913.0(6) | 2.7(5)b | 2037.4 | 351.1, 547.9, 576.4, 773.5 |
| 919.0(9) | 0.7(1) | 1531.0 | 260.8, 351.1 |
| 936.6(9) | 0.7(3)b | 1548.6 | 260.8, 351.1 |
| 960.7(6) | 1.5(1) | 1508.3 | 351.1, 547.9 |
| 1036.6(9) | 1.2(5)b | 2419.3 | 770.7 |
| 1047.6(6) | 0.9(1) | 2342.9 | 260.8, 351.1, 547.9, 683.5, 747.9 |
| 1154.5(9) | 2.6(4)b | 1766.5 | 260.8, 351.1 |
| 1156.2(9) | 4.3(4)b | 1508.3 | 351.1 |
| 1172.6(10) | 1.8(4)b | 1720.5 | 351.1, 547.9, 730.3 |
| 1182.8(6) | 0.5(1)b | 2565.5 | 770.7 |
| 1197.5(6) | 2.4(3)b | 1547.6 | 351.1 |
| 1218.6(6) | 4.3(5) | 2342.9 | 351.1, 547.9, 576.4, 773.5 |
| 1373.8(6) | 1.6(2) | 1986.0 | 260.8, 351.1 |
| 1398.2(6) | 2.9(4) | 2342.9 | 260.8, 332.4, 351.1 |
| 1475.0(6) | 1.8(3) | 2419.3 | 260.8, 332.4, 351.1 |
| 1807.5(6) | 2.7(6) | 2419.3 | 260.8, 351.1 |
| 1837.2(6) | 5.4(12) | 2449.9 | 260.8, 351.1 |
| 1953.7(6) | 2.5(6) | 2565.5 | 260.8, 351.1 |

a Determined from the γ-ray spectrum in coincidence with the K electron of the ()E0 transition. bDetermined from γ–γ coincidences. cMultiply placed; undivided intensity is given.

The resulting level scheme of 182Hg is shown in figure 4. The β-feeding intensities are based on the intensities from table 1 using the internal conversion coefficients for transitions where the multipolarity is known or deduced. The internal conversion coefficients are taken from [22], except for the conversion coefficient of the 197 keV γ line which was deduced here (see below). It should be noted that the β-decay feedings presented here are upper limits due to the lack of experimental sensitivity to low-intensity, high-energy γ-rays transitions leading to unobserved γ-ray feeding from high-lying states.

Figure 4. Level scheme of 182Hg deduced from the present work (energies in keV). The γ-ray intensities and the intensity of the 335 keV E0 transition are normalized to the 351 keV () transition. The given β-feeding intensities are upper limits. Spin assignments are from NNDC [20] except for the (2+) assignment of the 973 keV level (see discussion in the next section). The QEC value comes from [21].

Download figure:
Standard image High-resolution imageMany new levels and transitions have been identified in this work compared to the previous data [8, 19, 23, 24] obtained from in-beam and decay spectroscopy and the decay properties of several low-lying levels have been significantly improved. The most significant results, in relation to the investigation of the shape coexistence in Hg, are the precise energy determination of the (335(1) keV) and its feeding together with the identification of a tentatively assigned (2+3) state at 973 keV. Both states have been studied through e–γ coincidences.

The identification of the at 328(12) keV in 182Hg was reported for the first time in [24] from the study of the fine-structure of the α decay of 186Pb. In the singles Si spectrum, a strong electron line at 270(19) keV is present which intensity cannot be fully explained by the K conversion of the 351 keV E2 transition, indicating also here the presence of the level through the K electrons of its E0 decay. By inspecting, in figure 5, the γ rays coincident with these electrons, the transitions at 213, 576, 638, 702 and 748 keV can be attributed to a decay pattern feeding the state while the 261 keV γ line is the transition in coincidences with conversion electrons from the intense 351 keV transition. By looking to the events in the Si2 detector in coincidence with the 638 keV transition, see figure 6(b), the electron peak is at 250(14) keV, leading to an E0 transition of 330(14) keV in agreement with the value of 328(12) keV reported in [24].


Figure 5. Part of the γ-ray spectrum in A = 182, background-subtracted, with a gate on the K electron of the E0 transition in 182Hg. The top and bottom panels show the spectrum in a different energy range.

Download figure:
Standard image High-resolution image
Figure 6. Si spectrum at A = 182 gated on (a) the 261 keV transition and (b) the 638 keV transition. The red curve shows the ΔE spectrum due to the β particles. The arrows indicate the energy range used to normalize the β-ray spectrum to the γ-gated Si spectrum.
Download figure:
Standard image High-resolution imageFinally the γ rays observed in coincidence with the 638 and 213 keV transitions lead to the placement of these lines in the level scheme and thus fix the energy of the state at 335(1) keV. The 638 keV line de-excites the level at 973 keV, a candidate for the state (see further in the Discussion section).


In the recent study on 180Hg [5], the transition between the second and the first states was found to have a large E0 component (. The possibility for a E0 component of the 197 keV 2+1 transition in 182Hg was investigated accordingly by inspecting the γ–γ coincidences spectra with gates on the 576 keV and on the 748 keV transition. Both transitions feed the state and allow to study the 197–351 keV γ-ray cascade. As shown in the γ–γ coincidence spectrum gated on the 576 keV transition (figure 7), this transition is coincident with both the 548 keV and the 351 keV lines. The total transition intensity of the 197 keV transition (Itot = 13.4(12)%) could be deduced by comparing the number of counts of the 548 and 351 keV peaks in the coincidences spectra with the 576 and 748 keV transitions. The total transition intensity of the 197 keV line is much larger than its relative γ-ray intensity of 1.6(5)% leading to a total internal conversion coefficient of (Itot–/ = 7.2(13). The theoretical total electron conversion coefficients for a 197 keV M1 and E2 transition are 1.153 and 0.412, respectively [22]. The measured electron conversion implies that the 197 keV transition has a large E0 component.


Figure 7. Part of the γ–γ coincidence spectrum in A = 182 with a gate on the 576 keV transition.
Download figure:
Standard image High-resolution imageThe weak 213 keV transition was not observed in singles nor in the γ–γ coincidence gate on the 576 keV; its intensity was deduced from its coincidence with the K electrons of the 335 keV E0 in the Si detector (see figure 5).

3.2. The β decay of 184Tl
Two different sets of data were collected with the aim to disentangle the decay scheme of the two β-decaying states. In the first data set no LI was used and only through surface ionization (SI) a beam of 184Tl was obtained. This SI data set contains a mixture of the three long-lived states: (10−), (7+) and (2−).
In the second data set, further called as the LI data set, we made use of the in-source laser resonant ionisation technique in narrow bandwidth mode in order to enhance the production of the (10−) isomer and consequentely the production of the (7+) state as the (10−) isomer decays internally to the (7+) state [15]. This was achieved by using a double-step excitation-ionisation laser scheme and tuning the first laser transition at a frequency of 1/λ = 18058.75 cm−1 before frequency doubling (see figure 1 and corresponding explanation in [16]). Information on the internal decay of the (10−) isomer and on the α decay of the different isomers are published, respectively, in [16, 11].
As the half-lives of the two β-decaying states of 184Tl are very similar, the γ rays belonging to one of the two decays could not be disentangled on the basis of their half-life behavior. However, by making use of the two data sets (laser off and laser on resonance to the (10−)), it became possible to deduce the origin of many transitions. This can be seen in figure 8 where two singles γ-ray spectra are shown, one in LI mode and one in SI mode, evidencing strong changes in relative intensity of a number of γ lines.

Figure 8. Singles γ-ray spectra detected by Ge1 at mass A = 184. Red line: LI data; black line: SI data. The SI spectrum is scaled by a factor 0.5.
Download figure:
Standard image High-resolution imageA so-called 'pure' (7+) β-decay γ-ray spectrum, shown in figure 9(b), was obtained by using the LI data and subtracting the SI data normalized to the transition at 608 keV. Similarly, a pure (2−) decay spectrum, shown in figure 9(a), was obtained by using the SI data and subtracting the LI data normalized to the transition at 340 keV. In this procedure we assumed that the state and the 6+ state could be only fed by the decay of (2−) and (7+) states in 184Tl, respectively. Furthermore, in order to remove the contribution of γ rays due to the 47 ms (10−) internal decay, we selected only γ rays emitted after 200 ms following the proton impact on target. The described subtracting procedure was also applied to produce pure (2−) and (7+) Si spectra as well.


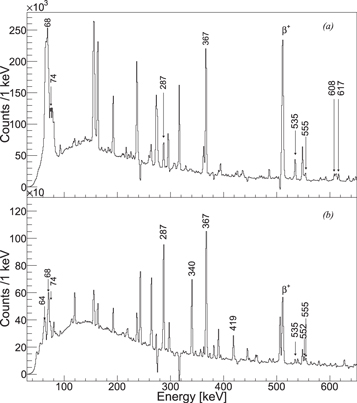
Figure 9. Singles γ-ray spectrum of a pure (a) (2−) decay and (b) (7+) decay in 184Tl from Ge1.
Download figure:
Standard image High-resolution imageIn the rest of the text and for simplicity, we will refer to the two subtracted spectra as the pure (2−) and the pure (7+) spectrum.
All γ transitions attributed to the decay of 184Tl (7+) and (2−) states are listed in table 2 with energies and relative γ-ray intensities. The intensities of the γ rays were calculated from the pure (2−) and (7+) singles-γ-ray spectrum, where possible. For weak γ rays and γ-ray transitions contaminated by other decays than 184Tl, we made use of the branching ratios determined in the original SI and LI data sets.
Table 2. The γ-ray energy, the energy of the initial state, γ-ray intensity relative to the transition at 367 keV, for the transitions belonging to the β decay of 184Tl. In the third and forth columns, the γ-ray intensities determined from the original SI and LI data sets are reported. In the fifth and sixth columns the γ-ray intensities determined from the pure 2− and pure 7+ spectra are given. The intensities are determined from the singles γ-ray spectrum, unless otherwise indicated. For the 375 keV line the intensity of the ( transition is given.


| Intensity in % | |||||
|---|---|---|---|---|---|
| Energy | Initial energy level | ||||
| keV | keV | Surface Ionization | Laser Ionization | 2− | 7+ |
| 118.8(10) | 654.0 | ≤ a | ≤0.5a | ≤0.2b | ≤0.6b |
| 159.2(5) | 534.8 | 0.24(13)c | — | 0.34(18)b | — |
| 168.3(5) | 534.8 | 1.4(3)a | 1.1(4)a | 1.9(4)b | 0.5(1)b |
| 287.1(3) | 654.0 | 33.2(12) | 49.7(18) | 16.6(7) | 63.8(41) |
| 324.6(5) | 1413.6 | 0.85(3) | 1.1(1) | — | 1.6(3) |
| 340.3(3) | 994.3 | 15.3(5) | 31.7(11) | — | 44.9(22) |
| 367.0(3) | 367.0 | 100 | 100 | 100 | 100 |
| 375.5(10) | 375.5 | 7.9(20)d | — | ||
| 389.7(5) | 1803.3 | 1.5(4)a | 3.0(6)a | — | 4.1(11) |
| 418.6(3) | 1412.8 | 6.0(2) | 13.2(4) | — | 17.6(9) |
| 432.8(5) | 1086.6 | 0.8(2)a | 1.7(4)a | — | 1.9(7) |
| 435.3(5) | 1089.1 | 0.9(2)a | 0.4(3)a | 1.9(6)b | — |
| 462.8(5) | 1549.4 | 2.2(1) | 3.9(2) | — | 5.3(6) |
| 534.8(3) | 534.8 | 15.1(5) | 8.9(3) | 21.0(11) | 4.9(4) |
| 551.7(5) | 1086.6 | 5.2(8)a | 8.0(13)a | — | 10.8(26)b |
| 554.2(5) | 1089.1 | 5.5(9)a | 5.1(10)a | 11.1(5) | — |
| 555.4(3) | 1549.4 | 1.6(2)a | 2.8(3)a | — | 3.8(6)b |
| 608.2(3) | 983.8 | 3.7(25)a | 1.5(10)a | 5.7(39)b | — |
| 616.8(3) | 983.8 | 4.9(2) | 2.0(1) | 7.6(4) | — |
| 644.1(3) | 1179.2 | 3.2(3)a | 1.3(5)a | 4.6(3) | — |
| 646.3(3) | 1300.3 | 1.4(2)a | 2.2(3)a | 0.8(1)b | 2.3(4)b |
| 649.5(5) | 2063.4 | 0.9(2)a | 1.7(2)a | — | 2.6(5) |
| 674.6(5) | 1658.3 | 2.3(5) | 1.0(2) | 3.5(3) | — |
| 709.3(5) | 2122.1 | 2.9(2) | 6.3(5) | — | 8.2(10) |
| 719.7(5) | 1086.6 | 3.7(5)a | 5.6(9)a | — | 7.6(6) |
| 722.0(5) | 1089.1 | 3.4(5)a | 2.5(8)a | 3.3(6) | — |
| 731.3(3) | 1818.0 | 0.7(2)a | 1.7(3)a | — | 2.3(4) |
| 754.6(3) | 1738.4 | 1.3(3) | 0.5(1) | 1.9(2) | — |
| 759.4(3) | 1413.6 | 3.6(2)a | 6.2(5)a | — | 9.8(7) |
| 765.6(3) | 1300.3 | 3.9(2) | 5.2(2) | 2.4(2) | 6.7(5) |
| 803.4(5) | 1179.2 | 0.5(2)c | 0.2(1)c | 0.7(4)b | — |
| 809.1(5) | 1803.3 | 0.9(2)a | 2.2(3)a | — | 3.8(6) |
| 813.0(5) | 1179.2 | 1.7(3)a | 0.8(3)a | 2.6(3) | — |
| 878.3(3) | 1872.6 | 0.5(1)a | 1.1(4)a | — | 1.5(7) |
| 894.9(5) | 1549.4 | 0.7(1)a | 1.5(3)a | — | 2.6(6) |
| 915.2(5) | 1450.0 | 1.2(3)a | 0.6(3)a | 2.5(2) | — |
| 1083.0(5) | 1450.0 | 0.8(3)a | 0.4(3)a | 1.3(3) | — |
| 1179.2(5) | 1179.2 | 1.9(1) | 0.8(1) | 2.9(2) | — |

aDetermined from γ–γ coincidences. bDeduced from the branching ratios determined in the original SI and LI data sets. cDetermined from the γ-ray spectrum with a gate on the K electron of the ( E0 transition. dDetermined from the Si spectrum.

In contrast to previous work [14] where only one decay scheme is presented, two decay schemes can be constructed (see figures 10(a) and (b)) involving many new levels. It is clear from the apparent feeding of 20(6)% of the level in the decay of the (7+) state that the assumptions used for producing the pure spectra are not completely fulfilled. As the value is high (9.46 MeV) and only levels in 184Hg up to 2.12 MeV are observed, there is quite room for unobserved γ rays from high-lying states, feeding the lowest states. Therefore the quoted β-feeding intensities are only upper limits.


Figure 10. Decay scheme of the (2−) (a) and (7+) (b) β-decaying states in 184Tl deduced from the present work (energies in keV). γ-ray intensities are normalized to the 367 keV transition. The given β-feeding intensities are upper limits, implying that the logft values are lower limits. The half-life for the low-spin state is from our α-decay study [11]. The half-life for the high-spin state is from the literature [25]. Spin assignments are from NNDC [25], except for the I = (3) assignment of the 1089 keV newly observed level (see discussion in the next session). The QEC value comes from [21].
Download figure:
Standard image High-resolution imageThe relative intensity of the transition present in the 184Tl (2−) decay was determined by using the pure (2−) γ-ray and Si spectra. The 375 keV, , and 367 keV, , transitions are very close in energy and therefore the K-electron peaks of the two transitions cannot be separated in the singles Si spectrum as they appear as one bump located around 290 keV. However, by comparing the Si spectrum gated by the 608 keV line (see figure 1(b)) with the Si spectrum gated by the 617 keV line (see figure 1(a)) and using the known conversion coefficient of the 367 keV E2 line, the 375 keV E0 intensity can be obtained.


Also in 184Tl we investigated the possibility for a E0 component in the 168 keV transition by intensity balance consideration. Figure 11 shows the spectrum of γ rays in coincidence with the 552 keV transition, the strongest γ ray feeding the state. The spectrum shows, together with the peak corresponding to the 535 keV transition, a pronounced 367 keV transition, that can be only explained in terms of a very intense transition. Indeed a total transition intensity of 19.5(49)% of the 168 keV transition can be deduced by comparing the number of counts in the 535 and 367 keV peaks. Since the observed γ-ray intensity in the SI data set is only 1.4(3)%, the transition has a total conversion coefficient of (Itot–/ = 14.2(36). This is the largest value of conversion coefficient known in this mass region.


Figure 11. Part of the γ–γ coincidence spectrum for A = 184 with a gate on the 552 keV transition. The energy of the observed transitions is given in keV.
Download figure:
Standard image High-resolution image4. Discussion
The updated systematics of the lowest positive-parity states in the even–even Hg is shown in figure 12. With the precise determination of the energy of the state in 182Hg, the energy systematic of the , , , and is completed. The identification of the 973 keV level in 182Hg completes the systematics of a level present in the four nuclei with a specific decay pattern, only feeding the , levels, while no transition to the ground state is observed. This leads to the suggestion that it might be the (2+) band-head of the γ-vibrational band built on top of the deformed state [5, 14, 26].


Figure 12. Systematic of the lowest positive parity states and their transitions in the even–even Hg nuclei. The green lines are the γ transitions of the possible γ-vibrational bandhead, i.e. the state. The relative intensities and the spins are taken from the present work and [5, 20, 25, 31].


Download figure:
Standard image High-resolution imageSimilarly to what has been observed in 180Hg, a doublet of states located at 1100 keV is observed in Hg. The two states show a comparable decay pattern to the , , and states but it is unlikely that they have same spin and parity.


In 182Hg , the level at 1124.4 keV was placed on the basis of the 576.4 keV transition towards the level with a possible transition to the level and was interpreted as the member of the oblate band [3]. In the present study the level is confirmed and also the transition to the level is observed. The possible decay towards the level could not be observed as its energy of 512.5 keV is too close to the 511 keV. The new level at 1074.4 keV was observed through its decay to the , , and levels.


In 184Hg, a level at 1086.6 keV was established in two in-beam experiments [27, 28] through the observation of the 552 keV transition to the level and 720 keV transition to the level and interpreted as the member of the oblate band and also, according to NNDC [25] in the β-decay study of [14]. However, in the latter decay study the level lies at 1089 keV and the decay transitions are 554 and 722 keV. From the present study, it is clear that there are two levels and a level at 1089.1 keV is placed in the low-spin level scheme while in the high-spin decay scheme the level at 1089.1 keV is present next to a level at 1086.6 keV. The apparent /EC feeding of the 1086.6 keV level in the () decay with a logft of 6.0 is most probably due to feeding through unobserved γ rays. The strong feeding of the 1089.1 keV level in the () decay leads to a tentative (3) spin assignment.


Based on the relative γ-ray intensities (see figure 12), in both isotopes the assumed oblate level decays favorably to the state relative to the decay towards the state, with a factor 6.9 for 182Hg and 5.4 for 184Hg. This can be understood by using the mixing amplitudes deduced in [2, 4] for the and states. The squares of the mixing amplitudes of the normal configuration of the state are 97% and 96%, respectively in 182Hg and 184Hg, thus indicating a rather pure oblate character. The states of the unperturbed bands are instead almost completely mixed giving a state with 71% of the normal configuration in 182Hg and with 49% of the normal configuration in 184Hg.


The large conversion coefficient for the to transition in Hg is a strong fingerprint of shape coexistence as strong E0 transitions are the result of considerable mixing of two states with a large difference in deformation [29]. Combining the measured conversion coefficients with the re-evaluated B(E2) values from the Coulomb excitation experiments [2] will result in E0 transition strength (E0) values which can be compared with different theoretical models [30].


5. Conclusion
The low-lying excited states in Hg have been investigated following the β decay of Tl. The decay schemes of these nuclei have been extended and revised based on high-quality γ–γ coincidence data. The detailed level scheme of the lowest energy states in Hg and the precise description of their decay properties (energy of the transitions, intensity and conversion coefficients), which were achieved in this analysis, provided crucial information for the re-evaluation of the Hg Coulomb excitation study performed at REX-ISOLDE with the Miniball setup [30].


Acknowledgments
We thank the ISOLDE collaboration for providing excellent beams and the GSI Target Group for manufacturing the carbon foils. This work was supported by the European Commission through the Marie Curie individual fellowship program (FP7-PEOPLE-2009-IEF—252951—SHAPEXPIUM) and through I3-ENSAR (Contract No. RII3-CT-2010-262010) within the Seventh Framework Programme; by FWO-Vlaanderen (Belgium), by GOA/2010/010 (BOF KULeuven), by the IAP Belgian Science Policy (BriX network P6/23); by a grant from the European Research Council (ERC-2011-AdG-291561-HELIOS), by the United Kingdom Science and Technology Facilities Council (STFC); by the Slovak grant agency VEGA (Contract Bo. 2/0105/11 1/0613/11); by the Slovak Research and Development Agency (Contract No. APVV-15-0225); and by the Reimei Foundation of Advanced Science Research Center (ASRC) of JAEA (Tokai, Japan).